Nasdaq 100: Market Optimism Builds Ahead of Big Tech EarningsNasdaq 100: Market Optimism Builds Ahead of Big Tech Earnings
The earnings season is gaining momentum. This week, major technology companies such as Alphabet (GOOGL) and Tesla (TSLA) are scheduled to release their quarterly results.
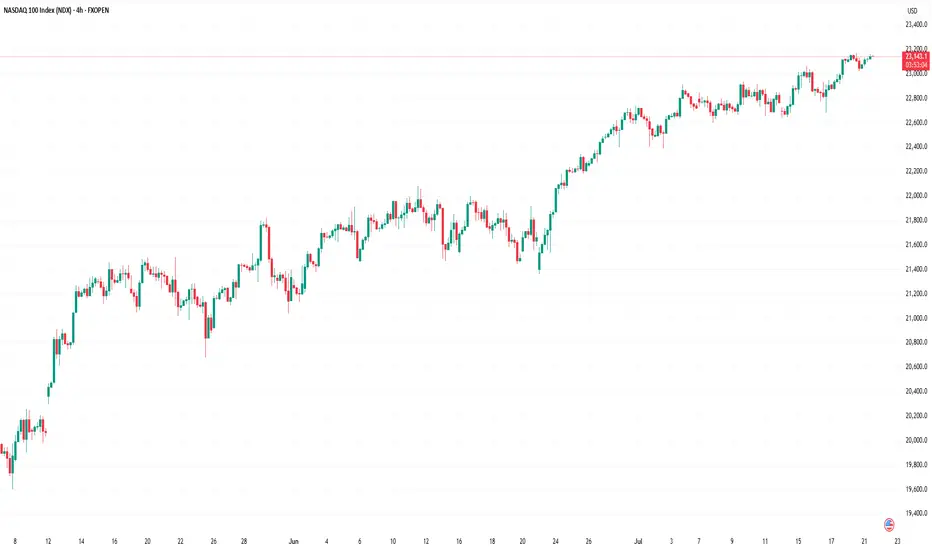
Given that 85% of the 53 S&P 500 companies that have already reported have exceeded analysts’ expectations, it is reasonable to assume that market participants are also anticipating strong results from the big tech names. The Nasdaq 100 index (US Tech 100 mini on FXOpen) set an all-time high last week — a level that may be surpassed (potentially more than once) before the end of August.
Technical Analysis of the Nasdaq 100 Chart
Price movements have formed an upward channel (marked in blue), with the following dynamics observed:
→ The bearish signals we highlighted on 7 July did not result in any significant correction. This may be interpreted as a sign of a strong market, as bearish momentum failed to materialise despite favourable technical conditions.
→ Buyers have shown initiative by gaining control at higher price levels (as indicated by the arrows): the resistance at 22,900 has been invalidated, while the 23,050 level has flipped to become support.
→ A long lower shadow near the bottom boundary of the channel (circled on the chart) underscores aggressive buying activity.
Should the earnings and forward guidance from major tech firms also come in strong, this could further reinforce the sustainable bullish trend in the US equity market.
This article represents the opinion of the Companies operating under the FXOpen brand only. It is not to be construed as an offer, solicitation, or recommendation with respect to products and services provided by the Companies operating under the FXOpen brand, nor is it to be considered financial advice.
Nas100idea
NASDAQ 100: AI Momentum and Resilient Earnings Drive New HighsThe NASDAQ 100 continues its strong uptrend 📈, recently breaking to new highs after a period of consolidation. The rally is broad-based but remains led by heavyweight tech names and AI-related stocks 🤖.
Key Fundamental Drivers:
AI & Tech Growth 🤖💡: The biggest catalyst is the ongoing boom in artificial intelligence and digital transformation. Companies in the index, especially the “Magnificent Seven” (like NVIDIA, Microsoft, Apple), are seeing robust earnings growth and strong investor demand for AI exposure. Global IT spending is projected to grow by over 9% in 2025, with AI spending up nearly 30% year-on-year.
Earnings Resilience 💪💰: Despite high interest rates and inflation, tech companies have adapted well, maintaining strong margins and growth. The sector is expected to remain a top performer through 2025.
Fed Policy & Rate Expectations 🏦🔮: Markets are increasingly pricing in a pause or even cuts in US interest rates later in 2025, which is bullish for growth stocks and tech-heavy indices like the NASDAQ 100.
Geopolitical & Macro Factors:
Reduced Uncertainty 🌏🕊️: The market has absorbed major geopolitical shocks (such as the Israel-Iran conflict and US-China trade tensions), and the resolution or de-escalation of these risks has reduced uncertainty, supporting risk assets.
US Election & Policy 🇺🇸🗳️: The outcome of the US election and expectations for stable or pro-business policies have also contributed to positive sentiment.
Global Supply Chains & Resilience 🌐🔗: While some risks remain (e.g., cyber threats, regulatory changes, and supply chain disruptions), the tech sector’s global reach and adaptability have helped it weather these challenges.
Why is it rallying now?
AI optimism and strong tech earnings are the main drivers 🤖💹.
Expectations of easier Fed policy and a resilient US economy are fueling risk appetite 🏦📈.
Geopolitical risks have eased or are being priced in, allowing investors to focus on growth 🌍🕊️.
Summary:
The NASDAQ 100’s rally is powered by AI-driven tech growth 🤖, resilient earnings 💪, and easing macro/geopolitical risks 🌏. The index remains a global leader as investors bet on the next wave of technology and digital innovation 🚀.

NAS100 LongNow that we have an official strong bullish close breaking previous highs on the weekly and monthly time frame. We will look for a potential pullback. The 3M candle is currently on track to closing as a strong bullish engulfing. Also, a 1M morning start followed up by a bullish momentum candle.

NAS100 Bullish Breakout SetupNAS100 Bullish Breakout Setup 🚀
🧠 Chart Analysis (H4 timeframe)
🔹 Ascending Channel:
Price has been trending inside a clear ascending channel (blue zone), supported by higher highs and higher lows.
🔹 Support & Resistance:
Support: Around 21,635.32 – tested multiple times (highlighted by 🔵 arrows).
Resistance: Around 22,265.19 – recent highs and psychological barrier.
🔹 Double Bottom Formation 👣:
Near support zone, a potential double bottom (bullish reversal pattern) is visible. The neckline has been challenged.
🔹 Breakout Confirmation 🟢:
Price has broken above the descending neckline of the double bottom and is hovering near 21,644, indicating potential bullish continuation if sustained.
🔹 Target 🎯:
Projected breakout target lies at 22,265.19, aligning with the previous resistance zone.
🔹 Volume & Momentum 📊:
While not shown, a breakout above the neckline generally needs strong volume confirmation to validate the move.
📌 Conclusion:
If price sustains above the 21,635 – 21,644 area and gains momentum, the path to 22,265 looks likely ✅. However, a false breakout could drag the price back into the channel.

NASDAQ Analysis: Navigating Uncertainty in a Shifting LandscapeThe NASDAQ has been on a rollercoaster ride lately 🎢, reflecting both global macro shifts and sector-specific dynamics. After dipping into bear market territory earlier in the year, the index has rebounded strongly, powered by mega-cap tech and the ongoing AI boom 🤖. However, the mood remains cautious as investors weigh political and economic cross-currents. Note how price action is stalling at the current level.
Fundamentals & Earnings 💼
Earnings Resilience: Q1 2025 earnings for NASDAQ heavyweights were robust, with tech giants posting double-digit growth. Yet, forward guidance is more muted, as companies brace for the impact of higher tariffs and global supply chain adjustments.
Valuations: The recent rally has pushed forward P/E ratios well above long-term averages, making the market more sensitive to any negative surprises 📈.
AI & Innovation: Capital expenditure on AI is set to exceed$300 billion this year, keeping the sector in the spotlight and fueling optimism for long-term growth.
Political & Geopolitical Factors 🌍
Trade Policy: The U.S. and China have agreed to a temporary pause on new tariffs, easing some immediate concerns. However, the average effective tariff rate remains much higher than last year, and uncertainty lingers as legal challenges and further negotiations loom.
Fiscal Policy: U.S. deficit worries are back in focus, with new legislation projected to add trillions to the national debt over the next decade. This has contributed to higher Treasury yields and a weaker dollar 💵.
Global Competition: International equities have outperformed U.S. stocks over the past six months, but history suggests this may be stretched, and a reversal could be on the horizon.
Market Sentiment & Technicals 📊
Volatility: While volatility has eased from its spring highs, sentiment remains fragile. Consumer and business confidence indices are at multi-year lows, even as hard economic data (like jobless claims) remains resilient.
Sector Rotation: Growth and cyclical sectors—especially tech, consumer discretionary, and industrials—have led the rebound, but investors are increasingly selective, favoring companies with strong fundamentals and global reach.
Outlook: The NASDAQ is cautiously optimistic for the second half of 2025. The market is pricing in a couple of Fed rate cuts by year-end, but the path forward depends on inflation trends, trade clarity, and corporate earnings.
Key Takeaways 🚦
The NASDAQ is in recovery mode, but faces headwinds from trade policy, fiscal uncertainty, and stretched valuations.
Political developments—especially around tariffs and fiscal policy—will be key drivers of volatility.
Long-term, the AI and tech innovation wave remains a powerful tailwind, but near-term caution is warranted.
Disclaimer:
This analysis is for informational purposes only and does not constitute investment advice. Markets are volatile and subject to rapid change. Always do your own research and consult a financial advisor before making investment decisions.

NASDAQ 100 Setup After Bearish Pullback. My Bullish Game Plan!🚀 NASDAQ US100 Update – Key Levels I'm Watching 💡📈
Looking at the NAS100 right now, we’ve seen a strong rally kick off after the weekend 📊🔥 — this comes on the back of an aggressive bearish pullback last week 📉.
📌 My bias is bullish, but with a condition: I want to see price retrace into the 10-minute fair value gap and hold above the previous low 🧠🔍.
If we get a clean pullback, followed by a continuation with higher highs and higher lows, I’ll be watching closely for the first bullish break after that next pullback — that’s where I’d look to position long 🐂📈.
🛑 Not financial advice.
👇 Drop a comment if you're watching these levels too!

NASDAQ US100 Overextended? Waiting for the Pullback🚨 NASDAQ #100# Analysis 🚨
I'm currently watching the NASDAQ (US100) 📊, and in my view, it's looking overextended. Price is now trading into previous daily highs 📈 without showing a meaningful retracement. Historically, when we look back at the chart, we rarely see such strong rallies without some form of pullback 🔄.
A healthy trend typically follows a natural rhythm — rally, retrace, rally or expand, pull back, expand again. In this case, that retracement is missing ❌, which raises caution flags for me 🚩.
🎥 In the video, I break down:
Price action & market structure 🧩
The current trend 📉📈
A potential long opportunity — but only if price pulls back into my point of interest (POI) 🧲 and we then get a bullish break in market structure (BoS) 🟢.
🔒 This is not financial advice. Always do your own research and trade responsibly!

Will NASDAQ Continue Its Climb? Here's my Trade Plan.📈 NASDAQ 100 (NAS100) Technical & Price Action Outlook 💡🚀
The NASDAQ has been in a strong bullish trend, driven by optimism around interest rates, tech earnings, and positive momentum. 📰💻 While price has pushed up aggressively, it’s now trading near key highs and buy-side liquidity zones—a spot where I’m anticipating a possible pullback. 🔁💰
I’m watching closely for a retracement into the 50% Fibonacci zone—my point of interest for a potential long setup. 🎯📐 However, I’ll only consider entering if price breaks structure bullish (BoS) after the pullback. 📊🧠
The index is still recovering from earlier 2025 losses, and resistance lies just ahead—so risk management is key. 🧘♂️⚠️
Not financial advice.

NAS100 Testing Lows: Will a Bounce Offer a Sell Opportunity?NAS100 Technical & Fundamental Analysis 🧐
Overall Sentiment: The current market sentiment surrounding tech stocks and the broader indices like the NASDAQ 100 appears cautious, leaning bearish. Factors like persistent inflation concerns, uncertainty around the Federal Reserve's future interest rate path 🏦, and ongoing geopolitical tensions can weigh heavily on growth-sensitive assets like tech stocks. Keep an eye on upcoming economic data releases (CPI, PPI, FOMC minutes) as they could significantly sway sentiment.
1. Daily Timeframe (D1): The Bigger Picture 🗺️
The NAS100 is exhibiting clear bearish characteristics on the daily chart, forming lower highs and lower lows.
Price is currently approaching or testing a significant area of previous daily equal lows. This is a critical zone ⚠️. Why? Because significant buy-side liquidity often rests below such lows (in the form of stop-loss orders from long positions) and sell-side orders may trigger if these levels break decisively.
A strong break and close below these daily lows could signal a continuation of the major downtrend, potentially accelerating selling pressure. Conversely, this area could act as temporary support, prompting the pullback you're anticipating.
2. 4-Hour Timeframe (H4): The Setup Structure 🏗️
My H4 chart clearly illustrates the recent sharp decline. Price is currently testing the support zone highlighted (around 17,800 - 18,000), which corresponds to the 0.00% Fibonacci level (17,973.8) drawn from the recent swing high (~19,117.4).
This support zone aligns with the concept of hitting the daily lows/liquidity area.
Anticipated Scenario:
I am expecting a reaction (a bounce/pullback) from this current zone. The projected path suggests a retracement towards the 50% Fibonacci level (Equilibrium) at approximately 18,547.3. This level often acts as significant resistance after a strong impulse move. The 61.8% level (~18,682.6) is also a key area to watch just above it.
Point of Interest (POI):
The zone between the 50% and 61.8% Fib levels (roughly 18,550 - 18,700) is your key decision area for a potential short entry. 👍
3. 15-Minute Timeframe (M15):
Entry Confirmation Trigger 🔫
The M15 timeframe will be crucial if price reaches your H4 POI (around the 50% Fib level).
What to Look For: During the potential pullback towards ~18,550, the M15 will likely show a temporary bullish structure (higher highs and higher lows).
Confirmation Signal:
For your short setup, you'd want to see this M15 bullish structure fail upon reaching the H4 resistance zone. Look for:
A break of market structure (BOS) to the downside on M15 (price making a lower low after failing to make a higher high).
Formation of clear M15 lower highs and lower lows.
Bearish candlestick patterns (e.g., engulfing candles, pin bars/shooting stars) rejecting the H4 resistance/Fib level.
Potential divergence on indicators like RSI or MACD (though price action is primary).
Synthesized Outlook & Strategy:
The NAS100 is undeniably in a bearish phase across multiple timeframes. The current test of daily lows / H4 support (~17,973) is a critical juncture. A bounce from here seems plausible, aligning with your expectation of a pullback.
The Strategy:
Patience: Wait for price to potentially rally towards the H4 50%-61.8% Fibonacci retracement zone (~18,547 - ~18,682). 🧘♀️
Confirmation:
Monitor the M15 timeframe closely as price approaches this zone. Look for a clear shift in market structure from bullish (pullback) to bearish (resumption of trend). 📉
Entry: If bearish confirmation occurs (M15 BOS), consider a short entry.
Targets:
Initial targets could be the recent lows (~17,973), followed by the Fibonacci extension levels shown on your chart (e.g., -50% at ~17,400.4) or the area below the daily equal lows. 🎯
Risk Management: Crucially, define your stop-loss level (e.g., above the swing high formed during the M15 structure break or above the 61.8%/78.6% Fib level) to manage risk effectively. 🛡️
Fundamental Check:
cross-reference this technical setup with any major news releases or shifts in market sentiment that could invalidate the pattern. 📰

Tactical US100 Trading: Converting 1W Trend into 30m Opportunity📈 The US100 index is currently exhibiting a bearish trend pattern on the weekly timeframe. We can observe a notable rally followed by a retracement into equilibrium when analyzed against the previous price wing range.
🔎 Currently, the index is positioned at a premium level, creating an environment where short sellers might be building positions in anticipation of further downward movement. However, market dynamics remain highly sensitive to external influences, particularly unexpected statements and social media announcements from influential figures like Donald Trump.
🌊 With such market unpredictability in play, focusing on shorter timeframes provides more actionable intelligence. Price action signals offer clearer guidance in this volatile environment.
⚡ Trade Opportunity: The 30-minute chart reveals a defined trading range worth monitoring. A definitive break above this range could present an opportunity to enter long positions, while a breakdown below support might signal a favorable short entry point.
🎯 This breakout strategy enables traders to respond to actual market movements rather than attempting to forecast the broader market direction—a particularly valuable approach given the current unpredictable market landscape.
⚠️ DISCLAIMER: This analysis is provided for informational purposes only and does not constitute financial advice. Trading carries significant risk of capital loss and may not be appropriate for all investors. Historical performance does not guarantee future outcomes. Always perform independent research and consider your personal financial circumstances before executing any trades. Market conditions are subject to rapid changes, and no trading methodology ensures profits. The information presented should be used as one of many inputs in your decision-making process.

"NAS100 / US100" Index CFD Market Heist Plan (Day or Swing)🌟Hi! Hola! Ola! Bonjour! Hallo! Marhaba!🌟
Dear Money Makers & Robbers, 🤑 💰💸✈️
Based on 🔥Thief Trading style technical and fundamental analysis🔥, here is our master plan to heist the "NAS100 / US100" Index CFD Market. Please adhere to the strategy I've outlined in the chart, which emphasizes long entry. Our aim is the high-risk Red Zone. Risky level, overbought market, consolidation, trend reversal, trap at the level where traders and bearish robbers are stronger. 🏆💸"Take profit and treat yourself, traders. You deserve it!💪🏆🎉
Entry 📈 : "The heist is on! Wait for the MA breakout (20000) then make your move - Bullish profits await!"
however I advise to Place Buy stop orders above the Moving average (or) Place buy limit orders within a 15 or 30 minute timeframe most recent or swing, low or high level.
📌I strongly advise you to set an alert on your chart so you can see when the breakout entry occurs.
Stop Loss 🛑:
Thief SL placed at the recent/swing low level Using the 1H timeframe (19400) swing trade basis.
SL is based on your risk of the trade, lot size and how many multiple orders you have to take.
🏴☠️Target 🎯: 20800 (or) Escape Before the Target
🧲Scalpers, take note 👀 : only scalp on the Long side. If you have a lot of money, you can go straight away; if not, you can join swing traders and carry out the robbery plan. Use trailing SL to safeguard your money 💰.
"NAS100 / US100" Index CFD Market Heist Plan (Swing/Day) is currently experiencing a bullishness,., driven by several key factors.
📰🗞️Get & Read the Fundamental, Macro, COT Report, Geopolitical and News Analysis, Sentimental Outlook, Intermarket Analysis, Index-Specific Analysis, Positioning and future trend targets.. go ahead to check 👉👉👉
📌Keep in mind that these factors can change rapidly, and it's essential to stay up-to-date with market developments and adjust your analysis accordingly.
⚠️Trading Alert : News Releases and Position Management 📰 🗞️ 🚫🚏
As a reminder, news releases can have a significant impact on market prices and volatility. To minimize potential losses and protect your running positions,
we recommend the following:
Avoid taking new trades during news releases
Use trailing stop-loss orders to protect your running positions and lock in profits
💖Supporting our robbery plan 💥Hit the Boost Button💥 will enable us to effortlessly make and steal money 💰💵. Boost the strength of our robbery team. Every day in this market make money with ease by using the Thief Trading Style.🏆💪🤝❤️🎉🚀
I'll see you soon with another heist plan, so stay tuned 🤑🐱👤🤗🤩

NAS100 Turn of the Month Strategy Meets Market Volatility!In this video, we dive into the Turn of the Month Strategy and explore how it could play out in the current market environment. Historically, mutual funds rebalance their portfolios at the end of the month, creating buying pressure that often leads to higher stock prices into the new month. Additionally, recurring financial inflows, such as monthly salary payments and pension contributions, tend to boost market demand during this period.
However, this month presents a unique challenge. The NASDAQ 100 has capitulated into the end of the month, driven by heightened volatility and uncertainty fueled by Donald Trump's rhetoric. With the market currently trading into a significant support zone and liquidity pool, we analyze whether the Turn of the Month effect can counteract the recent bearish momentum.
📊 Key Highlights in the Video:
Price Action Analysis: The NASDAQ 100 is deeply overextended, trading into a critical liquidity pool.
Trade Idea: A potential counter-trend rally could emerge as the market seeks to correct and rebalance.
Strategy: Look for a short-term rally into resistance, followed by a possible shorting opportunity as the market resumes its downward trend.
This video is perfect for traders looking to combine price action trading with seasonal strategies like the Turn of the Month effect. Will the market rally into the new month, or will bearish momentum prevail? Watch now to find out! 🚀

NASDAQ Trade Plan: From 4-Hour Trend to 15-Minute Execution!NAS100 Strategy: Using Fibonacci and Market Structure for Precision!
📊 In this NASDAQ (NAS100) trade idea, I focus on a top-down approach starting with the 4-hour chart. If the 4-hour trend is bullish, I look for higher highs and higher lows. If bearish, I focus on lower highs and lower lows. 🔄 My key strategy is identifying pullbacks into equilibrium—around the 50% Fibonacci retracement level—within any price swing. This is my point of interest.
Once price moves into this area, I shift to the 15-minute chart to refine my entry. 🔍 Here, I wait for a break of structure during the pullback, aligning with the overall trend direction. This approach allows for precise execution while staying in sync with the larger trend. 🚀
⚠️ This is not financial advice. Always trade responsibly and manage your risk.

Will NASDAQ Rally Continue? Technical Analysis & Trade Idea.NASDAQ NAS100 (4H Chart) Analysis 📊📈
The NASDAQ NAS100 is showing strong bullish momentum on the 4-hour chart. The chart suggests a continuation of the uptrend, with a potential move toward the 21,013.0 target. 🚀
Key Levels to Watch 👀
Support Levels:
19,750.9: Near the 61.8% Fibonacci retracement, this level has seen strong buying interest.
19,405.8: The 100% Fibonacci retracement, marking the swing low and a critical support zone.
Resistance Levels:
20,209.4: The 0% Fibonacci retracement, acting as immediate resistance.
20,611.2: The 50% Fibonacci extension, a key target for bullish continuation.
21,013.0: The 100% Fibonacci extension, representing the ultimate bullish target in this trend.
Volume Profile Insights 📉
The Volume Profile shows heavy trading activity between 19,800–20,000, confirming strong support in this range. Above 20,200, trading volume thins out, suggesting that a breakout could lead to a quick rally toward 21,000.
Momentum and Indicators ⚡
Trend: The index is in a clear uptrend, forming higher highs and higher lows since the recent swing low.
Fibonacci Confluence: The alignment of the 50% retracement and Volume Profile support strengthens the bullish outlook.
Curved Arrow Projection: A pullback to the 19,800–19,750 zone is likely before the next leg higher toward 21,013.0.
Social Media Sentiment 🌐
Twitter: Analysts are optimistic, citing strong tech sector performance and easing interest rate fears. Many traders are eyeing the 21,000 level as the next milestone.
Reddit: Discussions emphasize the importance of the 19,800 support zone, warning that a break below this level could invalidate the bullish setup.
Conclusion 📝
The NASDAQ NAS100 is set for a bullish continuation, with key support at 19,750–19,800 and resistance at 20,209.4 and 21,013.0. Watch for a potential pullback to the 50% Fibonacci retracement before the next upward move. A break below 19,750 could signal a shift in momentum, while a breakout above 20,209.4 would confirm the bullish trend. 🚀
Disclaimer: This analysis is for informational purposes only and not financial advice. Always do your own research and consult a professional before trading. 📢

NAS100 I Potential Gap Fill and More Growth to 21,000Welcome back! Let me know your thoughts in the comments!
** NAS100 Analysis - Listen to video!
We recommend that you keep this pair on your watchlist and enter when the entry criteria of your strategy is met.
Please support this idea with a LIKE and COMMENT if you find it useful and Click "Follow" on our profile if you'd like these trade ideas delivered straight to your email in the future.
Thanks for your continued support!Welcome back! Let me know your thoughts in the comments!

NAS100 Analysis: Potential higher timeframe pullback in playOn the higher timeframe, NAS100 remains bullish. However, recent price action suggests that a higher timeframe pullback may be underway, providing a discounted price opportunity.
On the daily chart, a market structure shift occurred when NAS100 broke below the 20,477 level. The most recent price action indicates a short-term pullback to the upside on lower timeframes, potentially to mitigate the internal supply zone and reach premium price levels.
I am closely watching the 61.80% Fibonacci retracement level around 21,028 for potential selling opportunities, with downside targets at 19,113 and 18,297.
How Are You Trading NAS100 This Week?
Share your thoughts in the comments!
If you found this analysis helpful, please support it with a boost. Also, follow for more updates!

NAS 100 Overextended – Brace for a Pullback! The NAS 100 is looking highly overextended at the moment 📊. Market conditions are precarious, with many instruments trading into key support and resistance levels on both the daily and weekly timeframes ⏳.
A sharp pullback 📉 could be on the horizon, potentially offering a counter-trend buying opportunity on the lower timeframes for the US 100 💰. If it pushes higher, it may set up a potential short trade 🎯.
🚨 Not financial advice – trade wisely and manage your risk! ⚖️

NAS100 Analysis: Key Levels & Bearish Trade Setup📊 NAS100 Analysis and Trade Idea | Key Levels & Bearish Bias Explained 📉
Dive into a detailed analysis of the NAS100 (NZ 100) with a focus on key support zones, retracement levels, and a bearish trading bias. Learn how to identify overextended price movements, imbalances, and potential short setups using the daily and 4-hour timeframes. Perfect for traders looking to refine their strategies in indices trading! 💡 💬 Share your thoughts and trading ideas in the comments below!

Is the NAS100 Setting Up for a Reversal? Here’s My Game Plan!👀 👉 In this video, we break down the US100, which appears overextended after pushing into a key weekly high. A significant retracement could be on the horizon this week. I’ll walk you through my trading strategy, covering breakout trades and trend continuation setups. 🚨 *Not financial advice.

NASDAQ 100 Hits Key Resistance: Is a Retracement Imminent?In this video, I analyze the NASDAQ 100 (#NAS100) as it trades into a key resistance level, appearing overextended on the 4-hour timeframe. I discuss the potential for a counter-trend trade, targeting a retracement to the 50% Fibonacci level of the previous price swing. Watch for insights and strategies on navigating this setup! Not financial advice.

Bearish Shift in NAS100: What’s Next for the US100 Trend?👀 👉 In this video, we take an in-depth look at the NAS100, analyzing its trend, market structure, price action, key support and resistance zones, and how liquidity is influencing the market. Currently, the US100 is approaching an important support level following a bearish market structure shift. We discuss possible strategies if the trend continues. All the details are covered here. Please note, this is not financial advice.

Uptrend or Reversal? Unpacking a Case for NAS100! The NAS100 has been trending bullish recently, but when we zoom out to a higher timeframe, there’s a case to be made for a potential bearish opportunity. In the video, we explore the trend, price action, and market structure, analyzing how it’s approaching a key resistance level. We also discuss a possible trade setup if the conditions align. This is not financial advice.

NAS 100 Counter-Trend Opportunity: Possible Bounce from Support 📊 The NAS 100 looks overextended right now. It’s tapped into a key liquidity pool support zone, and I’m eyeing a potential counter-trend trade back up to equilibrium. ⚖️ After that, we could see another sell opportunity if the price action aligns. 🚨 *This is not financial advice.*
