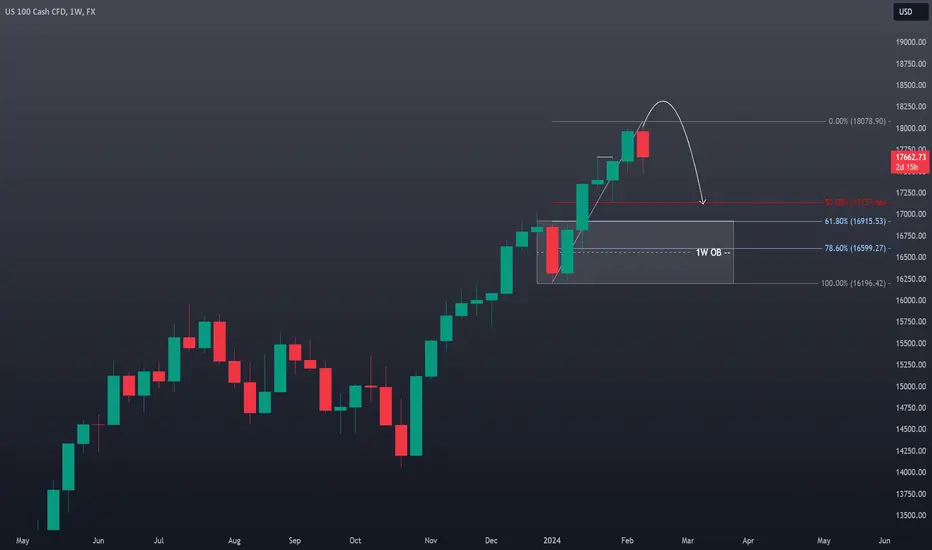
NAS100 Technical Analysis and Trade Idea
Market Observations: The #NAS100 has maintained a bullish trajectory. However, price action on the monthly timeframe suggest the #US100 is overextended. Additionally, the weekly chart reveals a double top pattern, hinting at a potential retracement down to the 50-61.8% Fibonacci levels. This area could provide the liquidity needed for major market players to fill long orders.
Trade Strategy: Consider an intraday/swing trade short entry following a potential stop run above the current range. Target an initial profit level around the previous lows near 17250, with a secondary target at 17000 (slightly above the 61.8% Fibonacci level on a 1W chart). Implement a well-placed stop-loss order to manage risk effectively.
Disclaimer: This analysis is based on my observations and does not constitute financial advice. Conduct your own independent research and carefully assess your risk tolerance before making investment decisions.
Nas100idea
NAS100 Technical AnalysisThe #NAS100 has been on an upward trend, but a potential triple top pattern is forming on the chart. If the #DXY retraces further and rebounds from support, the #US100 could spike above the current high, potentially taking out buy-side stop-loss orders before pulling back down to the 61.8% Fibonacci level. Remember, trading the #NASDAQ involves significant risk. This analysis is just my opinion and shouldn't be considered financial advice.

Nas100 HTF Analysis I expect Nas to reach 17k in the next few weeks. Nas has been pushing up relentlessly last few weeks so expecting ATLEAST a nice pullback. Once we hit 17k tho we could see all time highs again!

NAS100 Trade IdeaThe NAS100 experienced a substantial rally towards the end of last week, displaying signs of being significantly overextended. A retracement may be in store, particularly if the Dollar Index (DXY) maintains and strengthens its position, considering the general inverse correlation between DXY and US100. It is essential to emphasize that this analysis is provided exclusively for educational purposes and should not be construed as financial advice.

Nas100 Short SetupExpecting H4 to change to bearish after taking the previous day’s low so anticipating the H4 making a LH here and dropping. Possibly seeing a move down during Asian session, although this is rare. Risking .5% of my account and targeting 3R.

NASDAQ 100 TECHNICAL UPDATENasdaq 100 technical analysis, as am going long on the indices, looking for the market to go back again on the all time highs.

US100 NASDAQ Technical Analysis and Trade Idea NAS100Sharp Retracement in NAS100: Opportunity on the Horizon?
Eyes are laser-focused on the NAS100 after it slammed into a key resistance level. The current aggressive pullback sets the stage for an intriguing dynamic ahead of the NFP data drop later today. A strong dollar boost (or unexpected weakness) could significantly impact the index, making this data release a potential swing point.
With such a sharp retracement already underway, I'm eyeing a potential long entry as the price plunges towards a crucial support zone. In the video, we dissected the trend, price action, market structure, and other technical essentials to build a comprehensive picture.
Remember: This analysis is purely for educational purposes and should not be interpreted as financial advice. Do your own due diligence before making any trading decisions.

US30 and NAS100 Possible buy zone!Hello traders, this is a complete multiple timeframe analysis of this pair. We see could find significant trading opportunities as per analysis upon price action confirmation we may take this trade. Smash the like button if you find value in this analysis and drop a comment if you have any questions or let me know which pair to cover in my next analysis.

NAS100 TECHNICAL FORECASTHere I explain my forecast for Nas100,:
For short position I will be looking for break of the support and a clear retest and find entry, and my target for short position will be 15560.0 level.
For Long position , I am more interested on how market will react on the current support level, taking into consideration momentum, price action patterns and rejections I will be looking to buy the market at the support, using the basic law of trading which says " buy low and sell High" right now we are low at the support leve1.

US100 NASDAQ Technical Analysis And Trade Idea NAS100Lately, the NAS100 has displayed a strong bullish trend. This video extensively explores the trend, meticulously analyzing price movements and identifying possible trading prospects by thoroughly assessing both the weekly and daily timeframes. Anticipate a detailed assessment of price behaviors, market patterns, trend assessments, and key technical analysis components. It's crucial to emphasize that the content provided is purely for educational purposes and should not be interpreted as financial advice.

It is a matter of time before Nasdaq hits an all-time high.As you can see, Nasdaq broke the crucial zone, did some pullbacks, and made a higher high. Now it is a matter of time.

POSSIBLE TEMPORARY BEARISH ENTRY FOR NAS100PEPPERSTONE:NAS100 BLACKBULL:NAS100 VANTAGE:NAS100 OANDA:NAS100USD
Hello everyone, upon watching closely multiple timeframes where I combine a few types of chart analysis (support & resistance, candlestick patterns, breakout strategy, etc.) I'm thinking NAS100 will go bearish, at least temporarily, because ultimately the price movement in the charts tell us all, and my goal is always to read it right.
That chart I'm sharing with you is pretty self explanatory.
Make sure to comment your thoughts below and let me know any questions you might have if you have any.
My goal is to try and always be helpful, and while I sometimes fail (I'm a human not a robot) I do my best to always be better, and I never see failure as the final destination.
If you got to this point, happy profiting!

NAS100 US100 Technical Analysis and Trade Idea NASDAQIn this insightful video, we delve into the NAS100's intriguing movements as it encounters crucial resistance levels on both the monthly and weekly charts. With the week drawing to a close, we scrutinize the possibility of an assertive retracement.
Our discussion extends beyond surface analysis, encompassing market structure, intricate price actions, meticulous trend analysis, and pivotal elements of technical analysis. This comprehensive coverage sheds light on the intricate dynamics shaping the NAS100's trajectory.
As a standard practice, this video offers a comprehensive view for educational purposes. However, it's essential to clarify that the content presented here isn't intended as financial advice.

US100 NAS100 Technical Analysis and Trade IdeaIn this video, we conduct an in-depth analysis of the NAS100, focusing on its current bearish sentiment evident on the higher timeframes. Notably, the US100 index has recently approached a critical support level. Our discussion within the video encompasses vital components of technical analysis, such as the prevailing trend, price action dynamics, market structure, and other fundamental aspects of technical analysis. Towards the latter part of the video, we explore a potential trade opportunity.
It is crucial to emphasize that the content presented is exclusively for educational purposes and should not be regarded as financial advice. It is essential to acknowledge that trading in the currency markets involves a significant level of risk. Consequently, the prudent integration of risk management strategies into your trading plan is absolutely imperative.

NAS100 DAILY ANALYSIS After taken liquidity of the buy side of this week and fill FVG we will see a continuation of down trend to taken liquidity sell side and fill FVG of up trend so that's just a retaracement we are still in brearish move.
-- Tading is probability control your risk management.
Good luck !

NAS100 and US30 Top-down analysis Hello traders, this is a complete multiple timeframe analysis of this pair. We see could find significant trading opportunities as per analysis upon price action confirmation we may take this trade. Smash the like button if you find value in this analysis and drop a comment if you have any questions or let me know which pair to cover in my next analysis.

NAS 100 I Tendency to riseWelcome back! Let me know your thoughts in the comments!
** NAS100 Analysis - Listen to video!
We recommend that you keep this pair on your watchlist and enter when the entry criteria of your strategy is met.
Please support this idea with a LIKE and COMMENT if you find it useful and Click "Follow" on our profile if you'd like these trade ideas delivered straight to your email in the future.
Thanks for your continued support!

NAS100 I Retest the resistance Welcome back! Let me know your thoughts in the comments!
** NAS100 Analysis - Listen to video!
We recommend that you keep this pair on your watchlist and enter when the entry criteria of your strategy is met.
Please support this idea with a LIKE and COMMENT if you find it useful and Click "Follow" on our profile if you'd like these trade ideas delivered straight to your email in the future.
Thanks for your continued support!

NASDAQ RiskyRisk 0.5%
TP1 = 1:1 RR
Disclaimer:
The contents in this Idea are intended for information purpose only and do not constitute investment recommendation or advice. Nor are they used to promote any specific products or services. They serve as an integral part of a case study to demonstrate fundamental concepts in risk management under given market scenarios. A full version of the disclaimer is available in our profile description.

NAS100 Top-down analysis Hello traders, this is a complete multiple timeframe analysis of this pair. We see could find significant trading opportunities as per analysis upon price action confirmation we may take this trade. Smash the like button if you find value in this analysis and drop a comment if you have any questions or let me know which pair to cover in my next analysis.

NAS100 Top-down analysis Hello traders, this is a complete multiple timeframe analysis of this pair. We see could find significant trading opportunities as per analysis upon price action confirmation we may take this trade. Smash the like button if you find value in this analysis and drop a comment if you have any questions or let me know which pair to cover in my next analysis.

NAS100 Top-down analysisHello traders, this is a complete multiple timeframe analysis of this pair. We see could find significant trading opportunities as per analysis upon price action confirmation we may take this trade. Smash the like button if you find value in this analysis and drop a comment if you have any questions or let me know which pair to cover in my next analysis.

NAS100 Top-down analysis Hello traders, this is a complete multiple timeframe analysis of this pair. We see could find significant trading opportunities as per analysis upon price action confirmation we may take this trade. Smash the like button if you find value in this analysis and drop a comment if you have any questions or let me know which pair to cover in my next analysis.
