NAS100: Intraday-SwingThe weekly is bearish. And the daily has not breached the last lowest low as of yet. so it may still carry liquidity until it reaches the low point. price is at the 13300 psychological level and looking for a test at the 13225 level and maybe a reversal. the trendline has been broken with momentum so my bias is that the trend will continue only until being tested at the daily Order Block.
Nas100short

NAS100: Intraday-SwingThe weekly is bearish. And the daily has not breached the last lowest low as of yet. so it may still carry liquidity until it reaches the low point. price is at the 13300 psychological level and looking for a test at the 13225 level and a reversal. the trendline has been broken with momentum so my bias is that the trend will continue until being tested at the daily Order Block.

Potential Shark Forming 🦈🦈NAS100 - Potential Shark Forming, bullish momentum with trapped liquidity and imbalance above (Which is also the 4H swing high point, If that breaks i'll be looking to take this long to the D point and then short (With confirmation of course)
SPX and US30 are bullish on the HTF if they stay bullish i expect NAS to break and follow the trend, either way price needs to head up there to fill the imbalance/mitigate the S/D zones!
Let me know your thoughts!
* Disclaimer **
These ideas I never trade until the end target with my initial lots, I focused on high probable entries with higher lots and use a specific partial taking strategy giving me a very high win rate and take most of my profits very early, I only leave a small % of my capital to run the entire trade. On the flip side im constantly monitoring LTF momentum and will close early if things change, these analysis's are for research purposes only.

NAS100 - Short Trade Idea - 13840.00NAS100, Sell 15 m
Entry - 13900.80
Stop Loss - 13920.80 (20 pips)
Take Profit - 13840.80 (60 pips)

Nas100 remains vulnerable to the downside|New UpdateHey traders,
This is just a quick update on our Nas100 projection. Yesterday I mentioned of why I thought it would be relevant to look for short positions on Nas100. My bias still remains although there were no much movement Yesterday despite some whipsaws that we saw during New York session yesterday. As technical traders, we should always scrutinize and follow new market developments. When new developments unfold we should be swift to change our positioning.
As of now, the change in trend will only be determined how bulls react today. If they successful push price beyond the falling channel then it would signal a change of trend. As long as price is within this falling channel, sellers will continue to press and their focus will be the demand zone at 13000.
I know you friends would have different opinion. I think it is best to also make it clear that this is my opinion and it is mine alone. Hahahaha. I would respect your view and will never want to criticize it because what one sees in the market others would see it differently. Technically speaking, we all have different trading strategies, styles and market approach. That's why there's a winner and that's why there's a looser. We all can't win or loose at the same time. That's what makes trading fun. We trade what we see, we trade our plans.
In addition, my ideas should only be viewed as expression of thoughts and opinions and not investment advice.
If you find my ideas helpful, please do not hold back your appreciation with likes. To share your opinion just remember to be kind here and clearly state why your opinion should matter.
Thank you!

NAS Outlook 4/2
My sentiment is bearish on NAS, however I expect price to turn around and take out everyone who thinks they got in early.
This gives us bullish opportunities early in the week. I am only interested in prices in and around the unmitigated 5min OB for long entries. Not interested on the long side of NAS till it does something to change my opinion.
Sells are valid from significant retracements to relevant POIs. However I don't see price truly turning around till about 15123.
These are not live orders in the market. I enter trades off most current price action.

Potential Butterfly Forming 🦋 NAS100 - Potential butterfly forming with D Point landing on a very strong OB. Price is falling towards very strong demand zones.
First demand zone I'm predicting a pullback-creating inducement, before price then breaks down to the D point for the true reversal in the premium Daily zone.
Let me know your thoughts!

Shark Almost Complete 🦈NAS100 - Nice 4H Shark almost complete, looking for a push up-to the next strong supply zone with a D point completion landing on a very nice imbalance fill/OB, could get a small pullback first but structure overall is bullish, looking very good for buys!
Let me know your thoughts!
* Disclaimer **
These ideas I never trade until the end target with my initial lots, I focused on high probable entries with higher lots and use a specific partial taking strategy giving me a very high win rate and take most of my profits very early, I only leave a small % of my capital to run the entire trade. On the flip side im constantly monitoring LTF momentum and will close early if things change, these analysis's are for research purposes only.

Shark Almost Complete!NAS - Similar outlook to US30, looking for price to tap into the supply zone above (Completing the .886 of the shark) and retrace down towards one of the demand zones before then breaking the highs and completing the 1.13 of the shark!
Let me know your thoughts!
* Disclaimer **
These ideas I never trade until the end target with my initial lots, I focused on high probable entries with higher lots and use a specific partial taking strategy giving me a very high win rate and take most of my profits very early, I only leave a small % of my capital to run the entire trade. On the flip side im constantly monitoring LTF momentum and will close early if things change, these analysis's are for research purposes only.

🐻US100 SHORTUS100 has been quite bullish the previous week. Price has recently reached an area of resistance on the 1D chart and is showing strong rejections off it.
Price has now formed a more complex correction which could either be a continuation or a reversal.
Considering The overall trend, we could see price break higher as this could just be a breakout build up.
I'm more confident in a short position though.
When selling, we should look for any bearish signals and the highest probability one would be price testing the trendline for the third time.
Targets for shorts should be at the support below.
CURRENCYCOM:US100

Shark Pattern Complete 🦈🦈NAS100 - Shark pattern complete, still waiting for a pullback, we've had some LTF imbalance fills (Do have LTF and HTF confirmation for sells) price is consolidating on the weekly high, i'm looking for a retracement before a break of the high.
Let me know your thoughts!
* Disclaimer **
These ideas I never trade until the end target with my initial lots, I focused on high probable entries with higher lots and use a specific partial taking strategy giving me a very high win rate and take most of my profits very early, I only leave a small % of my capital to run the entire trade. On the flip side im constantly monitoring LTF momentum and will close early if things change, these analysis's are for research purposes only.

NAS100 / US 100 SHORTHi traders
We had a great trading week so far.
This will be our market outlook for Thursday 17 March 2022
Let us know what you think.
#ForexPeopleFX

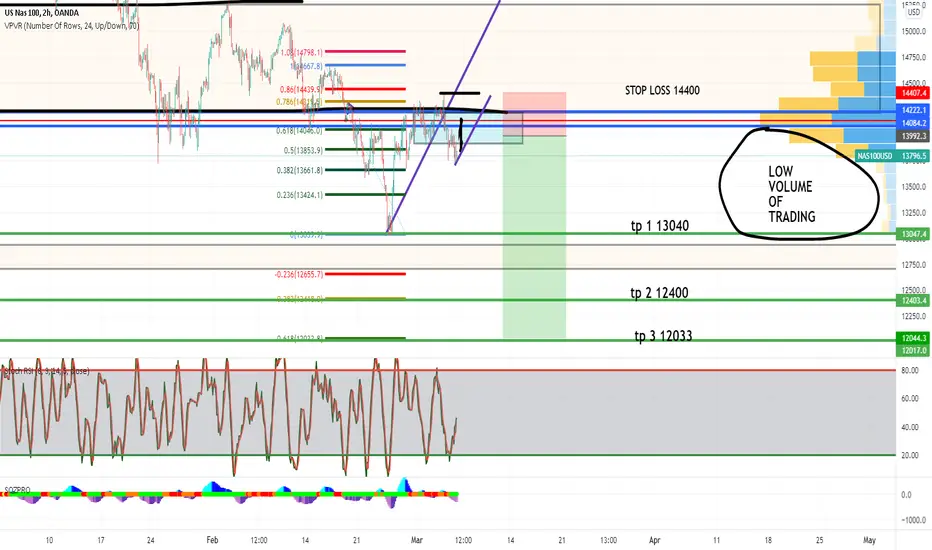
NAS100 SELLING OPPORTUNITY FOR 800 PLUS POINTS NAS100 From a weekly and daily perspective are still showing sign of downside pressure AND AT THIS TIME ALL IT TAKE IS 1 CATALYST FOR THIS PAIR TO CONTINUE MOVING TO THE DOWNSIDE SINCE BREAKING THE POINT OF CONTROL AT 14000 FROM A VOLUME PERSPECTIVE THERE ARE 3 POTENTIAL LANDING SPOTS WHICH ARE
TP 1 13040
TP 2 12400
TP 3 12033
STOP LOSS 12400
RISK/REWARD RANGES FROM 1:2.2 TO 1:4.6
STYLE OF TRADE: SWING TRADE
Nas100 bearish outlook and NFP expectationTraders, due to the tension between Russia and Ukraine the stock market was left volatile the past days and without clear indication as to where it is heading. But looking at the technical aspect of Nas100 we can only tell that it is in a strong bearish momentum and bulls are finding it hard to push price further high. Price dropped at around 14400 and we see it again trading within the falling channel. My expectations in few minutes during NFP are to see price rolling down and perhaps bears pushing price lower targeting 13200 or at least 13000 if possible.
Please support this idea with likes.❤️
Please trade smart.

Nas100usd daily trade setup Nas100usd daily trade setup market change the trend now i expecting bearish trend wait for supply retest then we enter sell for long term

NAS100 SELL/SHORT FORECASTThis is what we potentially forecast what can happen to NAS100/US100 today
#ForexPeopleFX

1:16 😂 1:16 RR on NAS100
.
if i lose it's a small lose , i can take that if you can't take that just go.
.
This is Not Financial Advice, JUST AN OPINION OF THE ONION.
.
JUST AN OPINION OF THE ONION.
.
JUST AN OPINION OF THE ONION.
.
JUST AN OPINION OF THE ONION.

NAS100/US100 SELL TO BUYHi everyone
Its Friday & we all know how markets can be.
We are potentially looking at SELL to BUY for today if buy zone hold.
If we are buying we looking at
TP 14375
Potentially we could go to 14500.
Let us know what you al thing by commenting & giving us a .
#ForexPeopleFX
#FPFXFamily
#GrowingPipsTogether

1:13 on NAS1001:13 RR on NAS100
.
.
Black lines are where you can Take Profit
.
This is Not Financial Advice, JUST AN OPINION OF THE ONION.

NAS100 still bearish?Hello guys, NAS100 has dropped over 300 points within a few hours. I am still bearish on NAS100.
We can wait for price to come back around 13320 area before looking for sells again to follow the trend.
Let me know what you think in the comments below!

Potential Shark Forming 🦈🦈NAS100 - Looking for a pullback/imbalance fill before a continuation to the downside wiping the liquidity and completing this shark pattern.
The D point is landing in a very nice looking PRZ
Let me know your thoughts!
* Disclaimer **
These ideas I never trade until the end target with my initial lots, I focused on high probable entries with higher lots and use a specific partial taking strategy giving me a very high win rate and take most of my profits very early, I only leave a small % of my capital to run the entire trade. On the flip side im constantly monitoring LTF momentum and will close early if things change, these analysis's are for research purposes only.

NAS100 hrly short | Algo Trading NAS100 hrly short
shortstop @ 14476
TP #1 @ 14351.20 78.48% wr
TP #2 @ 14236.06 56.96% wr
SL @ swing high 14677 11.39% hr
WR and HR Determined from past trades on this pair.
More trades like this on my profile and on Bifrost Trades.

NAS100 Bearish on 15min TimeframeFollowing the idea I published on NAS100 a few hours ago, I am monitoring the trade very closely.
On 15min Timeframe, we can see that another Dark Cloud Cover is formed so I will be holding the trade and looking to secure some profits around 14490 if nothing goes wrong.
