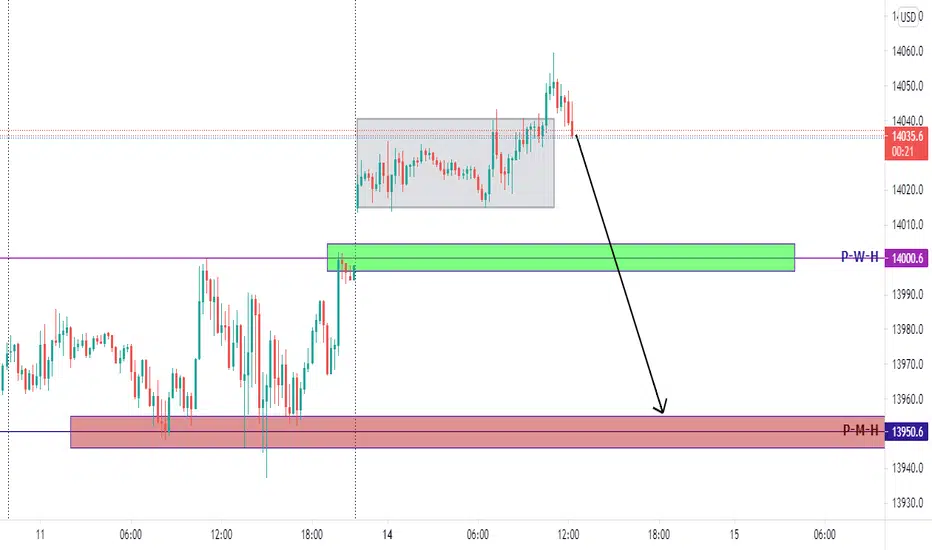
NAS100 exhaustion???After getting a decent reaction from 15100 level we pushed back up asian session to grab some liquidity from 15150. Will the market have enough power to push up through 15200 during NY or will we see a stong early week end of month sell off. ONLY TIME WILL TELL but im on the sell side.
Nas100short

SHORT POSITIONNas100 Technical
FORECAST BEARISH
We had some nice bull run on nas100 last now we are at a strong level of resistance
am looking for shorts on nas100 my analysis already confirm short and also fundamentals


Nas100 broke the trendNas100 has broken the trend line and it has now retested the trend line after the break, which means the selling is been initiated.

Nas100 on a short PatternNas100 on a sell point, we have been selling this pair and we are on a sell mode again as the pattern has been completed.

NASDAQ 4H Analysis This is my analysis of NASDAQ under the 4H time frame
Trend line was broken and I notice significant BEARISH momentum in play with the last 3 candles.
I await for a break of structure and confirmation candle to close below said structure. I will enter on the 1H / 30min time frames.

NAS100MY NAS100 people what's happening , will the NASDAQ CONTINUE to move further up !! or will we see a bounce to the down side? Let me know what's up

US100 BUYPut US100 on watch list I am going to keep you updated on this chart let make money and live life

Nasdaq ShortThis is how we expect for Nasdaq to move down, with some reactions to our supports and resistances,
Lets see how goes ...
@FxShzd

nas100 buynas100 buy
Reasons :
1)nice pattern trend indicates to go up
2)my ema line touching the support levels which are being marked then it automatically hits up
we expect the stock will rise up once it touches the blue line and expect it to go until the green line level.
don't buy now,trade only when you see another support level,
or buy only when you see 2 naked bullish and bearish candles beside each other.

NAS100 SHORT-TERM SELLHey, if you like this idea be sure to support with a like and a follow.
Here is my analysis for NAS100 for the upcoming week, wait for price to pullback to retest resistance and take a short down to the next support area .
What are your thoughts? Leave it in the comments below!
Blue Signal FX Rules-Based Trading
1. CHECK THE NEWS!
2. WHAT IS THE OVERALL TREND?
3. IS PRICE AT A LEVEL OF SUPPLY OR DEMAND (SUPPORT OR RESISTANCE)?
4. IS PRICE APPROACHING A LEVEL OF SUPPLY OR DEMAND (SUPPORT OR RESISTANCE)?
5. ARE YOU TRADING WITH THE TREND OR AGAINST THE TREND (MAKE SURE YOU ONLY TRADE AGAINST THE TREND ON THE 4HR TIME-FRAME AND ABOVE.
6. CHECK FOR DIVERGENCE.

Nasdaq Daily Reversal — Arbitrage & Sectorial RotationAmidst a financial market strongly distorted by the thirst of control from the central banks & their monetary policy craze headed exclusively toward supporting inflating assets valuation, it's become more & more obvious prices no longer represent neither economic reality nor actual asset value (assuming they ever did). Therefore, in such a climate of financial & speculative assets hyperinflation, it's highly interesting not to be too directional, on major indexes as an exemple, and rather seek arbitrage trading between different sectors. Today i'm proposing a Daily Nasdaq reversal short, within the aforementioned framework of arbitrage, as a hedge-trade against the Dow Jones, Tech vs Industrials .
Let's have a look at the Nasdaq/Dow Daily spread-chart FX:NAS100/FX:US30*100 (the *100 in the mnemonic was added to obtain more detailed «Volume profile» data / rows) :
As you can see, the spread between the two sectors has been ranging since summer of last year, showcasing clear arbitrage strategies being put in place between the two assets / indexes. Strategies that were most likely triggered as a result of widespread doubt amongst market professionals about global assets' valuation and their direction. Now addressing the technicalities of our spread, it should be noted that, on that specific timeframe, we've already broken the range' support during early of March. The spread reaching its upper pitchfork/canal boundary in conjunction with a 76,4% Fibonacci retracement right after breaking its range' support, points out toward a pretty good timing to start taking action on the components of spread itself. We can also witness a few enticing overload signals on the momentum/sinewave indicators, but signals on spread-charts are never to be taken too seriously as they're not extremely reliable.
To end with the spread-chart and contextualise a little bit more in-depth, this year long recent hedge trade on the two major U.S indexes becomes even more obvious when you switch to the Monthly timeframe, just to realize that NDX/DOW is a monthly range as well. You can also easily notice that the Daily hedge-trade strategies that have been put in place since summer 2020 coincidently happened to be taken on prices very close from the 2000 highs of the spread-chart (the year 2000 which happened to mark the end of the .com tech crazed bubble). Hesitation on a monthly top, heh.
So we've got short term timing & technical elements aligning with the broader decade long context, good. Now let's take a look specifically at our Nasdaq chart to outline more relevant technical elements that are going to lead to our trade.
Starting with the context : on the Monthly timeframe we can see that our beloved tech sector is no less than a bubble : a parabolic structure perpetually accelerating with increasingly ascending support trendlines, and not materializing any kind of consolidation whatsoever. It should also be mentioned that we havent finished a Monthly momentum cycle since 2012 (2010 for the Quarterly timeframe). Bubble meaning no cycle, consequently meaning a market structure' maturity excruciatingly harder to discern — that is besides the volatility burst & the chaotic range that precedes the final excess leading to the market top. A context to handle with care, to say the least.
Now that we know the broader direction the market is currently taking, we can start to look at our timeframe of reference, the Daily one :
Here are the different technical elements i could outline from that chart :
Prices
Reaching the upper boundary of both the Schiff Pitchfork & the Regular Trend Canal
88.6% Fibonacci extension hit & showing short term price slowdown
138.2% Fibonacci retracement from the last downward consolidating move, supposing a potential running or expanded flat
Signals
Cycle Alignement of both Sinewave & Momentum
Momentum about to print an overload signal (will confirm or not depending on the next Daily closes)
Momentum pointing at a possible triple divergence
Would appreciate an engulfing bearish candle close on the Daily timeframe within the next few days
Risk Management
The invalidation on this Nasdaq Short costs 3%, therefore i won't expose more than half of my capital on this position, that way i'm risking no more than 1.5% of my capital as a speculative loss on this trade (and even less with the Dow long part incoming). Validation levels are showcased on the chart based on «footprints» (historical low volume areas found using volume profile), lower boundaries of channels / pitchfork and Fibonacci retracements. TP 2 means at most a total of 50% profits taken on the original position. The rest will be held for lower targets on the Weekly / Monthly timeframes.
I'll further update this analysis as soon as the Dow Jones reaches its next supports areas (if it does so), especially since those same areas will allow me to start executing the opposite part of this hedge-trade (the long one).
But that's it for now
Hope this idea will inspire some of you !
Go easy on leverage and don't forget to hit the like/follow button if you feel like this post deserves it ;)
Kindly,
J.M.K

NAS100 Long valid and running ☝️👍Entry details are shown on the chart.
We're only looking for TP3.
Trade history can be seen below this trade idea too for full transparency.
------------------------------------------
I try and share as many ideas as I can as and when I have time. My trades are automated so I am not sat in front of a screen daily.
Jumping on random trade ideas 'willy-nilly' on Trading View trying to find that one trade that you can retire from is not a sustainable way to trade. You might get lucky, but it will always end one way.
------------------------------------------
Please hit the 👍 LIKE button if you like my ideas🙏
Also follow my profile, then you will receive a notification whenever I post a trading idea - so you don't miss them. 🙌
No one likes missing out, do they?
Also, see my 'related ideas' below to see more just like this.
The stats for this pair are shown below too.
Thank you.
Darren.

NASDAQ 100 MONDAY SHORT TO PREVIOUS MONTH HIGHI think its going to re-test previous month's high and then shoot back up

NAS100 Bullish Range Buy Zones
NAS100 is currently ranging between 12900-138000.
Support is around 13400.
If price drops it might be wise to set buy limits around 13400-13550.
Price may not drop at all. Price could go bullish from here. Trade what you see.
NAS100 is bullish on the bigger time frames.

Nasdaq 100 outlookAfter the double bottom in 13000 zone, Nas100 has recovered and gained 5% in just 2 days of trading.
However, at this point 13700-13800 is resistance and we can see a new leg down from this point.
Only Nas100 back above 14000 would negate this scenario

Nas100 short Support being tested multiple times (70% fib is the zone of support) if it closes below support. We can expect more distribution in the market as supply meets demand on the next key zone of support. If predictions are correct we would then see this as the finished portion of a correction as nas continues its never ending Upward trend . Haha. TP and SL indicated in the chart.
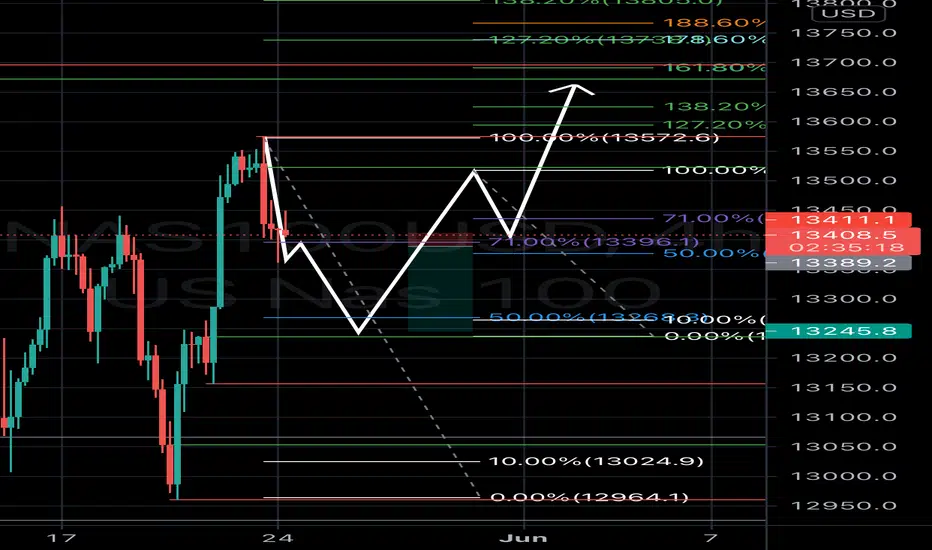
NAS100 POTENTIAL IDEAI am seeing that there will be three target points for the market to touch. Using the fib tool, I was able to indicate where exactly it will go off of the last impulse.

What kind of market correction could we expect?In this comparison between the #NASDAQ $NAS100 and $TSLA we could see some Bearish Momentum in the months ahead.
Look for Signs of Distribution
P.S. Let me know what markets you like to look at!

Nasdaq (Double top)As we can see the market re-tested the 13834.8 level, than after that continued with a downtrend,
A typical example of a double top, A double top pattern consists of several candlesticks that form two peaks or resistance levels that are either equal or near equal height. As we traders look to take sell positions after plotting of the neckline. This neckline can act as an entry point for going short

Sell Nasdaq, Wait for rejecionPrice is coming back to a supply zone. If we can see price reject, we should see a drop down to 13000.

