NASDAQ 100 BELOW 11000 GOING TO 9000 BEFORE APRILHi after Talks on Economy hitting Bottom by December 2023 we still in recession. January Rally almost over. Now Back to Reality!!!
have a good day Stay Profitable!!
Patience is a Skill!!
Nas100short

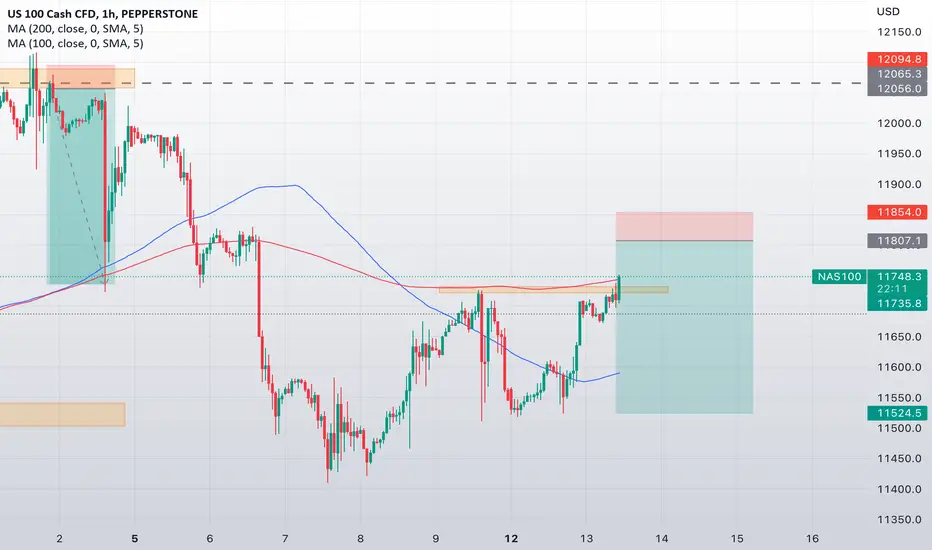
ANALYSIS ON NASDAQ100Hey Traders,
Here is my Analysis of NASDAQ100, using the bar pattern to track is movement.
I hope this helps you see what I am seeing.
Happy Trading guys,
Cheers to your Profits !!

NAS100 top-down analysisHello traders, this is a complete multiple timeframe analysis of this pair. We see could find significant trading opportunities as per analysis upon price action confirmation we may take this trade. Smash the like button if you find value in this analysis and drop a comment if you have any questions or let me know which pair to cover in my next analysis.

NAS100 top-down analysis Hello traders, this is a complete multiple timeframe analysis of this pair. We see could find significant trading opportunities as per analysis upon price action confirmation we may take this trade. Smash the like button if you find value in this analysis and drop a comment if you have any questions or let me know which pair to cover in my next analysis.

NAS100 Short / STC TRADINGPEPPERSTONE:NAS100
Hello Traders! This is my analysis of NAS100 for this day.
I engaged my selling positions on my accounts and my clients did too.
as you can see even on the 4h timeframe we have a triple top and rejection there and if you take a look on the daily you'll see the big move to the downside is coming
Leave a like if you agree and write your opinion in the comments!
Nasdaq bearish channel or Xmas Rally Ok so we are ready to go in few hours time!
Take a look at this bearish channel and take it to consideration. As I explained in the previous post this is the perfect strategy and it is important to look at these major resistance and support levels which can ultimately decide the market direction. Personally I am looking at a big sell off as dollar has taken 2 weeks of punishment and as it is in a major support area.

NAS100 BearishPlease find the analysis within charts and TP levels. Calling bearish until Santa Rally.

NAS100 SHORTNas100 Double Top R2 Rejection
Nas100 is looking to have found Resistance and Double Top is confirming short position

NAS100 BiasNAS100 BIAS- BEARISH
Notes- Wouldn’t look for buys until we get above 12k with clear PA.
I would love to hear anyone else’s bias/feedback on NAS for the week of 11/20-11/25
Keep in mind we have Unemployment, Retail Sales & FOMC news on Tue-wed 11/22 - 11/23

NAS100 top-down analysisHello traders, this is a complete multiple timeframe analysis of this pair. We see could find significant trading opportunities as per analysis upon price action confirmation we may take this trade. Smash the like button if you find value in this analysis and drop a comment if you have any questions or let me know which pair to cover in my next analysis.

NAS100 Short Bias - ICT ConceptsHey traders, here is the analysis for the NAS100. If you guys like my analysis please hit like👍 and follow. Thanks. DISCLAIMER:- This is not financial advice.

NAS100 1h Short SellI have interest in this orderblock/Supply zone. It has a great expansion or drop away from the level and it even left behind a fair value gap. But if price continues breaking swings to the downside, I will promptly lose interest in this sell set up. The drop, whether price retraces or not, is supported by the daily time frame where it seems that price is heading for a huge fair value gap to fill.

CVS - Short After breaking a strong bullish rally, the bears have managed to pull the price of the said stock below 0.786 fib retracement level.
Considering another strong bearish candlestick on an hourly chart, the prices are likely to fall below to the 0.618 level. A strong indication for short-selling.

AAPL - Short SellUsing fib retracement, strong support and resistance points can be seen. Considering breakage of a strong bullish channel, the prices are likely to remain range bound in the correction phase.

US100/NAS100 SHORT TO LONGHi everyone
Its been a while since we shared our ideas here.
Lets us know what you think & join our community.
#ForexPeopFx

NAS100 top-down analysisHello traders, this is a complete multiple timeframe analysis of this pair. We see could find significant trading opportunities as per analysis upon price action confirmation we may take this trade. Smash the like button if you find value in this analysis and drop a comment if you have any questions or let me know which pair to cover in my next analysis.

NASDAQ: sideways trades on Intraday, Short on multiday till...Hi Traders,
This is my view for this week on NASDAQ.
12000 will be the KEY AREA for a long term perspective. In the meantime, I'll keep on being LONG on Intraday (today from 11200 area)
I remind you that this is only a forecast based on what current data are.
Therefore the following signal will be activated only if specific rules are strictly respected.
I really hope you liked this content and I would like to know what do you think about this analysis, so please use the comment section below to give me your point of view.
Pit
DISCLAIMER:
Trading activity is very dangerous. All the contents, suggestions, strategies, videos, images, trade setups and forecast, everything you see on this website and are the result of my personal evaluations and was created for educational purposes only and not as an incentive to invest. Do not consider them as financial advice.
———————————

NAS100 SELLING OPPORTUNTITY AFTER RETRACEMENT 9/12
Us30 has already made a solid move to the downside
and broken a weekly trendline as well. Even though Nas100
has made a solid move to the downside as well I there is more
room to the downside after a retracement. The area that I
expect the market to rise to is the 15560 to 15620 area which is past
support turn future resistance.
If you like analysis like this check my TRADEWITHTRAVIS live stream on Sundays at 4pm, Monday's at 8pm and Wednesday's at 9:30 pm

NAS100 top-down analysisHello traders, this is a complete multiple timeframe analysis of this pair. We see could find significant trading opportunities as per analysis upon price action confirmation we may take this trade. Smash the like button if you find value in this analysis and drop a comment if you have any questions or let me know which pair to cover in my next analysis.

NAS100 SELL ENTRYNAS100 is going down the HnS inverted pattern failed, so look for a sell, good luck

NAS100 SHORTNAS100 Setting up beautifully for a HUGE swing trade for a potential sub- 9000 target... Perfect time to catch the Top for the D Leg completion

NAS100 top-down analysisHello traders, this is a complete multiple timeframe analysis of this pair. We see could find significant trading opportunities as per analysis upon price action confirmation we may take this trade. Smash the like button if you find value in this analysis and drop a comment if you have any questions or let me know which pair to cover in my next analysis.

NAS100 (POTENTIAL BUY LEVEL) ***BEARISH SENTIMENTThis is just my basic MONTHLY charting.
I have marked what I see as the bottom (support).
I see overall DOWNTREND.
I have marked my potential BUY LEVELS for LONGS/CALLS.
