It’s so obvious Recession is the most searched word in the financial context for 2022.
What to expect next: People will gradually wake up from the “over optimism” phenomena due to the logically facts that will lead to the decrease in growth and lost in the labor force.
If you link all the negative events, then it’s a no brainer.
Nas100short

★★★★★NAS100 touch the downtrend line,shortAt the daily chart, Nas100 had touch the downtrend line which formed since January,2022. maybe short it with a few stop-loss.

SELL NAS100NAS100 Setup / Analysis
🕐 4hr's Chart
Key Technical / Reason's SHORT
———————————
What is our confirmation?
- Breakout trendline and retest
- Resistance Support level
- Pressure zone
- Pivot and MA rejection confluence
- Ascending Pattern
- Descending Pattern
- The pivot zone
- Demand Supply
- Candlestick Patterns

NAS100| Over 700 pips bearish move prediction!Hello everyone,
It was not a surprise that the FED could raise interest rate yesterday. After FOMC, we saw the stock market rallying up which eventually did a push up on NAS100. Technically, NAS100 has reached a significant key level. We also see that the index is in a rising channel. I believe the downward pressure on the index is far from over considering the fact that interest rate is being increased very rapidly with hope of taming inflation. In the near future I believe the index may still test the 11k. In line with my previous predictions, the index may still try to extend to the falling trendline and probably that is when we will witness a big decline in the index. As for now I believe the support of the rising channel may be an easy target for the bears.
Here is my forecast:
After clear confirmation that bears will defend 12600 zone, I anticipate price to decline for more than 700 pips. For short positions I will look out for these levels for possible target levels.
12292.67
11908.06
However, I am not dismissing any bullish moves. If bears fail to defend the key level and the entire area around it we could see price rising.
If you find this idea helpful, please do support it with likes.
If you have different opinion or suggestion please share in the comment section below.
Trade smart.

Nas100 Short PositionWe are looking at Nas100 1 Hour time frame, we can see that there is a double top and price is failing to breakout multiple times
I'm waiting for a breakout on the support level to take a short position.

NAS100 SHORT BSL wiped before Breaking Structures to the downside
BSL wipe tapped into last weeks FVG

NAS100 H4 Bearish trend resumes?PEPPERSTONE:NAS100
25 July 2022
Trade Plan
Instrument: NAS100
Timeframe: H4
Description
Price appears to lose momentum for a bullish move at price handle 12942,70 suggesting failure of bullish move. Hence the Projected C leg of Bearish Cypher pattern is likely to be invalidated.
That means, price is likely to revisit 11284.8-11069.4 support zone. If the zone is broken, we will be looking for yet another bullish move at price range10814.90-10080.80 area.
DISCLAIMER
Charts are EDUCATIONAL, not INVESTMENT recommendation
Specifically, price is likely to develop a Bearish continuation move this week.

NASDAQ Trade BIASLooking to see what we get for NAS-- but so far from the push we had away from the current zone 12500 I'm looking to see a retracement lower and either it finds support at the past highs near the FVG below the low which is also our 50% fib OR.. I see it breaking that area and retesting below the trend line and going lower towards 11300. Lets see what unfolds.

🧅My trade journal 7/20/2022price moving up as a bigger TF created a short term long setup
Overall NAS100 still in a down trend
still in a rainy season, i stll fxkin hate rain. might become rotten onion as rotten tomatoes
I put all the works on the chart, just read it .
.
.
.
.
.
.
🧅Disclaimer :There are risks associated with investing in securities. Investing in stocks, bonds, exchange traded funds, mutual funds, and money market funds involve risk of loss. Loss of principal is possible. Some high risk investments may use leverage, which will accentuate gains & losses. Foreign investing involves special risks, including a greater volatility and political, economic and currency risks and differences in accounting methods. This is Not Financial Advice
🧅JUST AN OPINION OF THE ONION.🧅

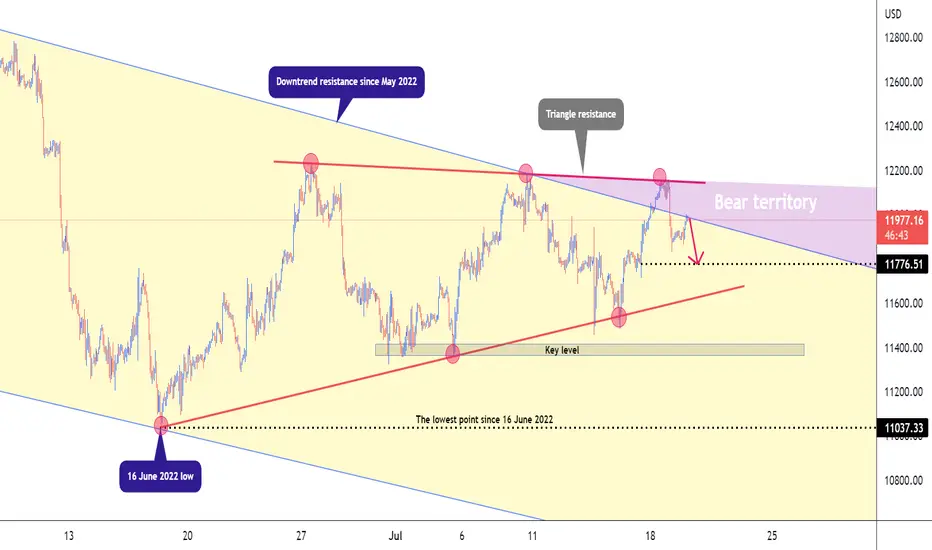
Expect NAS100 to fall to 11776!Yesterday we saw a strong bearish impulse from 12156 as I mentioned in my previous idea and NAS100 erased at least 2.70% of its last week's gains. The market retraced up earlier today during London session and now trading around a downtrend resistance that extends from May 2022. Today I expect the market to fall from this downtrend resistance and target 11776.51.
Have you any suggestion? Do you think Nas100 will rise or fall today? Please comment below.
Also, do not forget to show your support by liking the idea.
Trade smart!
NAS100 bearish outlook and possibility of selling opportunity!What's up everyone!
The week is ending! Hope everyone had a great week.
This will probably be my last trade for the week. I will be waiting for NAS100 to rise to my point of interest. Between 11896.48-11986.66 I will look for selling opportunities and my first target will be around 11633.73.
If price break below 11560.00 then price will reach down to another key level at 11430.00 which will eventually attract more selling pressure and the market retesting the 16 June 2022 low in the coming days will be highly possible.
I will pay attention to U.S economic data to be released later today which some of these are Retail sales and Consumer sentiment data.
If the fundamental and technical outcomes meet my expectation, I will look for trading opportunities, if not I will rather wait until next week for clear market direction.
Yesterday we had some good buy and sell opportunities that we caught. Congratulations to everyone that followed these on Tradingview and in my public channel.
I wish everyone a wonderful weekend.
Trade Smart.
Please support this idea with likes and comments. Thanks

NAS100 Sell Signal!Sell now at current price
Stop loss set at 11946.00
Take profit 11540.52 and 11134.59
Best wishes!

NAS100 is still pressured to the downside!As I stated in my previous idea, NAS100 still looked more bearish seeing that it had been in a strong bearish momentum for quite a while due to the fact that all U.S major stocks are struggling to pick up. As seen on the chart, the market created equal tops (double tops) which may suggest that the index has printed a supply zone. From my original bias, I still anticipate the market to reach 11200. It would be wise to look for short opportunities with targets at 1153 and 11200.
Keep in mind to protect your positions wisely and follow your own trading plan as well as taking responsibility for whatever results from your trading decisions.

NAS100Hello Traders Welcome back to another profit day
If you like my idea please give me a like and comment, That's will be a great appreciation to do more predictions
Here is the full analysis for this pair, Let me know in the comment section below if you have any questions, the entry will be taken only if all rules of the strategies will be satisfied. I suggest you keep this pair on your watchlist and see if the rules of your strategy are satisfied.
NAS100 view with smart money concept
Remember this analysis is not 100% accurate No single analysis is To make a decision follow your own thoughts.
The information given is not a Financial Advice.
Please support this idea with a like, if you find it useful
have a good profit day guys

Nas100 sell setup #high risk trade High risk trade ...risk only 2% of available equity ... The market has previously left significant base on our left hand side price action and broke the significance demand this is a short term sell trade setup

SHORT ON NAS100Prefect rejection and selling pressure from a major resistance zone on the nas100.
I expect price to fall to support.

NAS100I don't think that price is going up to beat the keylevel. it is going to be impulse movement. (1H Price is inverted triangle flag) expecting to break going down.

NAS100 Sell Setup ??We are seeing the NAS100 to go down and break the 11000$ mark.
Let's get started!
(Make sure to hit LIKE!)
Price is expect to reach the resistance market for one more fall with for the market to react on the current resistance.

🐻US100 NeutralNas100 has been very bearish for weeks as a result of the Russia Ukraine crisis and rising USD rates.
From the impulsive bearish movement price has tested a major supporting trendline on the weekly for the third time, sparking a bullish movement.
An inverse head and shoulders was formed and the price broke the neckline, moving higher.
The market has now tested the 61.8% Fib retracement. This will likely result in a bearish movement that will lead to the retest of the Inverse head and shoulders or a complete bearish continuation.
We also see that a trendline Off the daily has been broken, and this could spark a massive bullish movement if price breaks above 12350.00
Happy Trading!

NAS 100 Weekly AnalysisNAS 100 weekly analysis. The market is still on the down trend. This is indicating that we need to look for selling opportunities more than the buy once. if you do take a buy signal make sure that you don't hold long, due to the market being bearish. This is just my opinion not financial advise.

SHORT ON NAS100Price falling from a ascending triangle.
US dollar is strong after J Powell just spoke.

NAS100|The worst is still to come, more selling ahead!I was just going through the chart and market history and decided to share my thoughts on the current market situation.
We can definitely see that the stock market is tumbling to the floor. But the big question is, where shall this end? Everyone is eager to know the answer so we buy the dip.
The chart above is a weekly chart. NAS100 continues to break the lows as we can clearly see from the past weeks. Today (Monday) NAS100 is trading below the May 2022 low. A daily close below this low will mean that NAS100 will continue further down. Ahead of it is the 200 simple moving average. I have also plotted my Fibonacci retracement tool from point A to B and noticed that- near the 200 SMA is the 61.80 fib level. Should we expect the market to bottom around this level? Only time will tell.
I also took time to study the 2008 financial crisis chart and see what I could possible learn from it.
In 2008, NAS100 tumbled with at least 50% from June 2008 high to November 2008 low. For sure many where watching the 200 SMA and perhaps thought the market would bounce up from there, but as we can see on the chart below the market just went through the line and further it collapsed.
Today, history is definitely repeating itself. We can expect the 200 SMA and 61.80 fib level to be penetrated and 78.60% fib level might be an ideal level to watch this market and that is at around 9000.
Maybe you are wondering. What exactly happened in 2008?
By the winter of 2008, the U.S. economy was in a full-blown recession and, as financial institutions' liquidity struggles continued, stock markets around the world were tumbling the most since the September 11 terrorist attacks.
In January 2008, the Fed cut its benchmark rate by three-quarters of a percentage point—its biggest cut in a quarter-century, as it sought to slow the economic slide.
The bad news continued to pour in from all sides. In February, the British government was forced to nationalize Northern Rock.
In March, global investment bank Bear Stearns, a pillar of Wall Street that dated to 1923, collapsed and was acquired by JPMorgan Chase for pennies on the dollar.
Source: Investopedia
The bottom line?
US inflation accelerated to a fresh 40-year high in May to 8.6%, a sign that price pressures are becoming entrenched in the economy. That will likely push the Federal Reserve to extend an aggressive series of interest-rate hikes and adds to political problems for the White House and Democrats.
With all this on the table, we can expect the worst for the stock market.
I believe the stock market will continue to tumble and picking bottoms at this time is not a wise idea.
If you enjoy reading my ideas please do support with likes.

Pricein in an important areaWe can see that in the past, the price broke the black trend line and after that, a head and shoulder reversal pattern was formed, which means that the breakout movement was fake, so we can expect the price to drop further to the green box of the next support.
