NAS100(US100) !! LONG !!Using the Supply and Demand strategy, we can clearly see that the price reached a strong demand area where the price rebounded strongly, in this case i would recommend waiting for confirmation from the 4h candle after wich we think about buying, the levels are shown in the chart.
GOOD LUCK FOR ALL.
Nas100signal

NAS100 top-down analysisHello traders, this is a complete multiple timeframe analysis of this pair. We see could find significant trading opportunities as per analysis upon price action confirmation we may take this trade. Smash the like button if you find value in this analysis and drop a comment if you have any questions or let me know which pair to cover in my next analysis.

Nas100Nas100
Bullish Flag made on H4
Long from 11560-11500
If the flag pattern breaks out
it can go till 12800 -13000
share your views in comments cheers

US100 NasdaqHello Traders,
This is an intraday operational idea on Nasdaq that's forming a bullish flag.
NAS100 possibility of a short term bullish rally!NAS100 looks like it is printing a local demand zone at around 12000. One thing which is also interesting is that the index is printing a classic bullish reversal pattern. I assume the index is setting up for a short term bullish rally. For this setup to be validated and confirmed I will rather wait to see the falling wedge pattern getting violated to the top with clear confirmation of a bullish run (I will then have a clear perspective that bulls can be able to shift price to at least 13000).
On the other hand, if bears can be able to close below 12000 then it is more likely that price will keep on falling.
If you find this idea helpful please be kind to a leave a like.
If you have any suggestion or opinion, make use of the comment section below.
Happy trading!

NASDAQ longs !Longing Nasdaq, gave us 15 min bullish orderflow then came to my 5 minutes POI and gave confirmation on 1 minute.


NAS100| What to watch out for ahead of NFP!Nas100 rebounded from the 12000 psych level and closed higher on Thursday. I will look out for this ahead and during NFP later today: If price close above the minor trendline then bulls will target 12600. However if bears defend the minor trendline and breaks below 12000, then NAS100 will find another support at 11500.
If you find this helpful please be kind to leave a like.
Share your thoughts in the comment section below

NAS 100 daily analysisMy NAS 100 daily analysis. Price is currently at the support level. We may see it U-turning and pushing up or breakout and move down.

NAS100| What you should expect this coming week!Hello everyone,
This coming week I am bearish biased on NAS100 and the other indices. We can clearly notice the market structures that there were series of higher highs and higher lows that were printed until at the point where we saw the first higher low being violated. At that point the market structure changed from bullish to bearish and we are now in a downtrend seeing that the first lower high and lower low had been printed. The market closed below the first lower low on Friday. I am expecting a pull back and then a fall this coming week. I will look for selling opportunity after a pull back. My bearish biased is also influenced by the head and shoulders pattern that had been printed, which is a sign of trend reversal. With that in mind, I will target 12051 as my first target and if the level gets violated then I will look to hold some positions till 11500.
What are your thoughts on this? Please comment below.
Do not forget to show your support of this idea with likes.
Follow me so you stay updated with new ideas likes this.

NAS100 8/27/22no comment
.
NAS100
.
.
.
.
.
🧅Disclaimer :There are risks associated with investing in securities. Investing in stocks, bonds, exchange traded funds, mutual funds, and money market funds involve risk of loss. Loss of principal is possible. Some high risk investments may use leverage, which will accentuate gains & losses. Foreign investing involves special risks, including a greater volatility and political, economic and currency risks and differences in accounting methods. This is Not Financial Advice
🧅JUST AN OPINION OF THE ONION.🧅

Nasdaq100- The do or die momentThe first part of the year was very bad for indices and Nas100 in particular, with the technology index dropping around 30%.
However, in mid-June, a bottom was created and we have had a bullish run for 2 months now.
The index also managed to break above important 13k resistance which is a confluence one, given by the horizontal level and the falling trend line.
At this moment, the picture looks pretty bullish and we can have a continuation to the upside after the recent correction.
In such a case bulls can target 15k for the next leg up.
On the other hand, and this is very important, a failure to maintain 12800-13000 intact would make the recent break a nasty bull trap and the index could fall again to at least the previous low.

Nas100 short trade planNAS100 (Nasdaq)
tested its major resistance area and in the making
of double top will go for channel bottom
neckline of double top also lies there at 13273
if breaks will go for 13062 and 12723
Short level 13500-13570
SL 13730
Tp1 13275
Tp2 13065
Tp3 12725

NAS100 possible buy zone!!NAS100(4H) has just bounced from the monthly support zone with a gap opening. Because the price is already above the monthly support zone, upon retest of the support on the 4H timeframe, upon rejection, a buying opportunity may arise.
Press the like button if you enjoy this content :)

NAS100 sell opportunity| Bears eyeing 12500NAS100 seems like the bearish momentum is very strong.
Bears broke below the 13000 psychological key level. We saw several attempts of price retesting that level and getting rejected. There's higher chance that price will keep on extending lower and bears may be targeting 12500 key level.
We are considering to go short on this with short term target at 12500.
Please support this idea with likes.
Follow for more ideas likes this.
Comment your thoughts in the comment section below.

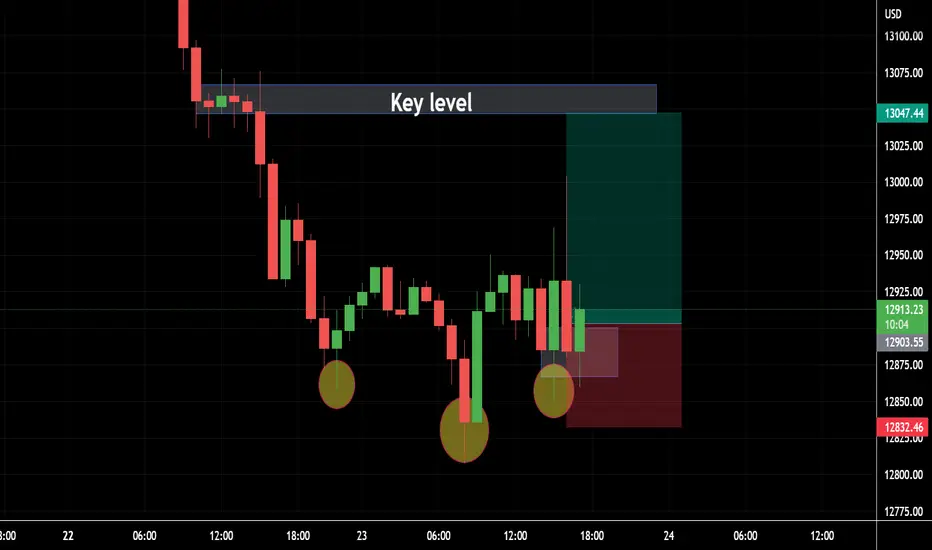
NAS100 head and shoulders| Buy Signal!
NAS100 Printed a head and shoulders pattern on lower timeframe. I expect it to rise for about 140 pips. I took long positions with the team.
Buy now at 12900
Take profit at 13047.44
Stop loss at 12832.46
Follow me for more trading opportunities.
Support my work with likes.
Share your comments in the comment section.
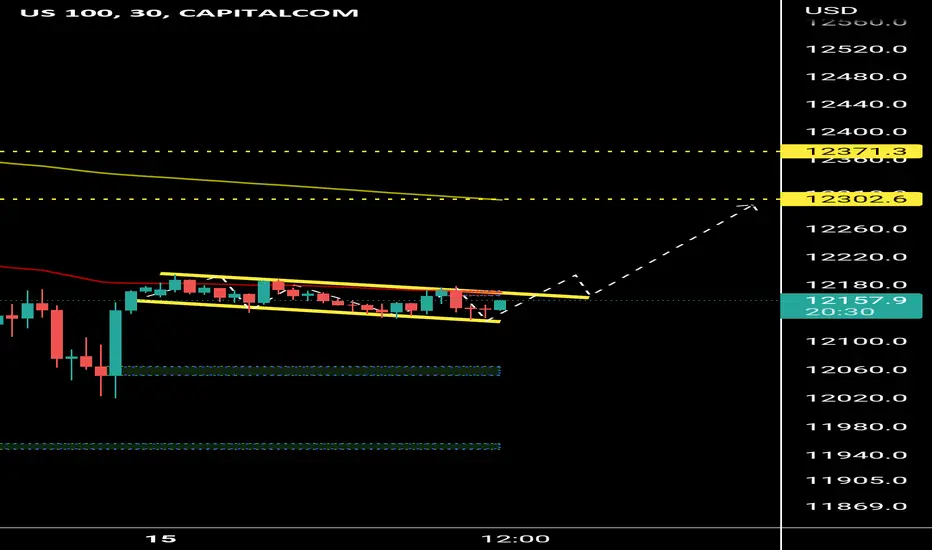
NAS100 Buy AnalysisLooking at NAS100 on 30M timeframe
Currently looking for long/buy position
We currently waiting for signals of reversal whereby we will then execute the trade

NAS100 !!LONG!! SL above the last 4h candle, good luck everyone.
[
symbol="CURRENCYCOM:US100"]CURRENCYCOM:US100

Do not miss this sell opportunity on NAS100!Yesterday I mentioned of a parallel channel on NAS100 and predicted the fall. There was a hesitation for bears to break through 13400 and today we see that price has fallen below it. I have also spotted a number of bearish signs that I think the market is shifting momentum to the downside.
The market clearly made series of Hhs and we can agree that bulls were in control. Up to the high of 13720 buyers seemed to lack sufficient strength to push price further. We began to see momentum to the downside. At this point we can clearly see that bulls
are being kicked out cause they failed to push price to create a new Hh.
From a technical stand point we can see a pattern that can be categorized as a head and shoulders pattern so it is a bearish reversal sign. Bulls may be exhausted and bears may be stepping in to change the overall direction of the market.
I am interest to see price fall to 13000-13080.
Follow me for new updates
Support my work with likes. I will highly appreciate it.
Comment your thoughts in the comment section below.
Happy trading:)

Nas100 short to the rising trendline!I expect NAS100 to fall to the rising trendline support. The market broke below 13560 a minor key zone. I now expect the market to keep falling. We have taken short positions with target at 13450.
Please support this idea with likes. If you have any suggestion or opinion share in the comment section below.

NAS100 bears still marching to 13300. Short to 13317!The index fulfills my previous analysis and fell to 13450 as I predicted yesterday. The index is now trading below 13450, a level where I spotted a trendline crossing through it. This means bears are not giving up just yet, I expect the index to be red today until 13300. We are considering to take short positions with target at 13317.05.
If you like this idea please do show your support with likes. I appreciate your gesture of appreciation!
Follow me for trading ideas and updates like this.
Let's interact with comments in the comment section below. Don't be shy now. Talk to me:)
But don't forget to trade smart:)

US100 NASDAQ Technical Analysis and Trade IdeaTaking a look at the US100. Currently respecting a monthly weekly and daily resistance level. We can see the range and price sweeping below and above the range. The question is where to next? In the video we discuss key levels of support and resistance, price gaps and a possible trade opportunity. As always everything explain in the video, not financial advice.

HOW TO MAKE $1M+ IN A WEEK. NAS100 STRATEGY 🤩💡✅GENERAL OVERVIEW DATA
From March 02 2020 point A until December 2021 point B uptrend. From January 01 2 June 2022 retracement of Fibonacci level point C.
MONTHLY TIME FRAME
* Uptrend
* Retraces back to 0.5- 0.6 Fib level
* Bullish engulfing pattern spotted at the retracement level
*Violate the 3rd touch of this trendline.
* Closes with a bullish hammer candlestick at $135 62.70
* Price above the 200 EMA. Shows the confirmation of the uptrend and a backup of a trained in continuation.
* Next target level $15,000 before heading to $16500 after which a possible break of structure to the upside to form a new high.
CAUTION: when price gets between $14000 to $15000. Might be tricky at that point before it eventually breaks it to $16500
WEEKLY TIME FRAME
* Little to nothing will be done here because the lower time for your respect and follow the higher time frames
* So you will just be buying and selling the market reaction in respect to the monthly time frame and overall analysis.
* Clearly you can see that price is heading to the support at $15,000.
ATTENTION! You might be tempted to ask or say the prices trading in a form of H, L, LH, LL pattern weekly zone. The four at the current level LH point K there's a possible LL again.
CAUTION: AGAIN IT'S ONLY REACTING TO THE HIGHER TIME FRAME AND RESPECTING THE MONTHLY 0.5 - 0.6 FIB LEVEL AT POINT K CURRENT PRICE. IT HAS VIOLATED THE TREND LINE AND CLOSES ABOVE IT WITH A STRONG BULLISH PATTERN. SO LITTLE TO NO ROOM FOR THAT L, LL, H, HL PATTERN. THEREFORE ALL ROADS LEADS TO $15000 FIRST FOR SOME PASSENGERS TO ALIGHT FROM THE TRAIN BEFORE HEADING FURTHER TO THE NEXT BUS STOP.
DAILY MOVING VEHICLE.
* The road is clear as the picture. All heading to the bag at $15000.
* Every reaction of the weekly time frame is respected and in correlation to the daily moving vehicle.
LOWER TIME FRAMES. H4, H2, H1.
H4.
* Forming and giving a sweet moving ride and a peaceful pattern of L, H, HH, LH, HH ... On the 21 EMA.
CAUTION!
Partial potential double top in play. So don't jump just yet wait for a pullback. It's coming to your bus stop.
So wrong to your 1m, 5m or 15m to see if it's at that bus stop before you jump in.
CONCLUSION
GO LONG
BUY.
