NAS100 (NASDAQ / US100) Technical Analysis and Trade Idea The NAS100 has broken market structure (bearish) on the 1W and 1D timeframes. Currently we are seeing a bullish rally on the 1D and 4H US100 into a key resistance level. In the video, we meticulously assess the prevailing NASDAQ trend, market structure, and price behavior, deliberating a prospective buying opportunity.
It's important to note that the information shared is intended purely for educational purposes and does not constitute financial advice. Trading entails inherent risks, underscoring the criticality of implementing robust risk management protocols consistently.
Nas100signal

NAS 100 I Potential pullback and long from supportWelcome back! Let me know your thoughts in the comments!
** NAS100 Analysis - Listen to video!
We recommend that you keep this pair on your watchlist and enter when the entry criteria of your strategy is met.
Please support this idea with a LIKE and COMMENT if you find it useful and Click "Follow" on our profile if you'd like these trade ideas delivered straight to your email in the future.
Thanks for your continued support!

NDX / NAS100 long idea 17780 point is the point to be protected and the stop point. I still think bullish, target point 18400. long position can be taken with bullish confirmations or long can be taken from the region above 17300.

NAS100 Long 05.04.2024
In my recent NAS100 analysis, my bias remains bullish. Despite a slight upward movement followed by a significant drop, I'm still adhering to the overall bullish trend. We're currently at a low point where we're likely to witness bullish price action. NAS100 still has liquidity above, so I'm not anticipating bearish pressure, but time will tell.
Aggressive entry module specific daily vwap

NAS100 Long Set UpThursday, 04.04.2024
We took the previous weekly low and touched my 8 EMA.
On the daily timeframe, we have two strong daily wick rejections at my daily VWAP low, and we also observed important daily liquidity lows. Now, a small pullback is expected, followed by a long.
Aggressive entry module

NAS100 Technical Analysis and Trade IdeaIn the video, we explore a potential trading opportunity in the NAS100 index. Our analysis involves assessing the current trend, studying price fluctuations, evaluating market structure, and identifying a potential entry point under favourable conditions (if they occur), as explained in the video. Remember to integrate robust risk management principles into your trading strategy. As always, please note that this information is purely for educational purposes and should not be interpreted as financial advice.

NAS 100 I Potential long from support Welcome back! Let me know your thoughts in the comments!
** NAS100 Analysis - Listen to video!
We recommend that you keep this pair on your watchlist and enter when the entry criteria of your strategy is met.
Please support this idea with a LIKE and COMMENT if you find it useful and Click "Follow" on our profile if you'd like these trade ideas delivered straight to your email in the future.
Thanks for your continued support!

NAS100 Technical Analysis and Trade Idea #US100 #NASDAQNAS100 has traded bullish and is currently over extended. In the video we look at the trend, market structure, price action and we discuss two potential trade opportunities on both the 1D and 4H time frames. Not financial advice, manage risk well.

NAs100 longThis is my favorite set up going into tomorrow, look for a 4h close and rejection from the current level to take a but back to the top of structure

NAS100 Trade IdeaThe US100 index has retraced, entering a bullish 1D order block. Analysis of the prevailing trend on this timeframe indicates a clear bullish trajectory. I am eyeing a potential buy entry opportunity within at 61.8% Fibonacci retracement levels. Employing a risk management strategy, stops will be placed below the preceding low, while targeting the previous high and potentially beyond with the implementation of a trailing stop. However, it's imperative to note that trading carries inherent risks, and past performance is not indicative of future results. Therefore, traders should conduct thorough research and exercise caution before making any financial decisions.

Is Nasdaq finally done?Two weeks ago, I mentioned the possibility of a significant correction for PEPPERSTONE:NAS100 , suggesting that the index could drop to as low as the 16k zone. As always, navigating uncharted territories, particularly at all-time highs (ATHs), presents challenges in determining price levels and timing trades. However, I now have a reference point, which is yesterday's high.
From a technical perspective, as I've mentioned previously, we're observing a rising wedge pattern, typically indicative of a reversal, coupled with indicators showing divergence.
In conclusion, in my opinion, we have reached a peak for now, and PEPPERSTONE:NAS100 is likely to enter a correction phase.

Nas100- Bulls should be very careful (2k P drop could be next)Since the low at 14k at the end of October, PEPPERSTONE:NAS100 has risen strongly, reaching a high at 18k.
More importantly, this translates into a 30% increase, which is substantial within such a short time frame.
Upon closer examination of this upward movement, we observe that it is contained within a rising wedge, which typically signals a reversal. Additionally, Friday's candle formed a bearish engulfing pattern, and yesterday we witnessed a break of the rising trend line. If we consider the divergences on MACD and RSI, the overall picture is far from bullish.
In the short term, we notice the index resting on horizontal support, and a break here would provide the necessary confirmation of a temporary peak at 18k.
In this scenario, a decline to 17k is highly probable, but in my opinion, this decline will extend to 15800k support.
And, let's be honest, after a 30% increase, a 10% decline is not a tragedy; in fact, it is a normal market "adjustment."

NAS100 Technical Analysis and Trade Idea
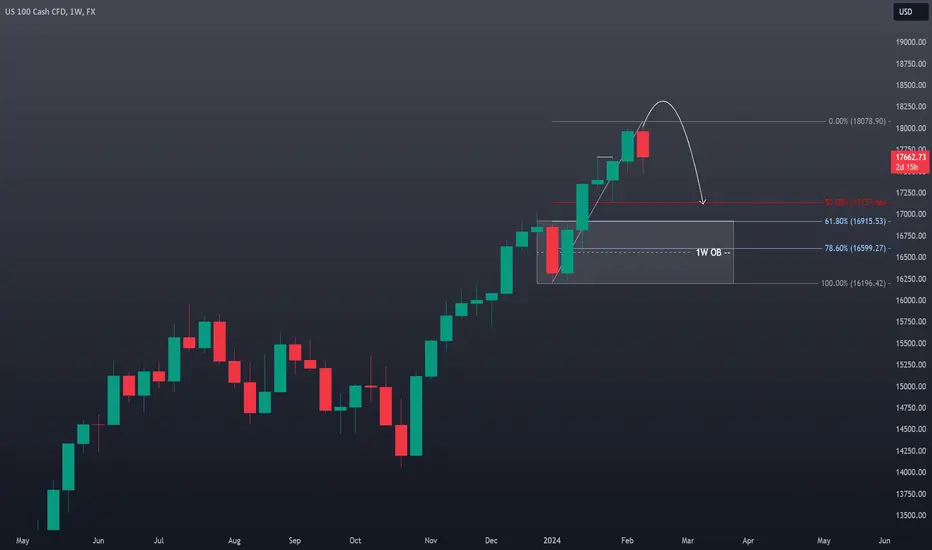
Market Observations: The #NAS100 has maintained a bullish trajectory. However, price action on the monthly timeframe suggest the #US100 is overextended. Additionally, the weekly chart reveals a double top pattern, hinting at a potential retracement down to the 50-61.8% Fibonacci levels. This area could provide the liquidity needed for major market players to fill long orders.
Trade Strategy: Consider an intraday/swing trade short entry following a potential stop run above the current range. Target an initial profit level around the previous lows near 17250, with a secondary target at 17000 (slightly above the 61.8% Fibonacci level on a 1W chart). Implement a well-placed stop-loss order to manage risk effectively.
Disclaimer: This analysis is based on my observations and does not constitute financial advice. Conduct your own independent research and carefully assess your risk tolerance before making investment decisions.
NAS100 - EMBARKING ON THE BIGGEST BULLRUN IN HISTORY? Hello Traders, what a week it has been! So I think it is justified to provide you with everything I know and show you how I see things. On the chart you’ll notice an image. The image shows theoretical price action with a parabolic curve step-like formation, representing an idealised pattern in price action trading. The formation begins with Base 1, where the stock starts to show an uptrend, followed by Base 2, indicating continued growth and increased investor interest. Base 3, marked by an "X", signals a critical entry point for traders, as it suggests potential for the stock to double in value rapidly. We are depicted to be at this third phase, which is considered the most opportune moment for entry before the final ascent. Base 4 represents the peak of the trend, culminating in a Sell Point where the stock reaches its maximum and sharply declines, thus completing the pattern.
However, as we gear up for the CPI data release on the 13th of February, be aware that it might steer us into a broad consolidation phase. The market's parabolic trend may not be sustainable given the upcoming figures. Prudence is key here—anticipate potential stabilisation or sideways price action as the market digests the CPI results.
Additionally, watch out for how price reacts to the BOS level. No structure is definite and it's important to adapt to what price is showing us and not to cling to an idea that no longer is valid.
NAS100 Weekly
NAS100 Daily
To add to this NAS100 analysis, I think it’s important to discuss its main components. The "Magnificent Seven" Big Tech stocks, including Nvidia, Apple, and Amazon, have seen varied performance since the pandemic, challenging the notion of them as a homogenous group. The dispersion in their returns and diverse business models highlight the differences within the sector. While Nvidia thrives as an AI specialist and Apple boasts defensive qualities, Amazon combines retail with cloud computing. The sector's valuation spectrum reflects a mix of growth prospects and market expectations, suggesting a nuanced investment landscape rather than a uniform "bubble." This diversity raises questions about the future performance of growth versus value stocks within these leading tech companies.
Apple's revenue grew during the holiday quarter, driven by iPhone sales and a record in services, despite a drop in China sales due to competition and geopolitical issues. The company faces regulatory scrutiny and a patent dispute, but remains optimistic about its product ecosystem and upcoming launches like the Vision Pro headset.
Amazon's stock surged 7.9% following a report of strong holiday sales, boosting its market value by approximately $135bn. CEO Andy Jassy highlighted the company's future focus on AI, projecting AI revenues to reach "tens of billions," further driving optimism for its growth potential.
Alphabet's shares dropped after advertising revenues missed expectations, despite integrating its Gemini AI into various services. The company plans significant investments in AI infrastructure, raising investor concerns about the balance between growth and expenditure in the generative AI race.
Meta's shares soared over 20% after announcing a first-ever dividend and a $50bn increase in share buybacks, signalling recovery from a recent advertising slump. The company plans more investment in AI and the metaverse, despite expecting short-term AI products not to significantly drive 2024 revenue. Full-year expenses are projected to rise notably.
Nvidia's dominance in the AI chip market, essential for technologies like OpenAi's ChatGPT, has driven its significant growth, with the stock more than doubling in value over the past year. This surge contrasts with the broader semiconductor industry's struggles with excess inventory and reduced demand in other sectors. Nvidia's success is partly due to partnerships with major tech firms like Microsoft and Meta, with the latter planning to acquire almost 600,000 high-end Nvidia GPUs for AI research. This focused investment in AI has positioned Nvidia at the forefront of the data centre market, overshadowing traditional leaders like Intel.
Microsoft's shares fluctuate after announcing strong cloud sales integrated with OpenAI's tech, but ended lower due to concerns over high investments in AI infrastructure. Despite a 20% increase in cloud revenues, investors remain cautious about the costs associated with expanding AI capabilities.
Tesla's shares dropped 12% amid warnings of lower sales growth due to reduced demand and increased competition. CEO Elon Musk announced a new lower-cost car for 2025, aiming to regain momentum. Tesla faces challenges from price cuts, higher costs, and a shift in the EV market, impacting its financial performance.
Here’s some economic theory for you, to add some more depth to the analysis. The Federal Reserve's monetary policy, particularly changes in the federal funds rate, has a significant impact on bond yields and, subsequently, stock prices. When the Fed raises interest rates to combat inflation or cool down an overheating economy, bond yields tend to rise as well. Higher bond yields make bonds more attractive relative to stocks, which can lead to a decline in stock prices as investors may shift away from equities. Conversely, when the Fed lowers interest rates to stimulate economic growth, bond yields often decrease, making stocks more appealing, which can boost stock prices. So, Fed rate decisions play a crucial role in influencing the relationship between bond yields and stock prices. In economic theory, bond yields and stock prices exhibit a negative correlation. This is why yield charts matter. Have a look:
The general outlook is that the US Federal Reserve is cautious about cutting rates despite inflation slowing, due to concerns about potential economic growth and inflation resurgence. Market expectations of rate cuts exceed the Fed's projections, but with inflation drivers easing, the case for reducing rates is growing stronger. However, the US job market added 353,000 jobs in January, surpassing the expected 180,000, leading to reduced expectations for a Federal Reserve interest rate cut in March. The strong job growth supports the Fed's cautious stance on rate cuts, despite political pressures. In my opinion, if the US economy continues to show such resilience and the next CPI release is lower than consensus, we might be witnessing the beginning of the largest bull run in history.
In summary, the NAS100's trajectory is at a crossroads with the upcoming CPI data potentially triggering market consolidation, despite the recent parabolic pattern. The diverse performance among Big Tech stocks underscores the need for nuanced analysis. While Federal Reserve policies continue to sway bond yields and stock prices, the strong job market suggests caution in anticipating rate cuts. Keep a close eye on how the NAS100 responds to the interplay of inflation data and tech sector dynamics. Overall, maintain a strategic approach and be ready to adjust to new information as we navigate these complex market conditions. Stay informed, stay agile.
As always, I hope you enjoyed this one and have a great weekend!! ;)

NAS100 - WHAT THE F*** IS GOING ON? (KEY LEVELS)Hey Traders, yesterday’s market shake-up wasn’t just about the Fed's chess moves. A trifecta of less-than-stellar employment data, lukewarm tech earnings, and regional bank jitters sent the NAS100 on a rollercoaster, underscoring the fragile nature of our current economic landscape.
The Fed's stance was the talk of the town, maintaining a rate plateau between 5.25% and 5.5%. But here's the kicker: the Fed's not just playing hard to get with rate cuts—they want to be absolutely sure inflation is well-tamed before making a move. The puzzle? Inflation's at a tame 1.9%, yet they're still holding out for a clearer sign.
Powell's cool-headed presser post-meeting hinted at a 'wait and see' approach, calming fears of economic overheating or cooling. The good news? Inflation's behaving, and growth is chugging along. But the markets are twitchy, and the odds of a March rate cut have edged down from 'likely' to 'let's talk later.'
Now, let's bring in New York Community Bancorp’s plunge into the mix. Was it a one-off, or a canary in the coal mine for the banking sector? Concerns over credit quality and margins are in the air, with all eyes on whether this spells broader banking woes or just a case of merger indigestion.
As we gear up for our NAS100 price action analysis, these economic plot twists are crucial. They're the backdrop to every candlestick and trend line we're about to dissect. Stay tuned as we unravel the price story against this economic saga.
Based on the provided chart of the US 100 index and considering the backdrop of the latest economic news, here is an analysis that blends market sentiment with price action analysis:
What is on the chart? (key levels to look out for)
1) We have our retracement levels + the 4 hour FVG and BOS level. This area is a key resistance zone.
2) The order block that might provide us with a temporary (or permanent) bottom. You can consider it as a support level and it will determine the next step in our price action story.
3) Key daily level that is a great support area. You have the FVG + BOS level (previous ATH so significant) + discounted area.
4) This is a significant sellside level that I doubt will be broken with the current outlook which is more uncertain than bearish but still important to outline.
CONCLUSIVE SENTIMENT: Given the current economic context where the Fed is cautiously optimistic yet not ready to lower rates, the failure to break the ATH in the index could reflect a market that is wary of overextension and preparing for a period of consolidation or retracement. Investors may be taking a more defensive posture, awaiting further economic indicators before committing to a direction.
In essence, the sentiment appears to be one of caution, as reflected in the index's price behaviour and recent economic developments. Traders are advised to watch the key technical levels and stay informed on economic updates, as these could significantly impact market direction in the near term.
As always, stay cold headed and keep your money close! HAPPY TRADING!!!!

Nas100 HTF Analysis I expect Nas to reach 17k in the next few weeks. Nas has been pushing up relentlessly last few weeks so expecting ATLEAST a nice pullback. Once we hit 17k tho we could see all time highs again!


NAS100 - MY DAILY AND INTRADAY ANALYSES (TARGET 17300)Yes this is contrarian, markets are booming but it's quite overextended and going long at a top is the most monkey trader thing to do. I'll do a reverse analysis where I start with the intraday and follow up with the daily. So here's my take on things:
What's on the intraday chart? (Follow the steps)
1) A 4 hour bearish FVG. This will serve as my entry zone.
2) Our 'support line'. You'll notice price keeps on making lower lows.
3) Our liquidity target. This is the price magnet. We know for certain (discretionary) that price will take this out.
4) The entry point. Again, do your own research. Do not follow the analysis from some random stranger on the internet and go all in (you degenerate).
5) The intraday target. The order of things matter. If we hit this before hitting the short entry then you might wanna reverse the idea but I do not like the idea of longing in an overextended market!
What's on the daily chart? (Follow the steps)
1) The previous all time high that was violently broken.
2) Our swing extension target area. This is great to know where to take partials or close entire positions in new price territories. Of course price can always go further towards 2 or 2.618 or anything else (it's up to you where you wanna take partials).
3) The bearish candle pattern: kind-of a mix between a gravestone, a spinning top, a shooting star and whatever other label I can muster to justify my bias lol. To me this is the main driver of the bearish bias!
4) Maximum target. I do not see price going any lower and the intraday target is more sane so I don't really expect price to go that low either.
5) The continuation of the rally. People love buying. I do not see that changing anytime soon.
As always, have a lovely day and happy trading! ;)

NAS100 & SPX500 - WHAT IS HAPPENING TODAY? (CONFLICTED)We are at a pivoting point in the markets, everything seems to be bullish and yet I have this bearish itch. Markets seem to be overpriced, notably the NQ. However the S&P500, has had a healthier correction and the continuation of its rally makes more sense.
Since both markets are highly correlated, it would be absurd to short the NQ while the S&P500 looks so bullish. Why do I want to short the NQ? Technically it hasn't retraced as sanely as the S&P500 but that may be the nature of both markets. The NQ being more irrational (more speculative) than the rest, especially with the AI craze.
So here's my two cents worth on the matter!
What is on the charts? (follow the steps)
1) Highs that wicked many times in the daily bearish FVG.
2) Significant high that as I'm writing this has been taken out.
3) The retail sales session that took out lows and this is also what has me question the rally. If it is supposed to be bearish info why isn't price dropping? These are the reasons why I do not trade on certain days because I do not see clearly all the time.
4) Asian session lows, a great target for shorts.
5) A retest (or break of the daily FVG). I am not a breakout trader which is why I am not focusing on the bullish outcome because I couldn't tell you how to trade it optimally.
6) The bearish structure (that may never present itself). This all depends on the S&P500, for me to accept a short I need that double confirmation. So right now I accept everything as bullish unless shown otherwise.
7) Asian session lows taken out.
8) Finally the healthier correction that I'd want for the NQ to accept a more bullish approach.
As always, happy trading everyone and have a lovely day! ;)

Will Nadsaq start a deep correction?The year 2023 proved to be exceptional for PEPPERSTONE:NAS100 , witnessing a 70% increase in the index. However, the onset of 2024 brought about a correction in the index.
Notably, the rise observed in December is confined within a rising wedge, suggesting a potential reversal. The index has indeed breached the rising trend line of the wedge, and the recent rebound serves as confirmation of this break.
Also NAS100 appears to face challenges surpassing the 17k mark.
Confirmation for a new downward move would occur with a break below 16500.
In such a scenario, levels to monitor for bearish targets include 16200, 15700, and a significant 14500.

Nas100 Longs Very bullish but I would only look for longs after a pull back and rejection with a 4h close at the bottom of structure

Nas100 Short SetupExpecting H4 to change to bearish after taking the previous day’s low so anticipating the H4 making a LH here and dropping. Possibly seeing a move down during Asian session, although this is rare. Risking .5% of my account and targeting 3R.

NASDAQ 100 TECHNICAL UPDATENasdaq 100 technical analysis, as am going long on the indices, looking for the market to go back again on the all time highs.
