NASDAQ US100 Overextended? Waiting for the Pullback🚨 NASDAQ #100# Analysis 🚨
I'm currently watching the NASDAQ (US100) 📊, and in my view, it's looking overextended. Price is now trading into previous daily highs 📈 without showing a meaningful retracement. Historically, when we look back at the chart, we rarely see such strong rallies without some form of pullback 🔄.
A healthy trend typically follows a natural rhythm — rally, retrace, rally or expand, pull back, expand again. In this case, that retracement is missing ❌, which raises caution flags for me 🚩.
🎥 In the video, I break down:
Price action & market structure 🧩
The current trend 📉📈
A potential long opportunity — but only if price pulls back into my point of interest (POI) 🧲 and we then get a bullish break in market structure (BoS) 🟢.
🔒 This is not financial advice. Always do your own research and trade responsibly!
Nas100signals

Will NASDAQ Continue Its Climb? Here's my Trade Plan.📈 NASDAQ 100 (NAS100) Technical & Price Action Outlook 💡🚀
The NASDAQ has been in a strong bullish trend, driven by optimism around interest rates, tech earnings, and positive momentum. 📰💻 While price has pushed up aggressively, it’s now trading near key highs and buy-side liquidity zones—a spot where I’m anticipating a possible pullback. 🔁💰
I’m watching closely for a retracement into the 50% Fibonacci zone—my point of interest for a potential long setup. 🎯📐 However, I’ll only consider entering if price breaks structure bullish (BoS) after the pullback. 📊🧠
The index is still recovering from earlier 2025 losses, and resistance lies just ahead—so risk management is key. 🧘♂️⚠️
Not financial advice.

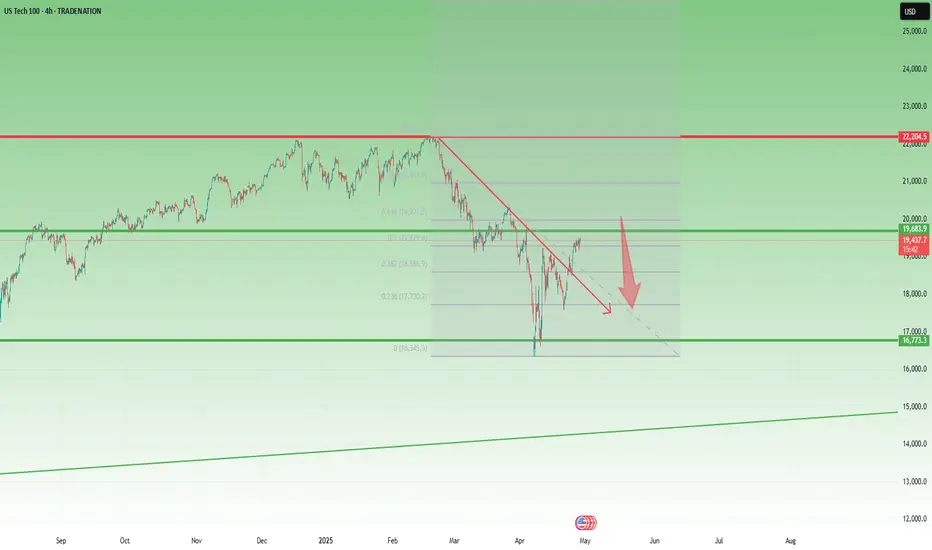
NASDAQ Recovery Looks Fragile Below 20,500After the steep drop to 16,300, NAS100 started to recover, forming a higher low and managing to break back above the falling trendline drawn from the all-time high (ATH).
While these are positive developments, in my opinion, the trend is likely to reverse to the downside soon.
Technically, the index is now entering a heavy resistance zone, marked by:
• The golden sell zone between the 50% and 61.8% Fibonacci retracement,
• Psychological resistance at 20,000,
• Major horizontal resistance around 20,500.
As long as the price remains below 20,500, I favor short trades, targeting a potential drop to at least 18,000
Disclosure: I am part of Trade Nation's Influencer program and receive a monthly fee for using their TradingView charts in my analyses and educational articles.
NAS100 Turn of the Month Strategy Meets Market Volatility!In this video, we dive into the Turn of the Month Strategy and explore how it could play out in the current market environment. Historically, mutual funds rebalance their portfolios at the end of the month, creating buying pressure that often leads to higher stock prices into the new month. Additionally, recurring financial inflows, such as monthly salary payments and pension contributions, tend to boost market demand during this period.
However, this month presents a unique challenge. The NASDAQ 100 has capitulated into the end of the month, driven by heightened volatility and uncertainty fueled by Donald Trump's rhetoric. With the market currently trading into a significant support zone and liquidity pool, we analyze whether the Turn of the Month effect can counteract the recent bearish momentum.
📊 Key Highlights in the Video:
Price Action Analysis: The NASDAQ 100 is deeply overextended, trading into a critical liquidity pool.
Trade Idea: A potential counter-trend rally could emerge as the market seeks to correct and rebalance.
Strategy: Look for a short-term rally into resistance, followed by a possible shorting opportunity as the market resumes its downward trend.
This video is perfect for traders looking to combine price action trading with seasonal strategies like the Turn of the Month effect. Will the market rally into the new month, or will bearish momentum prevail? Watch now to find out! 🚀

NASDAQ Trade Plan: From 4-Hour Trend to 15-Minute Execution!NAS100 Strategy: Using Fibonacci and Market Structure for Precision!
📊 In this NASDAQ (NAS100) trade idea, I focus on a top-down approach starting with the 4-hour chart. If the 4-hour trend is bullish, I look for higher highs and higher lows. If bearish, I focus on lower highs and lower lows. 🔄 My key strategy is identifying pullbacks into equilibrium—around the 50% Fibonacci retracement level—within any price swing. This is my point of interest.
Once price moves into this area, I shift to the 15-minute chart to refine my entry. 🔍 Here, I wait for a break of structure during the pullback, aligning with the overall trend direction. This approach allows for precise execution while staying in sync with the larger trend. 🚀
⚠️ This is not financial advice. Always trade responsibly and manage your risk.

Nasdaq100 Update: Another Leg Down Likely After Recent Reversal?For quite some time, I have been highlighting the possibility of a strong correction in the Nasdaq 100 ( TRADENATION:USTEC ), with the 17,500 level remaining a realistic downside target.
In my more recent analyses, I argued that while a reversal from the 19,100 support zone was likely, it was merely a dead cat bounce , and the index could decline further from the 20,300-20,500 resistance zone. The lower boundary of this range was tested, and as expected, the index has started to fall again.
Although a temporary rally above 20,000 cannot be ruled out, my overall outlook remains unchanged—I still anticipate another leg down.
In conclusion, selling into rallies continues to be my preferred strategy, with 17,500 as the medium-term target.
Disclosure: I am part of Trade Nation's Influencer program and receive a monthly fee for using their TradingView charts in my analyses and educational articles.

Will NASDAQ Rally Continue? Technical Analysis & Trade Idea.NASDAQ NAS100 (4H Chart) Analysis 📊📈
The NASDAQ NAS100 is showing strong bullish momentum on the 4-hour chart. The chart suggests a continuation of the uptrend, with a potential move toward the 21,013.0 target. 🚀
Key Levels to Watch 👀
Support Levels:
19,750.9: Near the 61.8% Fibonacci retracement, this level has seen strong buying interest.
19,405.8: The 100% Fibonacci retracement, marking the swing low and a critical support zone.
Resistance Levels:
20,209.4: The 0% Fibonacci retracement, acting as immediate resistance.
20,611.2: The 50% Fibonacci extension, a key target for bullish continuation.
21,013.0: The 100% Fibonacci extension, representing the ultimate bullish target in this trend.
Volume Profile Insights 📉
The Volume Profile shows heavy trading activity between 19,800–20,000, confirming strong support in this range. Above 20,200, trading volume thins out, suggesting that a breakout could lead to a quick rally toward 21,000.
Momentum and Indicators ⚡
Trend: The index is in a clear uptrend, forming higher highs and higher lows since the recent swing low.
Fibonacci Confluence: The alignment of the 50% retracement and Volume Profile support strengthens the bullish outlook.
Curved Arrow Projection: A pullback to the 19,800–19,750 zone is likely before the next leg higher toward 21,013.0.
Social Media Sentiment 🌐
Twitter: Analysts are optimistic, citing strong tech sector performance and easing interest rate fears. Many traders are eyeing the 21,000 level as the next milestone.
Reddit: Discussions emphasize the importance of the 19,800 support zone, warning that a break below this level could invalidate the bullish setup.
Conclusion 📝
The NASDAQ NAS100 is set for a bullish continuation, with key support at 19,750–19,800 and resistance at 20,209.4 and 21,013.0. Watch for a potential pullback to the 50% Fibonacci retracement before the next upward move. A break below 19,750 could signal a shift in momentum, while a breakout above 20,209.4 would confirm the bullish trend. 🚀
Disclaimer: This analysis is for informational purposes only and not financial advice. Always do your own research and consult a professional before trading. 📢

NAS 100 Overextended – Brace for a Pullback! The NAS 100 is looking highly overextended at the moment 📊. Market conditions are precarious, with many instruments trading into key support and resistance levels on both the daily and weekly timeframes ⏳.
A sharp pullback 📉 could be on the horizon, potentially offering a counter-trend buying opportunity on the lower timeframes for the US 100 💰. If it pushes higher, it may set up a potential short trade 🎯.
🚨 Not financial advice – trade wisely and manage your risk! ⚖️

NASDAQ 100 Hits Key Resistance: Is a Retracement Imminent?In this video, I analyze the NASDAQ 100 (#NAS100) as it trades into a key resistance level, appearing overextended on the 4-hour timeframe. I discuss the potential for a counter-trend trade, targeting a retracement to the 50% Fibonacci level of the previous price swing. Watch for insights and strategies on navigating this setup! Not financial advice.

NAS 100 Counter-Trend Opportunity: Possible Bounce from Support 📊 The NAS 100 looks overextended right now. It’s tapped into a key liquidity pool support zone, and I’m eyeing a potential counter-trend trade back up to equilibrium. ⚖️ After that, we could see another sell opportunity if the price action aligns. 🚨 *This is not financial advice.*

NAS 100: Bullish Trend with Year-End Pullback - Where To Next?In this video, I analyze the NAS 100 on higher timeframes, starting with a quick top-down review to explore a potential trade setup. The three-week and weekly charts indicate a bullish trend; however, as we approach the end of the year, there’s some pullback and uncertain price action. I share my insights on the current market conditions and discuss a possible trade idea. Please note, this is not financial advice.

NAS100 Overextended? Anticipating a Retracement to Re-BalanceThe NAS 100 has seen a sharp move to the downside and, in my view, is overextended. It has reached previous lows on the daily timeframe, sweeping southside liquidity. Considering the extreme nature of this move and the presence of significant gaps or imbalances above, I anticipate a retracement as the market seeks to rebalance. Additionally, there is buy-side liquidity resting above that could serve as a target. I’m watching for a potential buying opportunity if the conditions outlined in the video materialize. This is not financial advice.

US100 NASDAQ Technical Analysis - Where To Next?👀👉 The US100 has recently experienced a pullback, leaving traders wondering: what’s next? While the higher time frame trend remains bullish, last week’s deep retracement has carried into today. At this point, it’s a matter of waiting for the market to settle and observing how price action unfolds, particularly after the New York session. I’m leaning toward looking for a buy opportunity, but this depends on a bullish structural break—specifically, a break above the current previous high on the 4-hour timeframe. Selling isn’t part of my plan right now, as the chart and volume profile reveal strong support levels below, which are clearly highlighted in the analysis. 📊 Disclaimer: This is for educational purposes only and should not be considered financial advice. Always do your own research and trade responsibly.

Nasdaq 100 Consolidates Near Record High: Is a 22,000 Target NexThe U.S. presidential election has sparked optimism also in the stock market, with the technology index rising by 1,000 points.
Following this new all-time high, the Nasdaq 100 ( PEPPERSTONE:NAS100 ) is now consolidating just below that level.
This consolidation is taking the shape of a flag pattern, which could signal potential for further upward movement.
A breakout to the upside would confirm this pattern and could set the stage for additional gains, with a target of 22,000 points.

Is The NAS100 Set For Possible Bullish Move? Key Price Action Si👀👉 The NAS100 is showing bullish momentum across the monthly, weekly, and daily charts; however, a notable pullback is occurring at a critical support level. I’m monitoring this area for a potential buying opportunity that aligns with the key criteria discussed in the video. In this analysis, we’ll identify important price action signals to watch and outline strategic positioning for the next potential move. Disclaimer: This analysis is for informational purposes only and does not constitute financial advice. 📊✅

NAS100 Technical Analysis and Trade Idea (NASDAQ)👀 👉 Here's my take on the current NAS100 (NASDAQ) situation:
NASDAQ-100 Technical Outlook
The NASDAQ-100 index is showing signs of weakness on the 4-hour chart, with a notable shift in market structure. We're seeing a pattern of lower highs and lower lows, which typically signals bearish momentum. This could potentially drive prices down to test previous support levels.
Key Levels and Entry Strategy
I'm currently eyeing a short entry, but I'm not jumping in just yet. My strategy is to wait for a clear break of the current structure, followed by a retest of the range lows. This approach allows for a more favourable risk-reward ratio and increases the probability of a successful trade.
Broader Market Context
Seasonal Patterns
Historical data reveals an interesting seasonal trend: bears have often dominated the market from mid-September onwards over the past 5-6 years. This aligns with our current technical outlook and adds weight to the bearish thesis.
Technical Indicators
The MACD is showing a bearish signal on the daily chart, further supporting our downside bias . Additionally, the RSI at 55.95 suggests there's still room for downward movement before we hit oversold territory.
Trade Idea
Given the technical setup and seasonal tendencies, I'm looking to short the NAS100 on a break and retest of the current range lows. Key resistance levels to watch are around 17,511 (50-day moving average) and 17,480 (20-day moving average).
Remember, while this analysis provides a solid foundation, always conduct your own due diligence and adhere to strict risk management principles. The tech sector can be volatile, so position sizing is crucial. 📉✅

NAS100 Technical Analysis - NASDAQ Next Move👀👉 In this video, we take a close look at the NAS100 currency pair, which has shown bullish momentum on the 4-hour time frame but now seems to be overextended. I’m expecting a potential pullback with the US100 to the Fibonacci 50% to 61.8% retracement levels. We cover the trend, price action, market structure, and other key elements of technical analysis. Additionally, we explore a potential trade setup and, crucially, how to approach it with a higher probability of success.
As always, this video is for educational purposes only and should not be considered financial advice. It's essential to recognize that these insights are speculative and not guaranteed predictions. Make sure to verify specific price actions before executing any trades, as highlighted in the video. The analysis offers an in-depth look at the current trend, market structure, and price movements. Remember, this content is for educational purposes and does not guarantee success. Trading involves significant risks, so always apply robust risk management strategies. 📊✅

NAS100 I Daily correction potentially to 19,000 zoneWelcome back! Let me know your thoughts in the comments!
** NAS100 Analysis - Listen to video!
We recommend that you keep this pair on your watchlist and enter when the entry criteria of your strategy is met.
Please support this idea with a LIKE and COMMENT if you find it useful and Click "Follow" on our profile if you'd like these trade ideas delivered straight to your email in the future.
Thanks for your continued support!Welcome back! Let me know your thoughts in the comments!

Nasdaq could test the broken neck line levelLast week, the Nasdaq broke below the neckline of a head and shoulders (H&S) pattern, which took over a month to form. The price quickly accelerated to the downside, dropping almost 800 points.
However, once the price approached the rising trend line of the channel (a channel that has kept the price elevated for the past nine months), buyers entered the market, and now the Nasdaq 100 is trading back above 19,000.
This recovery could continue in the coming days, and a test of the broken support level is likely.
Looking further ahead to the medium term, if the price reverses from that level and drops below 19,000 once more, a break below the support line of the channel becomes probable, potentially leading to a deep correction.
For now though, as long as 18,700 remains intact, the bulls hold the upper hand.

NAS100 I Break of daily support level 19,467Welcome back! Let me know your thoughts in the comments!
** NAS100 Analysis - Listen to video!
We recommend that you keep this pair on your watchlist and enter when the entry criteria of your strategy is met.
Please support this idea with a LIKE and COMMENT if you find it useful and Click "Follow" on our profile if you'd like these trade ideas delivered straight to your email in the future.
Thanks for your continued support!Welcome back! Let me know your thoughts in the comments!

NAS100 I Sentiment remains bullish I watch for these key areasWelcome back! Let me know your thoughts in the comments!
** NAS100 Analysis - Listen to video!
We recommend that you keep this pair on your watchlist and enter when the entry criteria of your strategy is met.
Please support this idea with a LIKE and COMMENT if you find it useful and Click "Follow" on our profile if you'd like these trade ideas delivered straight to your email in the future.
Thanks for your continued support!Welcome back! Let me know your thoughts in the comments!

NAS100 (NASDAQ, US100) Technical Analysis and Trade Idea The NAS100 (NASDAQ, US100) has traded into a 1D and 4H nested bullish order block. Currently we are seeing an aggressive pullback down into our optimal entry zone. In the video we cover the trend, price action, market structure and I share a couple of trade ideas for consideration
It's important to note that the information shared is intended purely for educational purposes and does not constitute financial advice. Trading entails inherent risks, underscoring the criticality of implementing robust risk management protocols consistently.

NAS100 (NASDAQ / US100) Technical Analysis and Trade Idea The NAS100 has broken market structure (bearish) on the 1W and 1D timeframes. Currently we are seeing a bullish rally on the 1D and 4H US100 into a key resistance level. In the video, we meticulously assess the prevailing NASDAQ trend, market structure, and price behavior, deliberating a prospective buying opportunity.
It's important to note that the information shared is intended purely for educational purposes and does not constitute financial advice. Trading entails inherent risks, underscoring the criticality of implementing robust risk management protocols consistently.
