NASDAQ Potential Bearish Reversal Analysis NASDAQ Potential Bearish Reversal Analysis 🧠🔻
The chart illustrates a potential bearish setup forming after a recent uptrend in NASDAQ. Let's break it down professionally:
🔍 Technical Overview:
Ascending Trendline Break ✅
Price had been respecting a steady ascending trendline.
A break below this trendline indicates a possible momentum shift from bullish to bearish.
Bearish Pattern Formation 🔷
A bearish flag/pennant-like formation can be observed after the sharp rise.
This consolidation followed by a breakdown could be a continuation pattern, hinting at further downside.
Resistance Rejection 🔴
A red arrow marks a clear rejection from the resistance zone near 22,800 USD.
Strong wick rejections and bearish candles suggest selling pressure at that level.
Support Turned Resistance (SUPPOT 🛑)
The previously broken support zone is now acting as resistance (note: "SUPPOT" appears misspelled—should be "SUPPORT").
Bearish Target Zone 🎯
The chart marks a "TAEGET" zone (should be "TARGET") near the 21,900 – 22,000 USD range.
This aligns with prior consolidation and demand zones, making it a likely area for price to retrace.
📌 Key Zones:
Resistance (Rejection Area): 22,800 USD
Current Price: 22,739.7 USD
Bearish Target Zone: 21,900 – 22,000 USD
⚠️ Conclusion:
The market shows signs of a bearish reversal with a confirmed trendline break, resistance rejection, and bearish pattern formation. If the price fails to reclaim the 22,800 level, there’s a high probability of downward continuation toward the 22,000 target.
NASBTC

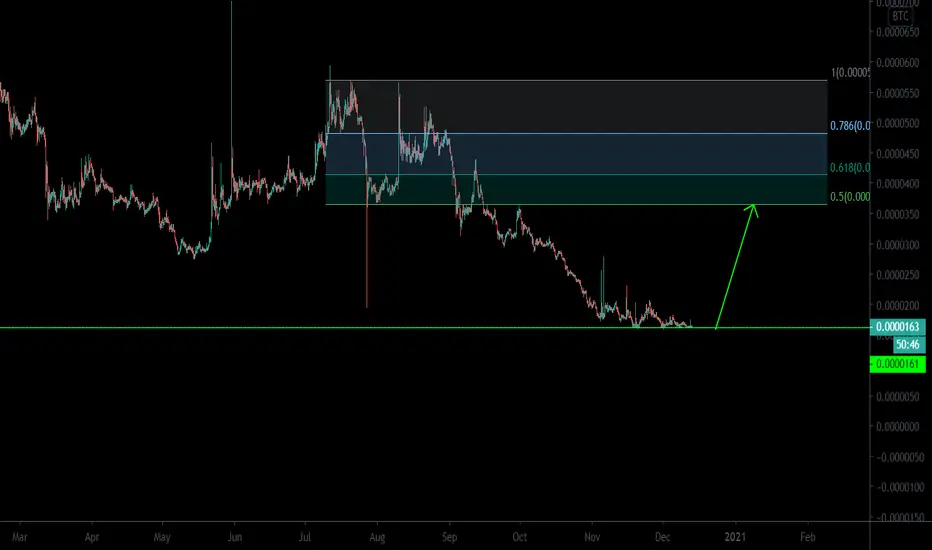
Large Sells Expected Here†LL LLHs being established. = downtrend. We are currently within 79% and 88.7% range of the previous swing. expecting price to finish its bullish correction in this zone then tank to create another lower low

Price projection on Nasdaq 100 nas100 us100Nas prolly hitting the 14k levels sooner, similar price on top 500

Nas about to moveI expect a move for nas maybe by a pump or in phases, maybe ze zill see more than 500%.

Nebulas Starts Printing Strong GREEN Candles (Easy 85%)NASBTC (Nebulas) has been printing strong bullish candles with long upper shadows.
The long upper shadows are telling us that the buyers are starting to wake up, putting pressure on the different resistance levels.
We can see prices still trading below EMA50 (0.00000054), so we can say that we are early on...
But as soon as this level is conquered (break and close above it), we can easily see additional growth.
Here I mapped an easy 85% for you... But there can be more.
Namaste.

nasusdt👑 @F̲X̲o̲n̲e̲4̲a̲l̲l̲ 👑 VIP 🚀🚀
🟢 #NAS - USDT 🔚BINANCE
💰 Buy now : 0.35
🔸TARGET 🎯
🔹 0.52
🔹0.65
📝 RATIO: 15% Risk

NASAn ooooooold coin .... just look where it came from and it is still here! Nothing else to say .... it bottomed and volume starts to kick in. RR is just outstanding.
Mic drop!
V

Nebulas (NASBTC) will go wild. 100x long termWeekly chart - logarithmic view
- We can see a neverending price drop for the last 3 years, paired with volume growth. Big bullish divergence.
- price is tightening its pressure to major MAs
- price trend curves are tightening to the limit. once broken, price is going to boom
sell at each major target and rebuy lower for the long run.
cheers,
Baked finance
this post is for educational purposes only and not investment advice. do your own research


NASBTC in parallel channelIf price stay above middle line of parallel channel there is chance to go upward an break the resistance of parallel channel,
and if close bellow middle line it will go down to 100 sats for sure

NASBTCMoving between daily MA200 and MA360, it's a matter of time to break one of those
Not financial advice, do your research

Nebulas (NAS) Now Fully Ready... Enjoy! (115% Profits Potential)NASBTC (Nebulas) managed to conquer MA200 daily which means we are ready!
Q: Ready for what?
A: Ready for growth.
Now that NASBTC is trading above the MA200 black line, we can easily see a strong move develop on this chart.
Here I am mapping 115% as our main target, but there can surely be more mid and long-term.
This is not financial advice.
Thanks a lot for your support.
Namaste.


NAS/BTC (Tested Support Twice)💎Technical Analysis Summary💎
BINANCE: NASBTC
-Nebulas retested key support twice and now consolidating above it
-There is a pause on the selling pressure and this is a good sign in the short term
-But the main battle is not yet over until the trendline resistance is broken upward
-I recommend to be cautious and wait for the proper breakout confirmation
-Reducing the risk in every trade is very important to be profitable in the long run
A big Thanks for donating 💰 via Tradingview coins this week to ahancock 🙏🎉
``````````````````````````````````````````````
Trading Involves High Risk ⚠️
Not Financial Advice 💸
Please Exercise Risk Management 💱
``````````````````````````````````````````````
Thank You All!🙏😊💖For Supporting My Channel 📺
Through Leaving A Thumbs Up, Comment & Follow 💬
Happy Trading!😊💕💖
``````````````````````````````````````````````


NAS FOR INTRADAY PROFITNAS pushing up after retracement nad i expect it will generate small profit very soon.
Volume is bullish and it should be moving higher.

$NAS, Could be ready for a quick trade over the next 24/48hs $NAS
Could be ready for a quick trade over the next 24/48hs
Crossed over ~4800 sats & hodling it w/ UCTS Buy signals across multiple LTFs..
If manage to keep pushing up from here (Volume), ~5600sats as 1st target (15%)
#NAS

NASBTC AccumulatingToday NASBTC showed bullish signs by pumping from 448 area. It was obvious that it will start to move up, as it couldn't fall lower than 440 price for many days, as I showed it in the graph with the box, you can see there many wicks. After today's mini pump NASBTC has to slowly gain price towards 530+ area, from where it will be more clear if it's going to continue it's upward movement or no.
On the other hand, if price won't hold 460+ price today, then we may see further decline towards 420 area. Keep your stop-loss tight and put sell orders around 530-564 area. Good luck !

NAS/BTC (Retest Potential Key Support)NAS/BTC
-Nebulas just pump over 40% yesterday
-Today, the price already retraced -21%
-If the pullback will continue further
-The area needs to be watching is around 415 range
-This is a confluence of previous resistance
-Which has the chance to flip into new support
-The volume has been increasing rapidly since March 2020
-This is a strong indication of accumulation
-There is tons of rooms to the upside
-But always keep an eye of the resistances ahead


✳️Nebulas [NAS/BTC] on August 09 #NAS $NAS #NASBTCOn July 27, NAS had a big dump in the 200sts and then quickly returned to 370-400sts. This is not really a good buying force, but we can also take risk with low risk.
We could buy in the 370-400sts zone as it is highly likely to return to the 500sts zone in the next few days.
It is also entirely possible that the NAS will spike to the following regions: 800sts and 1050sts

NAS/BTC, BULL DIV, BULLISH CRAB, ASCENDING TRIANGLE, 3-7X GAINSI AM NOT A FINANCIAL ADVISER, DO YOUR OWN RESEARCH!
