Nebulas New All-Time High (1450%+) & Chart AnalysisRemember our last chart for Nebulas (NASBTC)?
After sharing it, over 65% of profits came in... See it here:
Now, NASBTC is looking ultra-bullish, growing, and can do more...
Here is the long-term chart on the weekly timeframe:
Here you can see a clear break above EMA10.
MACD and RSI bullish divergence.
Multiple targets marked with its profits potential.
Red dashed line at the bottom is the All-Time Low (ATL).
When we look at Nebulas closer, we can see a clear break above EMA10/50, as well as a bullish RSI, MACD and a measurable increase in trading volume.
All these are bullish signals, NASBTC can easily continue to grow... But remember, patience is key and these charts need time to fully develop.
It can take any time from 2-5 weeks just to see a pair start moving up and hitting its targets.
A trade can take anywhere between 2-6 months to fully develop.
Be prepared for all outcomes and always have a stop-loss in case the market turns.
If you have any questions...
Use the comments section below.
Thanks a lot for reading and your continued support.
Namaste.
NASBTC

NAS is preparing for a breakoutAlthough Nebulas is currently in a downtrend, in my opinion, the reason could be Bitcoin's dumping affection and oversold, I still believe this coin will make a huge profit if we grab it now and hold for the next few weeks. It will be a breakout soon since it continues to obey the falling wedge pattern.
Go BUY BINANCE:NASBTC
Entry: 515-545
TP: 738-1044-1468
STL: 454

NAS on Binance SignalThis is a signal to buy NAS on Binance, entry price target 550 - 600 sats, sell targets are 800 - 900 - 1000 sats. NAS recently burned 1 million circulating supply. Search online to find out more about how a coin burn can effect coin value. To receive signals directly on telegram contact me directly by private message on here first.

Nebulas (Oct 06) #NAS $NAS #BTC $BTCBuy : Close to 600 as possible
Sell : 650-700-750
Mid-Hold : 900-1200
Stop : Under 550
This signal was given in VIP in Oct-06 and max target is expected in Oct-24

$NAS, Flipped resistance into support at ~6300 sats with volume$NAS
Flipped resistance into support at ~6300 sats with increasing volume..
UCTS Buy signals across many TFs
RSI at overbought levels (Bullish)
Crossed EMA50
if it shows continuation from here, aiming for ~7300 sats (10%) as 1st target..
SL under support just in case
#NAS

Nebulas (NAS) Gains Momentum | Easy 25%+ Potential ProfitsNebulas (NASBTC) is moving in the right direction as it challenges EMA200 (orange line) on the 4H timeframe.
This is a very important level and closing above it would send out a strong bullish signal.
We can see:
Strong increase in trading volume.
A very strong RSI.
Altcoins vs Bitcoin growing and heating up for months now... More to come.
With this bullish chart, we believe that NASBTC can move higher.
Note: Charts are always changing. Just as NASBTC started to print bullish candles, it can quickly reverse and move lower to test support. Always use a stop-loss or have a strategy/plan if you decide to trade.
We know exactly what action to take regardless of how the price moves, up or down, down or up... Feel free to hit LIKE to show your support.
Namaste.

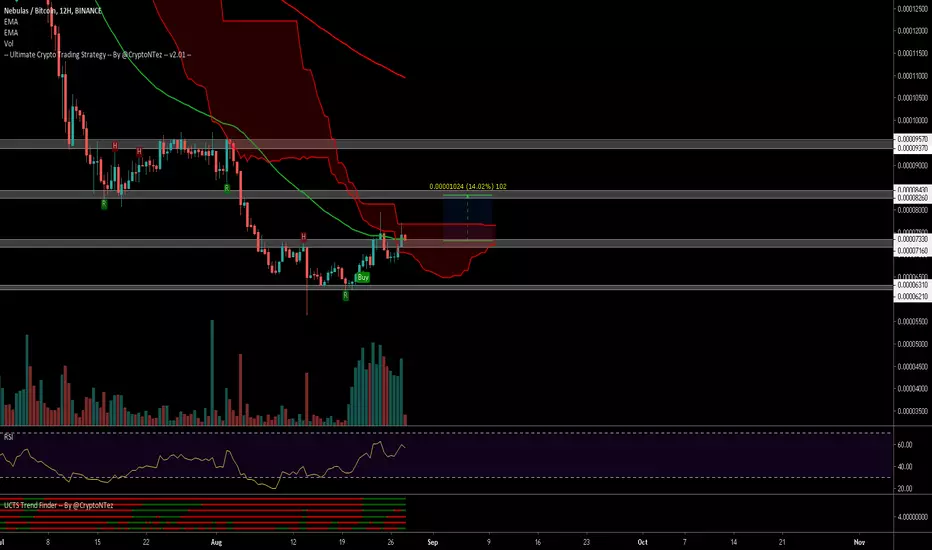
NAS, Trying to flip current level into support at ~7300sats$NAS
Trying to flip current level into support at ~7300sats, If confirmed we can aim for a long position to ~8300/9300 sats
Volume has been increasing greatly over the last days(+80BTC Binance last 24hs)
UCTS Buy signal on the 12H & 1D
Crossing ICHI cloud
#NAS
NASBTC: 50% upside move in the coming weeks ? Hello Dear traders.
NASBTC is showing some sign of life and strength on the daily timeframe . Considering the downtrend this coin has been through, this zone offers a very strong Risk Reward ratio.
You can see:
- it just reclaimed a support and it's holding the btc impulse decently.
- Price is squeezed within a C.FORK, showing a changement in the market. A C.FORK allow a trader to identify when price switches from downtrend, to a flat activity. The breakout of the C.FORK trendline is usually a bullish trigger, price switching from flat to bullish.
- The green scribble can be analyzed as a spring under support. A “spring” takes price below the last obvious low, right under support, and then reverses to close above the support. This action allows large traders to mislead the public about the future trend direction and to acquire additional coins at bargain prices. Also guys, not sure it's one, but be aware that a terminal shakeout at the end of an accumulation is like a spring on steroids. This coin is showing some volume , meaning that buyers stepped in, adding some confluence.
Any breakout above our white line resistance you can see at 725, materializing a daily resistance, and:
1. We could move up to the 947 sats zone for a 50% move.
2. If 947 is broken on a daily close, we can expect to reach the 1275 zone and a bit higher. These two targets look unlikely atm.
3. These two targets can hold price for a while, squeezing price within a trading range, but stay aware that any breakouts can very fast reach the white and blue zone, at 70 and 80 sats .
For free and live btc and alts updates, follow us on twitter by clicking here.
Happy trading.

NASBTC: 50% upside move in the coming weeks ?Hello Dear traders.
NASBTC is showing some sign of life and strength on the daily timeframe . Considering the downtrend this coin has been through, this zone offers a very strong Risk Reward ratio.
You can see:
- it just reclaimed a support and it's holding the btc impulse decently.
- Price is squeezed within a C.FORK, showing a changement in the market. A C.FORK allow a trader to identify when price switches from downtrend, to a flat activity. The breakout of the C.FORK trendline is usually a bullish trigger, price switching from flat to bullish .
- The green scribble can be analyzed as a spring under support. A “spring” takes price below the last obvious low, right under support, and then reverses to close above the support. This action allows large traders to mislead the public about the future trend direction and to acquire additional coins at bargain prices. Also guys, not sure it's one, but be aware that a terminal shakeout at the end of an accumulation is like a spring on steroids. This coin is showing some volume , meaning that buyers stepped in, adding some confluence.
Any breakout above our white line resistance you can see at 725, materializing a daily resistance, and:
1. We could move up to the 947 sats zone for a 50% move.
2. If 947 is broken on a daily close, we can expect to reach the 1275 zone and a bit higher. These two targets look unlikely atm.
For free and live btc and alts updates, follow us on twitter by clicking here.
Happy trading.

SIGNAL for NAS/BTC In Shorttime.buy NAS Between :670-700 satoshi.
This is a short term signal . breaking out the trend line . risk level low.
Targets:723 -770 -820 -885- 980
stoploss:644


$NAS is entering the early reversal stage. BullishTargets in blue on chart. Volume is looking very good and healthy.

#NAS : Up to 75% Profits Opportunity In The Mid Term. #Accumulation_Recomendation
Pair : #NAS / #BTC
Platform : #Binance
RSI : 68
Volume : A huge amount of Volume is spiked and will give #NAS a very good energy to boost from here.
- Falling wedge created and broke out with a very good candle stick formation. MACD and RSI looking bullish in favor of the bulls and EMA is already below the price level which will confirm a reversal upward bull trend.
Note : After the first impulsive wave on this trend we will be seeing a good opportunity for accumulation on the 2nd correctional wave. For this accumulating partially will be a good trading strategy.
Accumulation Area : 1450 sats - 1550 sats
Distribution Area :
Short Term Targets
Target 1 : 1724 sats
Target 2 : 1894 sats
Target 3 : 2065 sats
Target 4 : 2302 sats
Target 5 : 2616 sats
Stop Loss : 1150 sats
Risk : High
Capital Allocation : Up to 5%
@TogetherWeAccumulate

$NAS - Long. Bullish divergence on RSI and OBV (daily)$NAS - Long. Bullish divergence on RSI and OBV (daily)

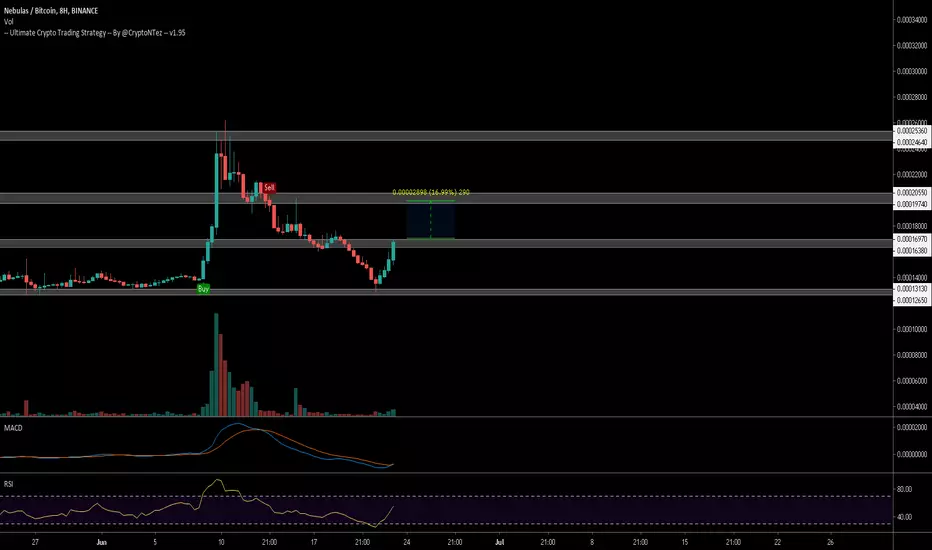
$NAS Bounced from ATL BTC support at ~12.5k sats$NAS Bounced from ATL BTC support at ~12.5k sats & moving up quickly as volume is slowly growing..
Currently reached resistance at ~16k, if it manages to cross it successfully we can aim for a new leg up to 20k sats (15%)
UCTS Buy signal on the 6h chart
MACD Bullish cross
#NAS
NAS-BTC Long Trade PlanCommodity : NEBULAS
Trade Type : LONG
Trading Against : BITCOIN
Exchange : BINANCE
Entries : Double-UP Entries throughout both the Buy Zones
Profit Taking : 25% at each TP point.
Profit Locking : Move SL to break even once TP1 is hit, to TP1 once TP2 hits, to TP2 once TP3 hits and so on
Duration - 1-2 weeks

NASBTC 15min, Bullish Shark, potential bearish 50% reversalWe have a bullish shark on the 15min TF on NAS/BTC, not the most reliable harmonic pattern but we can still look at it as it can also evolve toward a bearish 50% reversal.

NASBTC - LongFalling wedge forming. Short term target is on the chart, if breakout occurs.
Not a financial advice.

NASBTC LOOK REALLY GOOD VERY SHORT TERM TRADE#NASBTC looks really good and the triangle formation is beautiful.
buy at Current price for early entry or buy below 1400 i expect that it can drop 1 to 1.5 %
sl 3%
target : 5% , 10 % , open
Join my channel @iamcryptoman


$NAS Potential falling wedge playing out as it bounces...$NAS Potential falling wedge playing out as it bounces from support zone at around 14.5k sats...
UCTS Buy signal on the 6h
Volume kinda low for now...(wait?)
Potential ABCD bullish pattern in play
as potential Target we should aim for 18K sats as 1st target
#NAS

NAS expecting a pumpI feel NAS will show us some nice third impulse up. Targets 2200 - 2350 at least.

