USNAS100 | Breakout or Breakdown?USNAS100 | OVERVIEW
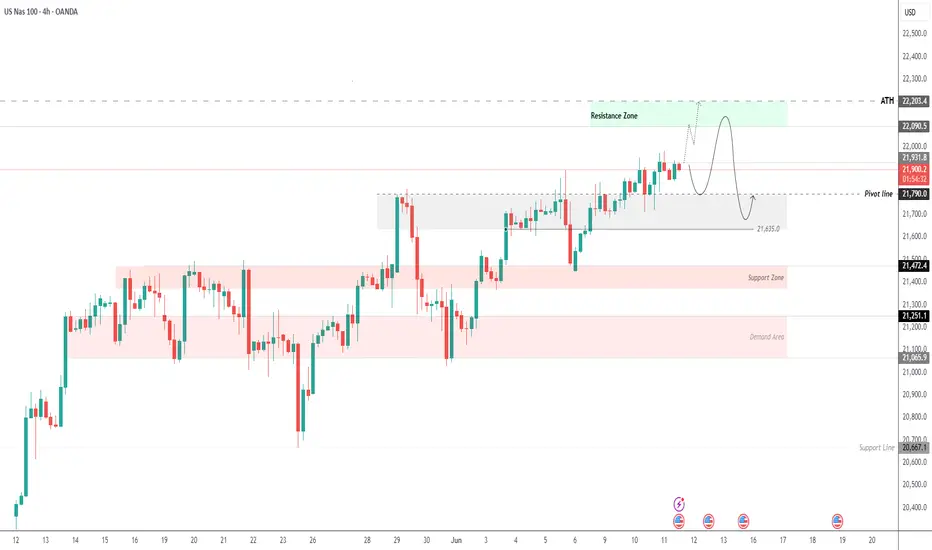
The price is currently stabilizing below the pivot level at 21790, suggesting continued bearish momentum.
📉 As long as the index remains below 21790, we expect a decline toward 21635. A confirmed 1H candle close below this level could extend the bearish trend toward 21470.
📈 A shift to bullish momentum will require a 1H candle close above 21820, which could open the way to 22090 and potentially a new all-time high at 22200.
Support Lines: 21635, 21470
Resistance Lines: 21930, 22090, 22200
Nasdaq

NASDAQ Potential UpsidesHey Traders, in today's trading session we are monitoring NAS100 for a buying opportunity around 21,700 zone, NASDAQ is trading in an uptrend and currently is in a correction phase in which it is approaching the trend at 21,700 support and resistance area.
Trade safe, Joe.

$QQQ WARNING! 6-7% Downside Possible🚨 NASDAQ:QQQ WARNING! 🚨
Holding steady... for now.
But if we break down out of the Daily WCB and through this wedge, it’s game over—GAP FILL incoming!
💥 MM: $493.31 MT: 16 July 💥
If that happens, I’m cutting all swings FAST. Stay sharp!

Staircase seen in real chartsFor the most part OANDA:NAS100USD has exhibited a near perfect staircase up so far.
It does appear fairly extended right now, but with rotation out of safe havens into risk on assets again, what remains to be seen is how much fuel is in the tank, and how far can the tailwind take it.

Nasdaq: Momentum Backed by AI, But Caution WarrantedThe Nasdaq Composite closed at 19,714.99 on June 10, extending its rally to three straight days. This rise is underpinned by three key factors: strong AI-led earnings, a supportive macro backdrop, and bullish technical patterns.
1. Fundamentals: AI Fuels Earnings
Top tech firms like NVIDIA (Q1 revenue: $44B+) and Broadcom are benefiting from the ongoing AI boom, driving the index higher. Even smaller firms like Duolingo (+53% YTD) are seeing outsized gains thanks to AI integration.
2. Macroeconomics: Stable Policy, Trade Hopes
The Fed’s steady rate policy (4.25–4.5%) is helping high-growth tech stocks maintain strong valuations. Meanwhile, improved U.S.–China trade sentiment has lifted investor confidence.
3. Technicals: Bullish Structure Holds
The Nasdaq 100 remains in a rising channel, trading above its 20-day moving average. Key levels to watch:
Resistance: 21,950–22,200
Support: 21,400 and 20,340
A breakout above 22,200 could open room for further upside.
Caution: Market Breadth is Narrow
Much of the rally is driven by a few mega-cap names—the “Magnificent Seven”: Apple, Microsoft, Alphabet, Amazon, NVIDIA, Meta, and Tesla. Their outsized influence means the index may rise even while broader market participation is weak.
Key Takeaways for Traders
AI-related earnings continue to fuel growth.
Rate stability supports tech valuations.
Market breadth is thin—watch for volatility if leadership stumbles.
Use technicals to time entries, but manage risk carefully.
Conclusion
While the Nasdaq’s rally is fundamentally and technically sound, narrow breadth adds fragility. Stay with the trend, but monitor signs of rotation or pullback closely.

NQ (Nasdaq) Futures Trading Levels [6/11/25]For Day Traders, here's some trading levels for NQ Futures Trading for today. It's CPI day, so we should get some nice swings today. Trade carefully and trade smart!

Nasdaq Potential Daily ReversalIPDA Speaking + Contract closure we can see speed take place to reach BSL outside IPDA range but why whould the just past 20 days HRLR instead of moving higher with speed
Because of Intermarket striction
maybe to build more stops there but it would be greater in terms of liquidity efficiency to place a fake D high in here and reverse, take the liquidity lower on D HRLR and then continue higher to reach 22,672.00.
The key here is: do we breach above the D SIBI or do we react from it.
one of two will unlock the next 20 to 40 trading days of delivery.

USNAS100 | CPI Data to Drive Next Move – Key Pivot at 21790USNAS100 | OVERVIEW
The index is showing sensitive price action, especially after stabilizing above the pivot level at 21790. The release of U.S. CPI data will likely dominate today's movements.
If CPI > 2.5%:
Stronger inflation could pressure the index lower. A drop toward 21790 is expected, and a break below this level may extend the bearish trend toward 21635, and possibly 21480. However, holding above 21790 may keep the bullish structure intact.
If CPI < 2.5%:
Weaker-than-expected inflation would support bullish momentum, with potential to push higher toward 22090 and test the all-time high at 22200.
Support Lines: 21790, 21635, 21480
Resistance Lines: 22090, 22200
2025-06-10 - priceactiontds - daily update - nasdaqGood Evening and I hope you are well.
comment: Range is 21500 - 22000 for a week now. Neutral but selling new highs and buying every pullback has been profitable for quite a while now. It will end some day but likely not today. Bulls finally want the 22000 print and after so many tries they still could not print it. It’s painful to watch. Fading the extremes was good for a month now and I have no bigger opinion on where we might close this week. Anything below 21700 would be a huge bear surprise and could mean the bull wedge break to the downside and next target would be 21500.
current market cycle: trading range
key levels: 21500 - 22000
bull case: Bulls expect 22000 and buy every pullback. Their problem is, that they have tried so so many times now and could still not print it. How many more times will they try? The wedge will break eventually and I highly doubt it will be to the upside. Bulls can not hold long at the highs since pullbacks are 130-500 points big. Look for longs on decent pullbacks once bears give up. Multiple times below 21800 today. When we print 22000, what are the odds of this going higher for 22500 or new ath above 22688? No idea but looking at the wedge and the structure since April, longing momentum makes sense but that’s it.
Invalidation is below 21390.
bear case: Just imagine cpi comes in hot… Bears can only dream. They are doing fine selling new highs and scalping for 100+ points. They are too weak to print lower lows, so don’t bet on them. Once we go below 21700 again, we can look for better targets and market is likely neutral again. Until then, try not to get trapped.
Invalidation is above 22100.
short term: Likely bearish around 21950-22000 for another pullback into 21750/21800. Still expecting 22k to get hit tomorrow. Rough guess: If we move strongly above 22080ish, we could see an acceleration upwards due to short covering from hell but don’t bet on it. Only go with the momentum if it happens.
medium-long term - Update from 2024-05-24: Will update this section more after the coming week but in general the thesis is as for dax. Down over the summer and sideways to up into year end. I don’t think the lows for this year are in.
trade of the day: Longing 21800 was good so many times since Friday.

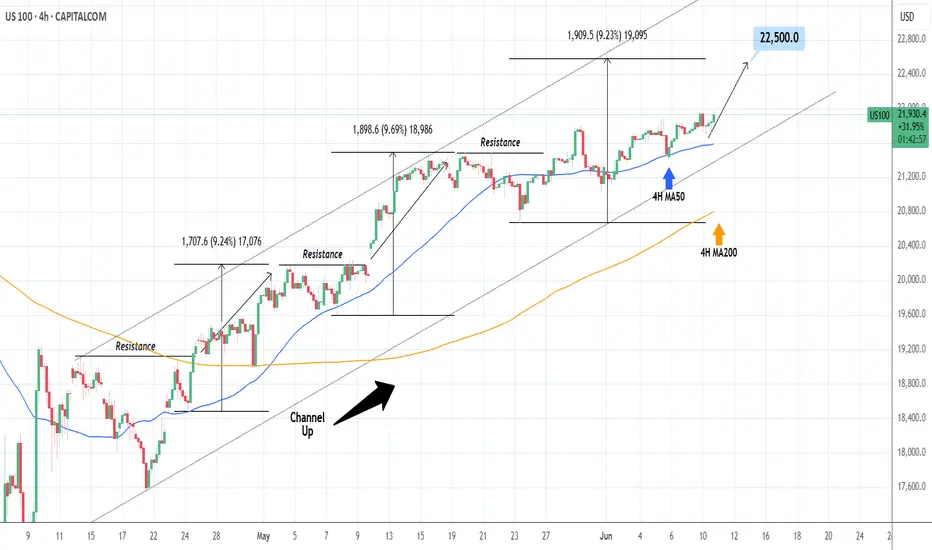
NASDAQ: Close to a strong bounce.Nasdaq is about to turn overbought on its 1D technical outlook (RSI = 68.736, MACD = 505.460, ADX = 18.046) as it is extending an uptrend since the 4H MA50 test/bounce. Such low paced price increase typically precedes strong breakouts. Since the long term pattern is a Channel Up, we are still on its 3rd bullish wave overall. The prior ones were +9.50% on avg, so we remain bullish on the short term, TP = 22,500.
## If you like our free content follow our profile to get more daily ideas. ##
## Comments and likes are greatly appreciated. ##
Nasdaq Bearish 4hNasdaq Bearish after the failure in continuation through Previous Weekly High and the rejection afterwards.
Setting the Target to 21,471.00 Swing Low and using 21,716.00 as Low Easy Hanging Fruit (LEHF) objective that We may even reach today despite the small range day expectation (pre-CPI)

Nasdaq at Supply Zone – Rejection or Breakout? (READ THE CAPTIONBy examining the #Nasdaq chart on the weekly timeframe, we can see that the price is still trading within the supply zone around 21,850. We are still waiting for a strong rejection from this level, which could lead to a short-term price correction in this index.
The potential downside targets are:
21,000, 20,700, 20,200, and 19,150.
The key supply range lies between 21,400 and 22,200.
Additionally, there is a possibility of a liquidity grab or stop-hunt above 22,200 before any real drop begins.
This analysis will be considered invalid if price closes above 22,400 in the next three weeks.
On the fundamental side, there are several macro factors to watch:
Interest Rate Expectations:
Although inflation in the U.S. has cooled compared to last year, the Fed remains cautious. If upcoming CPI or PPI prints show unexpected resilience, the likelihood of rate cuts this year could diminish, pressuring tech-heavy indices like Nasdaq.
Tech Sector Valuations:
Valuations in major tech names — such as NVIDIA, Apple, and Microsoft — have reached historically high multiples. This makes Nasdaq particularly vulnerable to correction, especially if earnings disappoint or growth expectations soften.
Geopolitical Risks:
Ongoing tensions between the U.S. and China over trade and technology, as well as potential instability in the Middle East, could contribute to a risk-off sentiment — further supporting the case for a short-term pullback.
Earnings Season Ahead:
Q2 earnings season is around the corner. Any signs of slowing revenue growth or reduced forward guidance from major tech firms could act as a catalyst for the expected correction.
Please support me with your likes and comments to motivate me to share more analysis with you and share your opinion about the possible trend of this chart with me !
Best Regards , Arman Shaban

Nasdaq-100 (NDX) Weekly Chart 2025 Chart Context
This weekly timeframe analysis of the Nasdaq-100 Index (NDX) forms a key pillar in our 2025 macro analysis series. Following the breakout structure seen in TOTAL, TOTAL2, BTC.D, and US10Y, this chart utilizes 2 Fibonacci tools (1 trend-based extensions and 1 retracement) to project potential corrective and expansion scenarios.
Fibonacci Tools Used:
Fibonacci Retracement : Applies to the recent smaller swing to determine micro retracement zones and cluster supports.
0=20674 and 100=10504
Trend-Based Fibonacci Extension: Drawn using a three-leg structure (point A= 3993 to B=16724 to C10504) to forecast upside targets beyond ATH.
All take-profit (TP) levels: TP1 (~23,400), TP2 (~26,700), and TP3 (~30,344.49)—are located at confluence zones where Fibonacci levels from different tools align, reinforcing their validity and strength.
There is a 4TP above all the Visible TPs
Key price references:
0% retracement: ~20,674.71
Next Resistance ~23,400 (confluence of extensions and psychological resistance)
Projected TPs:
1TP=~23,400,
2TP=~26,700,
3TP=~30,344.49,
4TP=44000
Support/Resistance:
Red zone: ~16,700–18,300 (historical S/R and correction target and Fib Confluences)
Resistance zone: ~23,000–23,400 ,
22000(ATH area)
Key Technical Observations:
Fibonacci Retracement from ~20674 to ~15732 marks the initial corrective range.
Trend-Based Extensions forecast:
TP1 (~23,400): First breakout resistance
TP2 (~26,700): Medium-term expansion zone
TP3 (~30,344): Long-term target if macro tailwinds persist
Scenario Pathways:
Bullish Continuation: Breaks above ATH to reach TP2/TP3
Healthy Correction: Pullback to ~20,600 or deeper ~18,300 before resumption
Deep Correction: Revisits ~16,700 zone if macro environment deteriorates
Fundamental Context:
Tech Stocks & Economic Sentiment: NDX is often the first to move during liquidity expansions. Its performance signals risk-on behavior across global equity markets.
Rate Cuts in 2025: With anticipated Fed rate cuts, tech stocks are primed for inflows. Forward earnings valuations rise, justifying extended upside in high-beta tech.
AI Boom & Earnings Growth: Nasdaq is heavily weighted toward AI, cloud, and semiconductors—sectors expected to lead earnings surprises.
NDX Influence on Gold and Crypto
When NDX rallies:
Crypto: Risk appetite improves. Capital rotation flows into altcoins and layer-1 assets.
Bitcoin: Often sees parallel inflows, especially during strong tech rallies (e.g., 2020).
TOTAL & TOTAL3: Begin breakout patterns if NDX continues to surge.
Gold: May stall or correct as investors favor risk assets. However, gold still holds due to macro hedging and real yield pressures.
When NDX corrects:
Crypto: Volatility spikes. Altcoins bleed faster.
Bitcoin: Short-term dip but may decouple if viewed as digital gold.
Gold: Benefits from flight-to-safety behavior.
US10Y: Often reacts inversely to NDX moves—used for confirmation.
Search Highlights (2024–2025):
Institutions view NDX correction as signal to rotate into commodities (incl. gold).
Cross-market correlations show NDX peaks often precede crypto mini-rallies.
De-risking from NDX often triggers gold strength, especially in geopolitical or inflationary backdrops.
Bias & Strategy Implication
Primary Bias: Bullish
Expecting upside continuation to 26,700–30,000 zone
Multiple correction opportunities are present even during rally
Strategic Actions:
Monitor for correction to yellow/red zones for accumulation
Use NDX behavior as leading macro signal for crypto rotations
Watch resistance at 23,400 closely; breakout confirms trend extension
Time Horizon
Short-Term (1–2 months): Watch for breakout or correction to ~20,600–18,300
Mid-Term (3–6 months): Probable test of ~26,700
Long-Term (6–12 months): Potential expansion to ~30,344.49

Nasdaq-100 H1 | Potential bullish bounce off 50% Fibo support?The Nasdaq-100 (NAS100) is falling towards a pullback support and could potentially bounce off this level to climb higher.
Buy entry is at 21,703.02 which is a pullback support that aligns with the 50.0% Fibonacci retracement.
Stop loss is at 21,400.00 which is a level that lies underneath a swing-low support and the 50.0% Fibonacci retracement.
Take profit is at 22,022.32 which is a resistance that aligns with the 127.2% Fibonacci extension.
High Risk Investment Warning
Trading Forex/CFDs on margin carries a high level of risk and may not be suitable for all investors. Leverage can work against you.
Stratos Markets Limited (tradu.com ):
CFDs are complex instruments and come with a high risk of losing money rapidly due to leverage. 63% of retail investor accounts lose money when trading CFDs with this provider. You should consider whether you understand how CFDs work and whether you can afford to take the high risk of losing your money.
Stratos Europe Ltd (tradu.com ):
CFDs are complex instruments and come with a high risk of losing money rapidly due to leverage. 63% of retail investor accounts lose money when trading CFDs with this provider. You should consider whether you understand how CFDs work and whether you can afford to take the high risk of losing your money.
Stratos Global LLC (tradu.com ):
Losses can exceed deposits.
Please be advised that the information presented on TradingView is provided to Tradu (‘Company’, ‘we’) by a third-party provider (‘TFA Global Pte Ltd’). Please be reminded that you are solely responsible for the trading decisions on your account. There is a very high degree of risk involved in trading. Any information and/or content is intended entirely for research, educational and informational purposes only and does not constitute investment or consultation advice or investment strategy. The information is not tailored to the investment needs of any specific person and therefore does not involve a consideration of any of the investment objectives, financial situation or needs of any viewer that may receive it. Kindly also note that past performance is not a reliable indicator of future results. Actual results may differ materially from those anticipated in forward-looking or past performance statements. We assume no liability as to the accuracy or completeness of any of the information and/or content provided herein and the Company cannot be held responsible for any omission, mistake nor for any loss or damage including without limitation to any loss of profit which may arise from reliance on any information supplied by TFA Global Pte Ltd.
The speaker(s) is neither an employee, agent nor representative of Tradu and is therefore acting independently. The opinions given are their own, constitute general market commentary, and do not constitute the opinion or advice of Tradu or any form of personal or investment advice. Tradu neither endorses nor guarantees offerings of third-party speakers, nor is Tradu responsible for the content, veracity or opinions of third-party speakers, presenters or participants.

USNAS100 Bearish Below 21,790 – Key Levels to WatchUSNAS100 – Overview
The price remains under bearish pressure as long as it trades below the pivot level at 21,790. A continued move lower is expected toward the support at 21,635, and a 15-minute close below this level may extend the bearish trend toward 21,480.
To shift to a bullish outlook, the price must stabilize above 21,920, which could open the path toward 22,090.
Pivot: 21,790
Support Levels: 21,635 · 21,480 · 21,250
Resistance Levels: 21,920 · 22,090 · 22,200

Digital Turbine, Inc. (APPS)As a Whole formation, it looks to me the nearest Scenario is we Completed Major 1st Wave at 102$ , In my opinion as a technical analyst in charts and technical formations, in addition to the corrective formations I have encountered many times before, we have completed the correction of a leg of a major correction for the second large wave at $1.18. We are entering the early stages of the second leg, which I expect 99% will go to its final target at $141 by 2027. However, the closest level in 2025 is $25, and perhaps with significant news like a partnership and investment with major companies, it might hit the target of $49 by early 2026. The correction as a whole is called the minor or accelerating correction A B C.
Target Prices and Expected Periods: -
1 Month = 25$
6 - 9 Months = 49$
12 - 15 Months = 141$
APPS has a High Technical Rating by Nasdaq Dorsey Wright.
Earnings announcement* for APPS - Jun 16, 2025

NASDAQ Initiated a standard short-term Bull Cycle.Nasdaq (NDX) has been trading within a Channel Up ever since the November 2008 bottom of the U.S. Housing Crisis. The recent Trade War correction that started early this year, bottomed just before the 1W MA200 (orange trend-line) and rebounded.
As this chart shows, every break below the 1W MA50 (blue trend-line) has technically started a new Cycle. During this 16-year pattern, we have seen two types of Cycles, a short (blue Rectangle) and long (green Rectangle).
Based on the sequence since the start of the Channel Up, the index should have now just initiated its new short Cycle. Both previous ones peaked on the 1.786 Fibonacci extension before a correction below the 1W MA50 again. As a result, we expect to see 28000 at least before the next meaningful technical correction.
-------------------------------------------------------------------------------
** Please LIKE 👍, FOLLOW ✅, SHARE 🙌 and COMMENT ✍ if you enjoy this idea! Also share your ideas and charts in the comments section below! This is best way to keep it relevant, support us, keep the content here free and allow the idea to reach as many people as possible. **
-------------------------------------------------------------------------------
💸💸💸💸💸💸
👇 👇 👇 👇 👇 👇

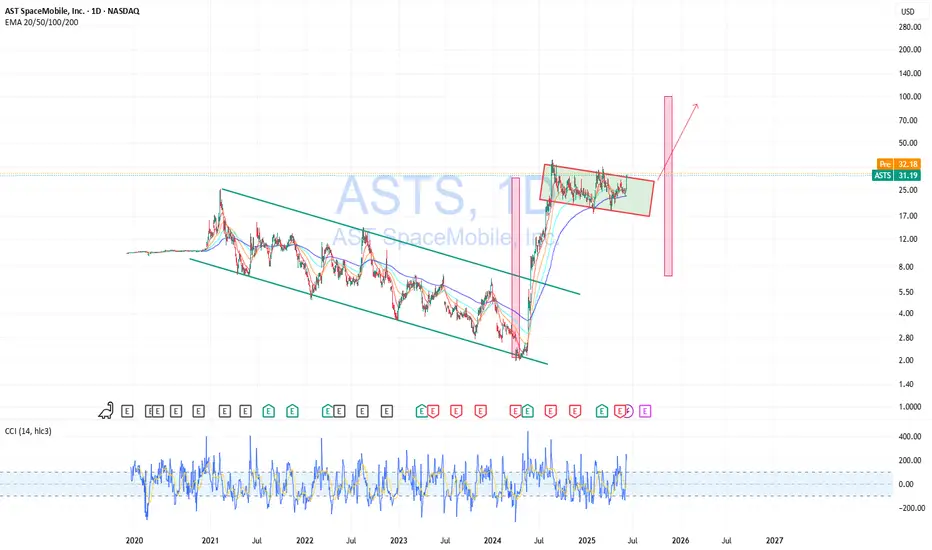
Buying ASTS — Waiting for BreakoutASTS has broken out of a long-term downtrend and is now consolidating in a tight range, forming a base after a strong impulse move. This kind of price action often leads to another breakout, especially when supported by rising volume and EMAs lining up underneath.
I’m buying in this current zone, expecting a breakout from the range and continuation to the upside. I’ll be watching for confirmation through volume spikes and a clean move above resistance. The chart structure looks strong, and the upside potential remains high.
NAS100 - Will the stock market reach its previous ATH!?The index is above the EMA200 and EMA50 on the 4-hour timeframe and is trading in the specified pattern. In case of a valid break of this range, I expect a new trend to form. It is better to wait for confirmation on the break in order to control further risk.
U.S. President Donald Trump announced that an American delegation will meet with Chinese representatives in London on June 9 to discuss a potential trade agreement. In a post on Truth Social, Trump stated, “I’m pleased to announce that Treasury Secretary Scott Bessent, Commerce Secretary Howard Lutnick, and U.S. Trade Representative Jamieson Greer will meet with Chinese officials on Monday, June 9, 2025, in London to discuss a trade deal.” He added that he expects the meeting to go “very well.” U.S. stock markets rose on Friday, and Chinese markets are now following suit. The Hang Seng Index has reached its highest level since March.
Meanwhile, Amazon has completely halted its hiring budget for office workers in its core retail business. This decision applies only to white-collar staff and excludes warehouse employees and those in its cloud computing division. According to Business Insider, which cited internal company emails, the hiring freeze affects Amazon’s online marketplace, logistics operations, and grocery business.
Having doubled its workforce between 2019 and 2021 to 1.6 million, Amazon reduced that number to 1.55 million last year. Since late 2022, the e-commerce giant has laid off at least 27,000 employees.
This move comes as the U.S. jobs report released Friday helped ease some concerns, though signs of broader economic challenges remain. Experts suggest that such a hiring freeze could reflect broader economic trends—where mass layoffs are avoided, but hiring slows down significantly.
In May, the U.S. economy added 139,000 jobs, down from 147,000 in April. The unemployment rate remained steady at 4.2%, staying within the narrow range it has held over the past year. The labor market has remained resilient, dismissing fears that tariffs would cause a significant slowdown. So far, tariff-related disruptions have not been severe enough to destabilize the job market—at least not in May.
Data indicates that employers continue to refrain from layoffs, even as hiring has slowed considerably compared to the post-pandemic surge. Labor market analysts expect signs of weakness to emerge in the coming months, as businesses become more cautious about hiring due to uncertainty surrounding tariffs—according to recent surveys. For now, however, the labor market remains strong.
The absence of red flags in employment may give the Federal Reserve more room to maintain its patient stance on interest rate cuts. This year, Fed officials have kept interest rates higher than average to curb inflation by increasing borrowing costs. The Fed’s dual mandate is to keep inflation low and employment high, and it may opt to cut rates to stimulate the economy if the labor market weakens.Fed Chair Jerome Powell and other FOMC members have said they are waiting to see whether President Trump’s trade wars will stoke inflation, trigger job losses, or both. So far, neither scenario has materialized. Strong labor market data may give them further justification to stay in wait-and-see mode. Rosner wrote, “Given the Fed’s sharp focus on inflation risk management, today’s stronger-than-expected jobs report is unlikely to alter its patient approach. We expect the Fed to remain on hold at this month’s meeting and believe further deterioration

NASDAQ failed to capture hourly fair value gap multiple times.The US100 index failed to close a body above the hourly fair value gap multiple times. I would expect it to go towards sellside liquidity marked on the chart after multiple failed attempts at closing above an important level .

NASDAQ Still failing to secure meaningful closes above the rangeAll explained in video. Please let me know if there is anything I may have missed in this analysis.
Thanks and share with anyone who may be interested 🔓

NASDAQ Potential UpsidesHey Traders, in today's trading session we are monitoring NAS100 for a buying opportunity around 21,300 zone, NASDAQ is trading in an uptrend and currently is in a correction phase in which it is approaching the trend 21,300 support and resistance area.
Trade safe, Joe.

Weekly Market Forecast: BUY Stock Indices & Oil! Sell Gold! In this Weekly Market Forecast, we will analyze the S&P 500, NASDAQ, DOW JONES, Gold and Silver futures, for the week of June 9 - 13th.
Stock Indices are looking more bullish. Valid buys only!
Gold is weak. Sells only until there is a market structure shift upwards.
Oil prices have room to go higher. Buy it.
Silver is a wait and see. Should start to pull back this week, as it closed last week stronger than Gold.
CPI Wednesday. After the news is announced, the market should be very tradeable for the rest of the week.
Enjoy!
May profits be upon you.
Leave any questions or comments in the comment section.
I appreciate any feedback from my viewers!
Like and/or subscribe if you want more accurate analysis.
Thank you so much!
Disclaimer:
I do not provide personal investment advice and I am not a qualified licensed investment advisor.
All information found here, including any ideas, opinions, views, predictions, forecasts, commentaries, suggestions, expressed or implied herein, are for informational, entertainment or educational purposes only and should not be construed as personal investment advice. While the information provided is believed to be accurate, it may include errors or inaccuracies.
I will not and cannot be held liable for any actions you take as a result of anything you read here.
Conduct your own due diligence, or consult a licensed financial advisor or broker before making any and all investment decisions. Any investments, trades, speculations, or decisions made on the basis of any information found on this channel, expressed or implied herein, are committed at your own risk, financial or otherwise.
