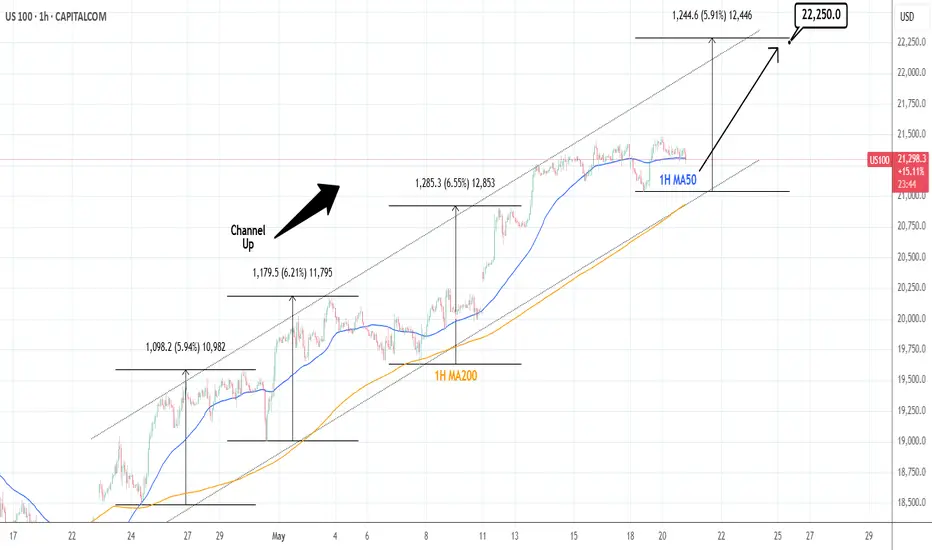
NASDAQ: Channel Up to soon initate the new bullish wave.Nasdaq is bullish on its 1D technical outlook (RSI = 67.876, MACD = 566.960, ADX = 50.516) as it is still holding the Channel Up of almost 1 month back, whose support is the 1H MA200. Right now the price is consolidating around the 1H MA50, approaching the bottom of the pattern. Once it does, we expect it to initate the new bullish wave. With the shortest one of the Channel Up being +5.90%, we remain bullish here and look towards a TP = 22,250 by early next week.
## If you like our free content follow our profile to get more daily ideas. ##
## Comments and likes are greatly appreciated. ##
Nasdaq
EVLV 1WEVLV — a rectangle pattern has formed, and the 100 MA has crossed above the 200 MA, signaling the start of a potential trend reversal. Targets: $8.29 and $12.94.
As of May 2025, the fundamental outlook for Evolv Technologies Holdings Inc. (ticker: EVLV) is as follows:
The company continues to show strong revenue growth and improving key financial metrics, despite remaining unprofitable. Revenue for 2024 reached $103.9 million, up 31% from 2023, while the net loss was halved to $54 million. EBITDA improved to -$21 million from -$51.8 million the year before. Annual recurring revenue (ARR) grew by 39% to $99.4 million. The company maintains a strong financial position with $51.9 million in cash and zero debt.
The stock is currently trading at $4.44, above its estimated intrinsic value of $2.76 according to AlphaSpread. Analysts remain optimistic, giving EVLV a “Strong Buy” rating and forecasting an average price target of $5.31, suggesting about 19.6% upside potential.
However, investors should keep in mind that the company is still unprofitable, and the current market valuation exceeds its fundamental value.

XAU/USD: More Bullish Move Ahead? (READ THE CAPTION)By analyzing the gold chart on the 2-hour timeframe, we can see that after our last analysis, the price dropped to $3120, and then faced strong buying pressure, pushing it back up to the $3240 area! Gold is now trading in a critical zone for trend direction. If the price manages to hold above $3233, we can expect further bullish movement. This analysis will be updated with your support!
Please support me with your likes and comments to motivate me to share more analysis with you and share your opinion about the possible trend of this chart with me !
Best Regards , Arman Shaban

Nasdaq-100 H1 | Pullback support at 23.6% Fibonacci retracementNasdaq-100 (NAS100) is falling towards a pullback support and could potentially bounce off this level to climb higher.
Buy entry is at 20,898.76 which is a pullback support that aligns with the 23.6% Fibonacci retracement.
Stop loss is at 20,500.00 which is a level that lies underneath a swing-low support and the 38.2% Fibonacci retracement.
Take profit is at 21,471.38 which is a swing-high resistance.
High Risk Investment Warning
Trading Forex/CFDs on margin carries a high level of risk and may not be suitable for all investors. Leverage can work against you.
Stratos Markets Limited (tradu.com):
CFDs are complex instruments and come with a high risk of losing money rapidly due to leverage. 63% of retail investor accounts lose money when trading CFDs with this provider. You should consider whether you understand how CFDs work and whether you can afford to take the high risk of losing your money.
Stratos Europe Ltd (tradu.com):
CFDs are complex instruments and come with a high risk of losing money rapidly due to leverage. 63% of retail investor accounts lose money when trading CFDs with this provider. You should consider whether you understand how CFDs work and whether you can afford to take the high risk of losing your money.
Stratos Global LLC (tradu.com):
Losses can exceed deposits.
Please be advised that the information presented on TradingView is provided to Tradu (‘Company’, ‘we’) by a third-party provider (‘TFA Global Pte Ltd’). Please be reminded that you are solely responsible for the trading decisions on your account. There is a very high degree of risk involved in trading. Any information and/or content is intended entirely for research, educational and informational purposes only and does not constitute investment or consultation advice or investment strategy. The information is not tailored to the investment needs of any specific person and therefore does not involve a consideration of any of the investment objectives, financial situation or needs of any viewer that may receive it. Kindly also note that past performance is not a reliable indicator of future results. Actual results may differ materially from those anticipated in forward-looking or past performance statements. We assume no liability as to the accuracy or completeness of any of the information and/or content provided herein and the Company cannot be held responsible for any omission, mistake nor for any loss or damage including without limitation to any loss of profit which may arise from reliance on any information supplied by TFA Global Pte Ltd.
The speaker(s) is neither an employee, agent nor representative of Tradu and is therefore acting independently. The opinions given are their own, constitute general market commentary, and do not constitute the opinion or advice of Tradu or any form of personal or investment advice. Tradu neither endorses nor guarantees offerings of third-party speakers, nor is Tradu responsible for the content, veracity or opinions of third-party speakers, presenters or participants.

2025.05.20 nasdaq analysisDuring the European session, NASDAQ maintained a downward trend and broke below the 21187 level, as shown here:
This movement suggested a potential shift toward a bearish direction.
However, after that, NASDAQ started forming an upward trend and moved sideways. Eventually, the resistance trendline was broken in the blue box area, which you can see here:
This breakout indicated a short-term trend reversal.
The moment this trend reversal occurred coincided with the U.S. market open, accompanied by a significant surge in trading volume that led to a strong upward move.
At this point, the U.S. session closed with a new high compared to the previous pattern, suggesting that the trend has turned bullish.
However, based on the corrective action seen during the Asian session, it seems that the Asian market is not fully accepting the upward momentum.
Here is the current NASDAQ pattern:
It shows an expanding pennant pattern, with both the highs and lows widening over time.
As of now, it is highly likely that the market will continue to move with volatility in both directions until a decisive breakout occurs.
You can view the current situation in more detail here:
In terms of the upside, even though the price could theoretically reach 22000, it doesn’t hold much significance without confirmation from historical data.
Therefore, I recommend taking buy positions only if the market shows a strong inflection point similar to yesterday’s move.
Even if the recent low of 21112 is broken, the price is still within the expanding pennant pattern, and a rebound remains possible.
A conservative bearish view would only be valid if the price breaks below the previous consolidation area that formed just before the strong rally—specifically the black box range, which is around 20723–20680.
Summary:
There’s a high probability of stop-hunting in the current range.
Whether buying or selling, it's recommended to enter only when a clear setup is provided.
Don’t rely on hope that the price will return to your average entry. If the market chooses a direction during this phase, it could lead to unrecoverable losses.
This could be a highly profitable zone if handled correctly, but trading without conviction is like a drug.
Today is not the only opportunity.

sionna therapeutics, inc (new listing, IPO)The process of being listed and the outcome of said listing in the chart. The price is down. This is the new listing of Sionna Therapeutics on NASDAQ.

(NQ) | Strong Buyers and Blue‑Box Entry Zones(NQ) | Strong Buyers and Blue‑Box Entry Zones
NQ shows powerful buying pressure, and the marked blue boxes highlight areas where demand has reliably appeared. For those seeking long exposure, two approaches stand out:
Low‑Time‑Frame Breakouts from the Blue Box
Wait for price to dip into a blue‑boxed support zone and then break higher on shorter time frames. A decisive move with rising footprint volume confirms genuine buyer commitment.
Direct Low‑Time‑Frame Breakouts
If price skips a pullback and powers upward on low‑time‑frame charts, that momentum surge—backed by substantial volume—also provides a valid long entry.
Key Considerations
Ensure any breakout is backed by real volume footprint signals, not just price movement.
If these zones fail to hold or volume dries up, stand aside and await the next confirmed setup.
By focusing on these blue‑boxed areas and insisting on volume‑confirmed breakouts, you align your entries with where buyers truly dominate.
📌I keep my charts clean and simple because I believe clarity leads to better decisions.
📌My approach is built on years of experience and a solid track record. I don’t claim to know it all but I’m confident in my ability to spot high-probability setups.
📌If you would like to learn how to use the heatmap, cumulative volume delta and volume footprint techniques that I use below to determine very accurate demand regions, you can send me a private message. I help anyone who wants it completely free of charge.
🔑I have a long list of my proven technique below:
🎯 ZENUSDT.P: Patience & Profitability | %230 Reaction from the Sniper Entry
🐶 DOGEUSDT.P: Next Move
🎨 RENDERUSDT.P: Opportunity of the Month
💎 ETHUSDT.P: Where to Retrace
🟢 BNBUSDT.P: Potential Surge
📊 BTC Dominance: Reaction Zone
🌊 WAVESUSDT.P: Demand Zone Potential
🟣 UNIUSDT.P: Long-Term Trade
🔵 XRPUSDT.P: Entry Zones
🔗 LINKUSDT.P: Follow The River
📈 BTCUSDT.P: Two Key Demand Zones
🟩 POLUSDT: Bullish Momentum
🌟 PENDLEUSDT.P: Where Opportunity Meets Precision
🔥 BTCUSDT.P: Liquidation of Highly Leveraged Longs
🌊 SOLUSDT.P: SOL's Dip - Your Opportunity
🐸 1000PEPEUSDT.P: Prime Bounce Zone Unlocked
🚀 ETHUSDT.P: Set to Explode - Don't Miss This Game Changer
🤖 IQUSDT: Smart Plan
⚡️ PONDUSDT: A Trade Not Taken Is Better Than a Losing One
💼 STMXUSDT: 2 Buying Areas
🐢 TURBOUSDT: Buy Zones and Buyer Presence
🌍 ICPUSDT.P: Massive Upside Potential | Check the Trade Update For Seeing Results
🟠 IDEXUSDT: Spot Buy Area | %26 Profit if You Trade with MSB
📌 USUALUSDT: Buyers Are Active + %70 Profit in Total
🌟 FORTHUSDT: Sniper Entry +%26 Reaction
🐳 QKCUSDT: Sniper Entry +%57 Reaction
📊 BTC.D: Retest of Key Area Highly Likely
📊 XNOUSDT %80 Reaction with a Simple Blue Box!
📊 BELUSDT Amazing %120 Reaction!
📊 Simple Red Box, Extraordinary Results
I stopped adding to the list because it's kinda tiring to add 5-10 charts in every move but you can check my profile and see that it goes on..

etoro (new listing)stock listing of ETORO to NASDAQ, I've heard of this company. Most of the time when a company that most people have heard of is listed there is a higher chance of the company doing well. As of right now the price is only in the red since the date of listing. The listing price was supposed to be around $46-$50 so officially the stock market, as usual, is not showing the truth; based on being compared to cryptocurrency prices. The listing shows that the price started at a peak which was probably after a bunch of pre-market trades happened and bumped the price up. That was not the true entry IPO list price.

THIS TIME IT'S DIFFERENT!🔥 THIS TIME IT'S DIFFERENT! 🔥
Can you see the shift?! VOLUME IS HERE—AND IT'S MASSIVE. 💪💰
Unlike those weak, fleeting rallies that got crushed under waves of red, this one is packed with bullish buyers and offside hedge funds READY TO SEND IT HIGHER. 🚀📈
Not to mention the last time we had this level of above average volume for this long was in October 2023 when we were coming out of a bear market and it was only the beginning of our ascent higher!
I'm not saying we can't have a pullback soon...I'm just simply saying the volume is here and it looks like dips will indeed be shallow.
ATH retest INBOUND!
Are you positioned for the move? 👀
AMEX:SPY NASDAQ:QQQ

Is NASDAQ ready to correct for a few days?We have a couple of doji candles on the daily chart forming out of a bearish imbalance range in the relative premium. This is the perfect place to test the lows for stops.
We are still bullish but I am going to go neutral for this forecast in anticipation of a slight correction.
Share this with someone who needs a complete top down analysis of where we are staring this week!

NASDAQ Critical level for short-term.Nasdaq (NDX) is testing a strong short-term Support Cluster, the Lower Lows trend-line and the bottom of the 1H Channel Up. Being below the 1H MA50 (blue trend-line), the trend is right now neutral until one of the two levels breaks.
If the index breaks above the 1H MA50, we will turn bullish again, targeting 22200 (+5.70% from the current Low, the minimum % rise in the past month).
If it breaks below the Support Cluster, we will turn bearish, targeting the 1H MA200 (orange trend-line) at 20800.
-------------------------------------------------------------------------------
** Please LIKE 👍, FOLLOW ✅, SHARE 🙌 and COMMENT ✍ if you enjoy this idea! Also share your ideas and charts in the comments section below! This is best way to keep it relevant, support us, keep the content here free and allow the idea to reach as many people as possible. **
-------------------------------------------------------------------------------Disclosure: I am part of Trade Nation's Influencer program and receive a monthly fee for using their TradingView charts in my analysis.
💸💸💸💸💸💸
👇 👇 👇 👇 👇 👇


NAS100 - Will the Stock Market Reach Its Previous High?!The index is trading above the EMA200 and EMA50 on the four-hour timeframe and is trading in its ascending channel. If the trend line is broken, I expect corrective moves, but if the index corrects towards the demand zone, we can look for further buying positions in Nasdaq with a risk-reward ratio. Maintaining this trend line will lead to a continuation of the Nasdaq upward trend.
The strong rally in U.S. equities that had pushed the S&P 500 close to record highs for 2025 came to a halt on Friday, following the release of disappointing consumer sentiment data. A report from the University of Michigan revealed a drop in consumer confidence and a surge in inflation expectations to levels not seen in decades—factors that have amplified concerns about the economy’s outlook.
Despite this, some analysts remain hopeful that robust corporate earnings and the temporary suspension of tariffs could provide needed support for the market. Meanwhile, rating agency Moody’s warned that U.S. federal debt is projected to climb to 134% of GDP by 2035, up from 98% in 2024.
Moody’s noted that while the U.S. economy and financial system remain strong, the weakening of certain fiscal indicators has diminished the ability of these strengths to offset negative effects. According to their analysis, trade tariffs will not significantly impact long-term U.S. economic growth, and substantial changes in mandatory spending are unlikely in the near future.
Although the U.S. credit rating has been downgraded, the country’s long-term domestic and foreign credit ceilings remain at AAA. However, Moody’s has revised the overall credit rating for the U.S. down from AAA to Aa1.
One noteworthy detail is that since April 21, the index has seen only one negative trading day—May 9, which experienced only a slight decline. Falling Treasury yields have reduced some market risks, while Donald Trump’s trip to the Middle East has also helped ease political tensions at home. The market clearly reflects growing investor appetite for risk, though the possibility of a correction at these levels remains real.
Looking ahead to this week, traders will closely monitor preliminary purchasing managers’ index (PMI) data for May on Thursday. They will also pay attention to speeches from several Federal Reserve officials to gauge whether the Fed remains focused on economic growth or has shifted more attention to inflation, especially in light of recent U.S.-China trade agreements.
A rise in PMI figures may suggest that business sentiment has improved since tensions eased between the U.S. and China, but investors are also eager for clear guidance on the Fed’s next policy steps. Key speakers include John Williams (New York Fed), Raphael Bostic (Atlanta Fed), Lorie Logan (Dallas Fed), and Mary Daly (San Francisco Fed). If these officials continue to express concerns about elevated inflation risks, the U.S. dollar could continue to strengthen, as markets may price in fewer rate cuts ahead.
As for the equity markets, their reaction remains uncertain. Recently, equities have risen even as expectations for rate cuts have diminished—primarily due to a reduced fear of recession following tariff adjustments. However, with recession fears now less pronounced and a growing narrative around sustained higher rates due to sticky inflation, Wall Street may pull back if Fed officials emphasize upside inflation risks.
In related news, President Donald Trump harshly criticized Walmart’s pricing strategy, stating that the company should absorb the cost of tariffs rather than passing them onto consumers. In a public statement, Trump pointed out that Walmart made billions in profit last year and argued that American shoppers should not bear the burden of higher prices caused by trade tariffs.
Trump also implicated China in the issue, stating that either Walmart or China should take responsibility for these added costs. He warned that both he and consumers are closely watching how Walmart handles the situation.

NASDAQ Trade Setup: Bullish Bias, But Waiting for Retrace!✅ NASDAQ Breakdown: Waiting for the Retrace 🎯
I'm currently watching the NASDAQ 🧠, and here's what I'm seeing across multiple timeframes:
📈 Daily & 4H Timeframes show a strong bullish rally with significant momentum. However, in my view, price is overextended and currently trading at a premium.
📉 Although my bias remains bullish, I'm anticipating a retracement into equilibrium—specifically around the 50% to 61.8% Fibonacci zone 🔁. This would offer a more favorable entry based on value.
📊 In this video, I walk you through:
- The overall trend direction
- Where and how we can anticipate a break of market structure for a clean entry
- Why my buy idea is conditional on the 30-minute chart trending down, then flipping bullish via a structure break 🔄
⚠️ Patience is key! The trade setup may play out at various price levels—wait for confirmation from price action, as detailed in the video 🎥.

2025.05.19 nasdaq analysis🟧
At the close of Friday's session, the daily and weekly candle closed around 21500.
However, in the final hour after market close, Nasdaq broke below the orange trendline.
Then, at the start of Monday’s session, a sharp gap down occurred.
The gap was briefly filled before Nasdaq retested the broken trendline and continued to fall.
🔗
🕒
Nasdaq hasn't confirmed a downtrend yet.
The key is whether 21187, which has held since May 13th, will break.
If it fails, price may fall below the value area it’s held for a week.
Downside targets if 21187 breaks: 21000, 20765.
🔗
🟩
Bullish scenario isn’t dead—this may be a temporary pullback.
Key entry signal: Break above the 15-min 20 EMA.
Target zones vary by strength:
Conservative TP: 30-min 20 EMA
Aggressive TP: 21415, possibly even 21500 if today’s high is broken
🔗
📌 Conclusion
Monday started with a gap down, but support is still holding.
Break below 21187 = potential trend reversal + end of box-range movement.
Buy trades should be cautious & short-term until confirmation of strength.

Nasdaq – Fair Value Gap (FVG) in Play: Breakout or Rejection?US100 is going up and reaching a critical inflection point, the Daily Fair Value Gap (FVG) between 21,500 and 21,700.
This FVG is not just any level; it’s the last inefficiency left by aggressive sellers, and the market is now deciding whether to reclaim or reject it.
Key Zones
- Daily FVG (Supply): 21,400 – 21,600
- Major Resistance: 22,400
Trade Scenarios
Bullish Continuation
A clean daily close above 21,600 confirms FVG reclamation.
Could trigger a momentum burst toward 22,250.
Ideal play: wait for consolidation above 21,700 or breakout-retest setup.
Bearish Rejection
Rejection from the FVG could lead to a retracement toward 20,300, where demand and a lower imbalance reside.
Look for rejection in the FVG zone.
Technical Takeaways
The FVG at 21,400–21,600 is acting as both a magnet and a battlefield expect volatility.
The impulsive move leading here lacks a clear retest, which may increase the probability of a short-term correction.
Momentum is strong, but traders should wait for confirmation not emotion.
Summary
The Nasdaq 100 is knocking on a daily FVG door and what happens next will set the tone for the coming weeks.
Above 21,600 = bull trend continuation
Rejection = short-term dip to 20,300 possible
What's your take, breakout or rejection?
Follow for real-time trade updates and educational charts.

REGN Technical Analysis: Potential Bullish SetupREGN is currently at a strong weekly support level, having formed a double bottom with a clear bullish divergence on the daily chart. The price has also closed above a downward trendline, signaling a potential shift in momentum. While the price might be slightly resistant in the 668 - 686 zone, a strong close above this area could lead to further upside.
Trading Recommendations:
Entry Point (CMP): 594
Stop-Loss: Closing below 520
Take Profit 1: 686
Take Profit 2: Open
Beyond the initial target, other potential targets include 740. After that, the price could look to fill a gap at 914, and potentially even hit 1200 as there appears to be no major resistance before that level.
Happy trading!

Gold - New ATH in the making?Overall Market Context
This daily timeframe chart of Gold (XAU/USD) reflects a textbook example of a bullish retracement within a broader upward trend. The price has recently pulled back after printing a significant swing high, which is currently the all-time high (ATH). This retracement brings Gold into a high-probability reversal zone, aligning several technical elements that point toward potential bullish continuation.
Retracement Into A Confluence Zone
Price has retraced into a key technical area defined by the Fibonacci golden pocket (0.618–0.65) and a Fair Value Gap (FVG). The golden pocket is widely regarded as one of the most reactive retracement levels in Fibonacci analysis, where institutional participants often enter or scale into positions. The addition of an FVG overlapping this zone strengthens its importance. An FVG is typically created by an aggressive move that leaves behind inefficient price action or unmitigated imbalances, and in this case, it represents an area where demand previously overwhelmed supply.
The combination of the golden pocket and FVG creates a strong demand zone, from which a bullish reaction is expected if the overall macro sentiment remains supportive.
Bullish Reaction And Confirmation
Price wicked slightly below the FVG, likely triggering liquidity stops resting beneath prior swing lows before showing signs of a strong bounce. This type of price action—known as a liquidity grab or "spring"—is often a precursor to significant reversals when it aligns with higher timeframe bullish order flow.
The current bounce from this zone suggests that smart money may have accumulated long positions here. If price continues to hold above this zone, it confirms a successful defense of this key area and increases the probability of bullish continuation. The market is showing signs of shifting from a retracement phase back into an impulsive phase.
Break Of Structure And Targeting Buy-Side Liquidity
The next key area of interest is the buy-side liquidity resting above the most recent swing high, labeled as the "BSL" (Buy-Side Liquidity). If price breaches this level, it will confirm a break of market structure to the upside and signal a continuation of the overall bullish trend.
Such a break would invalidate the idea of deeper retracement and instead align with an impulsive leg that could target the previous ATH—and potentially exceed it. This makes the current zone a critical pivot point in determining whether gold resumes its long-term bullish trajectory.
New All-Time High Scenario
Should the BSL be breached and momentum maintained, price is likely to head toward printing a new all-time high. From a psychological and technical standpoint, the break of an ATH often leads to price discovery, where resistance is minimal, and price action becomes more volatile and parabolic.
Traders and institutions monitoring historical highs often front-run such moves or aggressively participate once confirmed, driving increased volume and volatility. This behavior can lead to rapid upside extension, especially when supported by macroeconomic narratives such as inflation hedging, geopolitical tensions, or declining real yields—all traditionally bullish catalysts for gold.

2025.05.16 nasdaq analysis
This is the briefing result for Nasdaq as of yesterday.
The briefing began during the yellow box phase.
At that time, I clearly mentioned that the market had entered a short-term correction phase and emphasized the importance of the 21187 support level marked by the red box.
As seen in the chart, the 21187 level was not broken to the downside and instead held as support, followed by a rebound.
This reaffirms the significance of the 21187 level.
Afterward, the trend continued upward.
Looking at the 15-minute chart, there have been consistent lower wicks breaking below support,
which decreases the reliability of a short opportunity simply from a trendline break.
At this point, the trust in a sell-off purely based on trendline breakdown is weakening.
This chart outlines a short-term sell strategy.
As previously mentioned, while the short-term uptrend line has become less reliable,
if we see a break of the trendline and a drop below 21376,
we could expect a pullback toward the blue box area around 21320~21300.
Thus, a short-term short strategy may be valid in this scenario.
From a daily chart perspective, Nasdaq closed with a green candle again,
but the shape of the candle resembles a doji with similar upper and lower wicks.
What we need to focus on here is that Nasdaq has re-entered a high-volume price area (supply zone),
but since no clear direction has formed, many positions seem to be closed off whenever the price pushes higher.
On the downside, since the 21187 support level has held,
this remains the most critical level.
If 21187 is broken downward, it could mark the beginning of a daily-level correction phase.
Conclusion:
No clear direction yet.
While the direction was upward until yesterday, the doji close suggests caution.
For further bullish movement, a confirmed close above the current supply zone is essential.
If the market corrects downward, watch for a break below 21187.
The current price action is forming a channel pattern with higher lows and higher highs.
If traded correctly within this range, good opportunities may arise.

2025-05-15 - priceactiontds - daily update - nasdaqGood Evening and I hope you are well.
comment: Market is in peak euphoria again but you would be buying at the very top on an Opex Friday. Like… Just dont. Enjoy your weekend. I expect a rather choppy session maybe even a deep pullback rather than closing the week on another green bar.
current market cycle: trading range
key levels: 20600 - 22000
bull case: Bulls want a new ath and we are high enough, that they could easily get it next week. My count was likely wrong and W1 was not the spike from 16735 to 19388 but rather the leg from 17863 to 20277. That means we are in W3 and W4 is around the corner. I have many calculated targets around 23000 and as of now, there is no reason we can not get there. It’s a very tight bull channel upwards. Bears are not doing anything so the path of least resistance is up.
Invalidation is below 20100.
bear case: Bears need a miracle. That’s it. Best they can maybe get is a pullback to the bull trend line around 20700ish but I highly doubt that. If we print 21000 tomorrow, most bears would be wet and take their profits before letting them see burning away again. My assumption for tomorrow is a choppy session somewhere between 21000 - 21600.
Invalidation is above 21600.
short term: Neutral. Opex Friday, I made my money this week. Absolutely no need to throw it away tomorrow. Less interest in buying up here but bears are barely making money, so I’d rather sit on hands.
medium-long term - Update from 2024-04-20: My most bearish target for 2025 was 17500ish, given in my year-end special. We are +18% from the lows and I do think, once this turns again, it will easily be the short trade of the year.
trade of the day: Longing the lower low below 21300 is the obvious choice. Market went sideways to up with higher lows for 4h. There were at least 4 big tails on the 15m chart which told the story.

US30 | 15M | BUY ZONEHey There,
After reaching my US30 buy level, my target is 42,481,00
Your likes keep me motivated to share my analyses, and I truly appreciate the support.
Big thanks to everyone showing love

NASDAQ Potential Bullish Reversal OpportunityNASDAQ price action went through a massive correction during the global tariff war.
However after potential recent developments, we may finally see a direction towards the resolution of widespread tariff based uncertainty across the macro economic landscape.
This presents us with a potential Reversal opportunity if we see the formation of a credible Higher High (given a potential proper break out) on the Daily and shorter timeframes.
Trade Plan :
Entry @ 20440
Stop Loss @ 19500
TP 1 @ 21380

BTC - ATH Incoming?current market structure
this 1-hour chart of btcusdt presents a sophisticated transition from accumulation to a potential breakout structure, with well-defined fair value gaps (fvgs) and a clear instance of manipulation followed by rapid recovery. the market appears to be attempting to regain bullish momentum following a liquidity sweep and subsequent internal shift in structure.
accumulation within an ascending channel
price action developed within an ascending channel, marked by higher highs and higher lows over time. this is a classic representation of controlled bullish accumulation. the tight, stair-stepping movement reflects steady institutional positioning, building long exposure while keeping volatility contained. this phase shows multiple rejections of the lower trendline, confirming consistent demand.
manipulation into fvg
the breakdown beneath the channel coincides with a sharp move into a large fvg (highlighted in light blue). this aggressive wick likely triggered stop-losses of retail longs, constituting a liquidity grab or manipulation event. such actions are typical after extended consolidations, flushing out weak hands to enable large players to enter at a discount. the reaction from this zone confirms its significance, as buyers immediately stepped in and reclaimed lost ground.
recovery and shift in momentum
after manipulation, the market found support in the fvg zone and launched a sharp bullish move. the rapid recovery illustrates strong underlying demand. the price re-entered a smaller fvg (labelled “resistance in this fvg”), briefly faced selling pressure, and then decisively broke through it. this reclaim of supply zones is often a powerful signal that bullish momentum is back in control.
bullish inversion fair value gap (ifvg)
price is now challenging a smaller bullish internal fair value gap (ifvg), marked in red. this zone, which once acted as a resistance layer, has now become a pivot point. successful hold or breakout above this region would likely trigger continuation, with market participants targeting previous swing highs or beyond.
break of structure and bullish continuation
a key development here is the break above the previous swing high or "bsL" (buy-side liquidity). this signifies a structural shift—no longer just recovering, the market is actively seeking higher liquidity. such breaks often catalyze rapid directional movement, especially when they occur after liquidity has been swept from the opposite side.
distribution and potential for new all-time high
the green projection suggests the possibility of further bullish expansion toward a distribution zone. if current momentum continues and no major supply zones disrupt the advance, the market could be on its way to challenge or set new all-time highs (ath). the label “on the way to new ath?” reflects this open-path scenario, contingent on continuation above 105,600–106,000 levels.
market psychology
this chart reveals a narrative of engineered manipulation followed by strength confirmation. institutions manipulated price below support to shake out retail traders, then absorbed that liquidity and pushed price higher. once resistance was reclaimed, confidence returned, inviting both short cover and fresh long entries. such sequences reinforce the importance of waiting for price reactions at key levels rather than acting on the first impulse.
summary
btc has exited an accumulation phase within a rising channel, experienced a strategic liquidity sweep into a deep fvg, and then quickly reversed. the current positioning above multiple reclaimed fvgs and just beneath a structural break confirms a bullish outlook. if price holds above the current bullish ifvg, the pathway to distribution and possibly new highs remains open. strategic traders may now focus on confirming pullbacks into these reclaimed zones for continuation setups.
