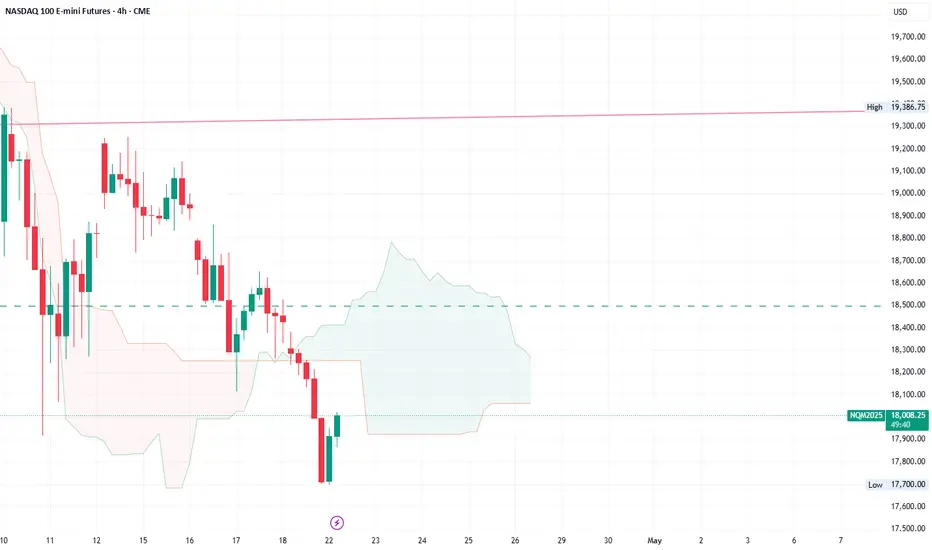
MNQ!/NQ1! Day Trade Plan for 04/22/2025MNQ!/NQ1! Day Trade Plan for 04/22/2025
📈18210 18365
📉17910 17760
Thanks to all my followers! Truly appreciate the support!
Please like and share for more NQ levels Tues & Thurs 🤓📈📉🎯💰
*These levels are derived from comprehensive backtesting and research and a quantitative system demonstrating high accuracy. This statistical foundation suggests that price movements are likely to exceed initial estimates.*
Nasdaq

Quick technical piece on Nasdaq100From the technical side, we are near the short-term downside resistance line, which if broken, may open the door towards higher areas. But will it be enough?
Let's take a look.
MARKETSCOM:US100
Let us know what you think in the comments below.
Thank you.
77.3% of retail investor accounts lose money when trading CFDs with this provider. You should consider whether you understand how CFDs work and whether you can afford to take the high risk of losing your money. Past performance is not necessarily indicative of future results. The value of investments may fall as well as rise and the investor may not get back the amount initially invested. This content is not intended for nor applicable to residents of the UK. Cryptocurrency CFDs and spread bets are restricted in the UK for all retail clients.

US30 | 1H | BUYHey There;
SIGNAL ALERT
BUY US30 / 38,689,19
🟢TP1: 39,258,56
🟢TP2: 39,910,75
🟢TP3: 41,287,59
🔴SL: 37,415,50
RR / 2,00
Please don't forget to like 🙏🏻
Thanks to everyone who supports my analysis with likes. 💙💙💙

NAS100 | 1H | BUY ZONEHey There;
SIGNAL ALERT
BUY NAS100 / 17,682,18
🟢TP1: 18,000,00
🟢TP2: 18,500,00
🟢TP3: 19,726,64
🔴SL: 16,782,61
RR / 2,2
Please don't forget to like 🙏🏻
Thanks to everyone who supports my analysis with likes. 💙💙💙

Nasdaq market analysis: 23-APRIL-2025Good morning Dear Traders! Join me for Nasdaq market analysis for today. Share your charts, ask questions, and let's discuss trading strategies.

Barclays Raises TechnipFMC (FTI) Price Target to $43TechnipFMC (NYSE: NYSE:FTI ) closed at $31.23 on the previous trading day, staying close to its one-year high of $33.45. Evercore ISI analyst Jason Bandel maintained a Buy rating on the stock, setting a price target of $39. Meanwhile, Barclays reaffirmed its Buy rating with a higher target of $43 in a report dated March 26.
Currently, the consensus among Wall Street analysts rates TechnipFMC as a “Strong Buy.” The average price target stands at $37.22, suggesting an upside of 19.18% from current levels. The stock has an average daily trading volume of 4.33 million shares. TechnipFMC’s performance is under close watch, though analyst Jason Bandel has posted a -5.4% average return with a 31.58% success rate. He follows the energy sector, covering companies like Helmerich & Payne and NOV in addition to FTI.
Insider activity on the stock shows negative sentiment. Over the past quarter, 55 corporate insiders have sold shares. Earlier this month, Director Eleazar de Carvalho Filho sold 9,381 shares worth $279,178.56.
Technical Analysis
The stock recently bounced off a key support zone around $22, close to the 200-day moving average at $21.86. This bounce formed a bullish reversal setup. The price is now hovering near $25.20. If it holds this area, the next resistance is around the $28.00 level, followed by a possible move back toward its recent high of $33.45.
The volume profile shows increased buying near the bottom of the bounce, suggesting accumulation. RSI is around 42, indicating neutral momentum but potential for recovery if buying pressure continues. A break above $28 may signal continuation toward $33.45.

Nasdaq-100 H4 | Potential bearish reversalThe Nasdaq-100 (NAS100) could rise towards an overlap resistance and potentially reverse off this level to drop lower.
Sell entry is at 18,144.20 which is an overlap resistance.
Stop loss is at 18,800.00 which is a level that sits above an overlap resistance.
Take profit is at 16,779.34 which is a swing-low support.
High Risk Investment Warning
Trading Forex/CFDs on margin carries a high level of risk and may not be suitable for all investors. Leverage can work against you.
Stratos Markets Limited (tradu.com):
CFDs are complex instruments and come with a high risk of losing money rapidly due to leverage. 63% of retail investor accounts lose money when trading CFDs with this provider. You should consider whether you understand how CFDs work and whether you can afford to take the high risk of losing your money.
Stratos Europe Ltd (tradu.com):
CFDs are complex instruments and come with a high risk of losing money rapidly due to leverage. 63% of retail investor accounts lose money when trading CFDs with this provider. You should consider whether you understand how CFDs work and whether you can afford to take the high risk of losing your money.
Stratos Global LLC (tradu.com):
Losses can exceed deposits.
Please be advised that the information presented on TradingView is provided to Tradu (‘Company’, ‘we’) by a third-party provider (‘TFA Global Pte Ltd’). Please be reminded that you are solely responsible for the trading decisions on your account. There is a very high degree of risk involved in trading. Any information and/or content is intended entirely for research, educational and informational purposes only and does not constitute investment or consultation advice or investment strategy. The information is not tailored to the investment needs of any specific person and therefore does not involve a consideration of any of the investment objectives, financial situation or needs of any viewer that may receive it. Kindly also note that past performance is not a reliable indicator of future results. Actual results may differ materially from those anticipated in forward-looking or past performance statements. We assume no liability as to the accuracy or completeness of any of the information and/or content provided herein and the Company cannot be held responsible for any omission, mistake nor for any loss or damage including without limitation to any loss of profit which may arise from reliance on any information supplied by TFA Global Pte Ltd.
The speaker(s) is neither an employee, agent nor representative of Tradu and is therefore acting independently. The opinions given are their own, constitute general market commentary, and do not constitute the opinion or advice of Tradu or any form of personal or investment advice. Tradu neither endorses nor guarantees offerings of third-party speakers, nor is Tradu responsible for the content, veracity or opinions of third-party speakers, presenters or participants.

What Is the McClellan Oscillator (NYMO), and How to Use ItWhat Is the McClellan Oscillator (NYMO), and How to Use It in Trading?
The McClellan Oscillator is a widely used market breadth indicator that helps traders analyse momentum and market strength. It focuses on the relationship between advancing and declining stocks, offering unique insights beyond price movements. This article explains how the McClellan Oscillator works, its interpretation, and how it compares to other tools.
What Is the McClellan Oscillator?
The McClellan Oscillator is a market breadth indicator that traders use to measure momentum in stock market indices. It’s calculated based on the Advance/Decline Line, which tracks the net number of advancing stocks (those rising in price) minus declining stocks (those falling in price) over a given period.
The NYSE McClellan Oscillator is the most common variant, often called the NYMO indicator. However, it can also be applied to any other stock index, like the Dow Jones, Nasdaq, or FTSE 100.
Here’s how it works: the indicator uses two exponential moving averages (EMAs) of the advance/decline data—a 19-day EMA for short-term trends and a 39-day EMA for long-term trends. The difference between these two EMAs gives you the oscillator’s value. Positive readings mean more stocks are advancing than declining, pointing to bullish momentum. Negative readings suggest the opposite, with bearish sentiment dominating.
What makes the McClellan indicator particularly useful is its ability to highlight shifts in market momentum that might not be obvious from price movements alone. For example, even if a stock index is rising, a declining indicator could signal that fewer stocks are participating in the rally—a potential warning of weakening breadth.
This indicator is versatile and works well across various timeframes, but it’s particularly popular for analysing daily or weekly market trends. While it’s not designed to provide direct buy or sell signals, it helps traders identify when markets are gaining or losing momentum,
Understanding the Advance/Decline Line
The Advance/Decline (A/D) Line is a market breadth indicator that tracks the difference between the number of advancing stocks and declining stocks. It’s calculated cumulatively, adding each day’s net result to the previous total. This gives a running tally that reflects the broader participation of stocks in a market’s movement, rather than just focusing on a handful of large-cap stocks.
When the A/D Line shows consistent strength or weakness, the McClellan Oscillator amplifies this data, making it potentially easier to spot underlying trends in market breadth. In essence, the A/D Line provides the raw data, while the McClellan refines it into actionable insights.
How to Calculate the McClellan Oscillator
The McClellan Oscillator formula effectively smooths out the daily fluctuations in the A/D data, allowing traders to focus on broader shifts in momentum.
Here’s how it’s calculated:
- Calculate the 19-day EMA of the A/D line (short-term trend).
- Calculate the 39-day EMA of the A/D line (long-term trend).
- Subtract the 39-day EMA from the 19-day EMA. The result is the McClellan Oscillator’s value.
Giving the formula:
- McClellan Oscillator = 19-day EMA of A/D - 39-day EMA of A/D
The result is a line that fluctuates around a midpoint. In practice, a trader might apply the McClellan Oscillator to the S&P 500 on a daily or weekly timeframe, providing insights for trading.
Interpretation of the Oscillator’s Values
- Positive values occur when the 19-day EMA is above the 39-day EMA, indicating that advancing stocks dominate and the market has bullish momentum.
- Negative values occur when the 19-day EMA is below the 39-day EMA, reflecting a bearish trend with declining stocks in control.
- A value near zero suggests balance, where advancing and declining stocks are roughly equal.
Signals Generated
The indicator is popular for identifying shifts in momentum and potential trend changes.
Overbought and Oversold Conditions
- Readings at or above +100 typically indicate an overbought market, where the upward momentum may be overextended.
- Readings at or below -100 suggest an oversold market, with the potential for a recovery.
Crossing Zero
When the indicator crosses above or below zero, it can indicate shifts in market sentiment, with traders often monitoring these transitions closely.
Divergences
- A positive divergence occurs when the indicator rises while the index declines, signalling potential bullish momentum building.
- A negative divergence happens when the indicator falls while the index rises, hinting at weakening momentum.
Using the McClellan Oscillator With Other Indicators
The McClellan Oscillator is a valuable tool for analysing market breadth, but its insights become even more powerful when combined with other indicators. Pairing it with complementary tools can help traders confirm signals, refine their analysis, and better understand overall market conditions.
Relative Strength Index (RSI)
The Relative Strength Index (RSI) measures the strength and speed of price movements, identifying overbought or oversold conditions. While the McClellan Oscillator focuses on market breadth, using RSI along with it can provide confirmation. For example, if both indicators show overbought conditions, it strengthens the case for a potential market pullback.
Moving Averages
Simple or exponential moving averages of price data can help confirm trends identified by the McClellan Oscillator. For instance, if it signals bullish momentum and the index moves above its moving average, this alignment may suggest stronger market conditions.
Volume Indicators (e.g., On-Balance Volume)
Volume is a key component of market analysis. Combining the Oscillator with volume-based indicators can clarify whether breadth signals are supported by strong participation, improving the reliability of momentum shifts.
Bollinger Bands
Bollinger Bands measure volatility and provide insight into price ranges. When combined with the McClellan Oscillator, they can help traders assess whether market breadth signals align with overextended price movements, providing additional context.
VIX (Volatility Index)
The VIX measures market sentiment and fear. Cross-referencing it with the McClellan Oscillator can reveal whether market breadth momentum aligns with changes in risk appetite, offering a deeper understanding of sentiment shifts.
Comparing the McClellan Oscillator With Related Indicators
The McClellan Oscillator, McClellan Summation Index, and Advance/Decline Ratio all provide insights into market breadth, but they differ in focus and application.
McClellan Oscillator vs McClellan Summation Index
While the Oscillator measures short-term momentum using the difference between 19-day and 39-day EMAs of the Advance/Decline (A/D) Line, the McClellan Summation Index takes a longer-term perspective. It is a cumulative total of the Oscillator's daily values, creating a broader view of market trends.
Think of the Summation Index as the "big picture" complement to the Oscillator's granular analysis. Traders often use the Summation Index to track longer-term trends and identify major turning points, while the Oscillator is more popular when monitoring immediate momentum shifts and overbought/oversold conditions.
McClellan Oscillator vs Advance/Decline Ratio
The Advance/Decline Ratio is a simpler calculation, dividing the number of advancing stocks by the number of declining stocks. While it provides a snapshot of market breadth, it lacks the depth of analysis offered by the McClellan Oscillator.
The Oscillator refines raw A/D data with exponential moving averages, smoothing out noise and making it potentially easier to identify meaningful trends and divergences. The A/D Ratio, on the other hand, is more reactive and generally better suited for short-term intraday signals.
Advantages and Limitations of the McClellan Oscillator
The McClellan Oscillator is a powerful tool for analysing market breadth, but like any indicator, it has strengths and weaknesses. Understanding both can help traders decide how best to integrate it into their analysis.
Advantages
- Focus on Market Breadth: By analysing the Advance/Decline data, the indicator provides a clearer picture of how many stocks are participating in a trend, not just the performance of index heavyweights.
- Momentum Insights: Its ability to highlight shifts in short-term momentum allows traders to spot potential turning points before they become evident in price action.
- Identification of Divergences: It excels at identifying divergences between market breadth and price, offering early signals of weakening trends or upcoming reversals.
- Overbought/Oversold Signals: Its range helps traders analyse extreme conditions (+100/-100), which can signal potential market corrections or recoveries.
Limitations
- Not a Standalone Tool: The indicator is combined with other indicators or broader analysis, as it doesn’t provide specific entry or exit signals.
- False Signals in Volatile Markets: During periods of high volatility or low trading volume, the oscillator may generate misleading signals, making context crucial.
- Short-Term Focus: While excellent for momentum analysis, it doesn’t provide the long-term perspective offered by tools like the McClellan Summation Index.
The Bottom Line
The McClellan Oscillator is a powerful tool for analysing market breadth, helping traders gain insights into momentum and potential market shifts. While not a standalone solution, it is often combined with other indicators for a well-rounded approach.
FAQ
What Is a NYMO Oscillator?
The NYMO oscillator, short for the New York McClellan Oscillator, is a market breadth indicator based on the Advance/Decline stock data of the New York Stock Exchange (NYSE). The NYMO index calculates the difference between a 19-day and 39-day exponential moving average (EMA) of the Advance/Decline line, providing insights into stock market momentum and sentiment.
What Does the McClellan Oscillator Show?
The McClellan Oscillator shows the balance of advancing and declining stocks in a market. Positive values indicate bullish momentum, while negative values reflect bearish sentiment. It’s often used to identify potential shifts in momentum or divergences between market breadth and price.
What Is the McClellan Oscillator in MACD?
The McClellan Oscillator and MACD are distinct indicators, but both use moving averages. While MACD measures price momentum, the Oscillator focuses on market breadth by analysing the Advance/Decline Line.
What Is the McClellan Summation Indicator?
The McClellan Summation Index is a cumulative version of the McClellan Oscillator. It provides a broader view of market trends, tracking long-term momentum and overall market strength.
What Is the Nasdaq McClellan Oscillator?
The Nasdaq McClellan Oscillator, sometimes called the NAMO, applies the same calculation as the NYMO but uses Advance/Decline data from the Nasdaq exchange. It helps traders analyse momentum and breadth in technology-heavy markets.
This article represents the opinion of the Companies operating under the FXOpen brand only. It is not to be construed as an offer, solicitation, or recommendation with respect to products and services provided by the Companies operating under the FXOpen brand, nor is it to be considered financial advice.

Nasdaq (NQ1!) Weekly Chart Analysis – What’s Next? (Week 16)📌 Title:
NASDAQ – 18,000 Holding, But Downside Risk Remains
Review of Last week's outlook:
I said that buying between 18,600 and 18,700 on the 12-hour chart would be reasonable,
but if a 12-hour candle closed below 18,500, it would be a major warning signal.
That strategy was valid at least until Tuesday.
But then three more 12-hour candles formed,
and Tuesday's closing price was 18,938.
The market opened Wednesday with a gap down at 18,790.
Looking at the chart at that time,
price had dropped below the 200-day line on the 2-day chart,
and the 12-hour chart was also not looking good.
So the strategy of buying near 18,600 on the 12-hour chart was no longer valid.
I had mentioned that if a 12-hour candle closed below 18,500,
it could get very dangerous.
And on the 4-hour chart, I had suggested short-term scalping was possible in the low 18,000s.
As expected, there was one bounce from that level,
but the price continued to fall after that.
📋 Description:
Now, NASDAQ is currently hovering near 18,000.
Although volatility remains low, price action continues to drift lower with weak momentum on higher timeframes.
Key Technical Observations:
• 📉 Still inside the 5-day bullish Ichimoku cloud
• 📍 17,000 = Bottom of the Bi-weekly Kumo + 3D 200SMA
• 📍 16,500 = Previous swing low, potential double bottom area
• 📈 18,400 = Needs to be reclaimed by weekly close to consider range recovery
A clean break below 17,700 could open the path toward 17,000, and possibly lower.
For now, this is a watch-and-react zone not yet a clear buy or sell signal, but conditions are forming for the next move.
🔁 Bias: Neutral to Bearish
⏳ Strategy: Wait for confirmation at 17,700 or breakdown
$QQQ - Headed for the Next Leg DownNASDAQ:QQQ - Headed for the Next Leg Down
Bearish Wedge broke down today!
Measured Move: $377.15
Measured Timeframe: 06May
Below my H5_D Indicator and the Wr% is in motion down to the Green Barrier.
All signs are pointing LOWER!
Not Financial Advice

NASDAQ Decision making becomes easy after seeing this chart.NASDAQ (NDX) is currently on the 3rd straight red month (1M candle), following the February High and subsequent sell-off due to the Trade War. This has been analyzed extensively in previous analyses and how the fundamental scene is only now starting to show some positive progress but still has a long way to go.
Technically though, the picture is very clear and favors long-term investing. The market has been trading within a Fibonacci Channel Up since the U.S. Housing Crisis in 2008 and along with the 2022 Inflation Crisis, those have been the only real Bear Cycle events in the past 18 years.
In between those there have been another 5 shorter term corrections, that offered great buying opportunities for the long-term and the recent 3-month one classifies as one.
There reasons are three. First it has come very close to the 1M MA50 (blue trend-line), which only broke during the Major Corrections. Second, the 1M RSI hit the 50.50 Symmetrical Support, which has held during all those 5 prior Minor Corrections. Third, those corrections only range between two Fibonacci levels.
The current correction fulfills all those conditions. And since the 'weakest' rally we've have on this 5 event sample has been +37.57% and the strongest +96.77%, we have a medium-term Target on Nasdaq at 22800 and a long-term one at 32500.
Do you still reserve doubts at investing long-term after seeing this macro chart?
-------------------------------------------------------------------------------
** Please LIKE 👍, FOLLOW ✅, SHARE 🙌 and COMMENT ✍ if you enjoy this idea! Also share your ideas and charts in the comments section below! This is best way to keep it relevant, support us, keep the content here free and allow the idea to reach as many people as possible. **
-------------------------------------------------------------------------------
💸💸💸💸💸💸
👇 👇 👇 👇 👇 👇

MNQ Outlook 4-21-25Toying around with posting publicly welcome back folks.
MNQ still is yet to pick a direction following the big run on wednesday 2 weeks ago. long term I think path of least resistance is for price to continue to chase sellside liquidity. However that high that was put in on that wednesday may be cleared out first.
In any case my trade bias is always day by day and what is offered to me during my trading window.
Please note this is not investment advice.

NQ KEY LEVELS - 21st APRIL 2025Key levels marked by using low volume nodes for potential key levels where we may see price react.

NAS100 - Will the stock market go bullish?!The index is trading below the EMA200 and EMA50 on the four-hour timeframe and is trading in its descending channel. If the index moves down towards the specified demand zone, one can look for the next Nasdaq long positions with a good risk-reward ratio.
Economists remain divided over whether President Donald Trump’s tariff policies are weakening the economy enough to trigger a recession. Some believe the possibility of a recession is significant, citing the rising costs of tariffs that are burdening both businesses and consumers. Others argue that the U.S. economy is strong enough to weather the trade war without falling into recession, pointing to resilient employment levels and consumer spending.
Forecasting experts also express differing views regarding the risk that Trump’s tariff campaign could tip the economy into a downturn. A Wall Street Journal survey conducted in April among 57 economists revealed that, on average, participants estimated a 45% chance of a recession occurring within the next 12 months—up from just 20% in the January survey.
The economic outlook took a notable downturn in February, when Trump began announcing tariffs against key U.S. trading partners. Many forecasters, who had expected a “soft landing” from post-pandemic inflation, are now preparing for a possible recession, as these tariffs and other economic barriers are forcing both households and businesses to tighten spending.
A separate survey of financial professionals working with businesses found that many companies have recently faced greater difficulty in collecting payments from clients, indicating growing financial strain among key economic players. The Credit Managers’ Index, overseen by the National Association of Credit Management and monitored by economist Chris Kuehl, still showed growth in March, though at a slower pace than before.
On the more optimistic side is Allen Sinai from Decision Economics, who assigns only a 20% probability to a recession within the next year. Although this is an increase from his January estimate of 10%, he still considers it an unlikely scenario.
Sinai’s primary reason for optimism is the strength of the labor market, which has remained stable since recovering from the massive layoffs during the COVID-19 lockdowns. March’s unemployment rate was 4.2%—close to historic lows—and not indicative of an economy in recession.
One major point of disagreement between recession pessimists and optimists lies in the interpretation of consumer sentiment data. Surveys have shown that people are increasingly worried about inflation, the job market, and their personal finances. If such concerns lead to more cautious consumer spending, it could weigh heavily on the overall economy.
The upcoming week is expected to begin quietly in terms of economic data releases, particularly due to global markets being closed on Monday in observance of Easter. However, midweek brings key reports that could significantly influence market expectations. On Wednesday, the preliminary S&P Global composite purchasing managers’ index for April and March new home sales figures are due. Thursday will feature a packed slate of indicators, including durable goods orders, jobless claims, existing home sales, and the final reading of the University of Michigan’s consumer sentiment index.
Alongside the data releases, investors will closely monitor remarks from Federal Reserve officials. Following Jerome Powell’s firm stance last week, upcoming speeches by Kashkari, Goolsbee, and Harker could shape or reinforce market expectations regarding the Fed’s future policy path.
Meanwhile, Apple is grappling with mounting challenges in the global marketplace. In China, the company has lost a significant portion of its market share, with sales declining by 9%, while Huawei’s sales have grown by 10%, and Xiaomi now holds the top spot with an 18.6% market share. These shifts reflect a notable pivot in Chinese consumer preferences toward domestic brands. Furthermore, U.S.-imposed tariffs on Chinese goods have put additional pressure on Apple’s profit margins in its home market, placing the company in a tough position.

NAS100 Testing Lows: Will a Bounce Offer a Sell Opportunity?NAS100 Technical & Fundamental Analysis 🧐
Overall Sentiment: The current market sentiment surrounding tech stocks and the broader indices like the NASDAQ 100 appears cautious, leaning bearish. Factors like persistent inflation concerns, uncertainty around the Federal Reserve's future interest rate path 🏦, and ongoing geopolitical tensions can weigh heavily on growth-sensitive assets like tech stocks. Keep an eye on upcoming economic data releases (CPI, PPI, FOMC minutes) as they could significantly sway sentiment.
1. Daily Timeframe (D1): The Bigger Picture 🗺️
The NAS100 is exhibiting clear bearish characteristics on the daily chart, forming lower highs and lower lows.
Price is currently approaching or testing a significant area of previous daily equal lows. This is a critical zone ⚠️. Why? Because significant buy-side liquidity often rests below such lows (in the form of stop-loss orders from long positions) and sell-side orders may trigger if these levels break decisively.
A strong break and close below these daily lows could signal a continuation of the major downtrend, potentially accelerating selling pressure. Conversely, this area could act as temporary support, prompting the pullback you're anticipating.
2. 4-Hour Timeframe (H4): The Setup Structure 🏗️
My H4 chart clearly illustrates the recent sharp decline. Price is currently testing the support zone highlighted (around 17,800 - 18,000), which corresponds to the 0.00% Fibonacci level (17,973.8) drawn from the recent swing high (~19,117.4).
This support zone aligns with the concept of hitting the daily lows/liquidity area.
Anticipated Scenario:
I am expecting a reaction (a bounce/pullback) from this current zone. The projected path suggests a retracement towards the 50% Fibonacci level (Equilibrium) at approximately 18,547.3. This level often acts as significant resistance after a strong impulse move. The 61.8% level (~18,682.6) is also a key area to watch just above it.
Point of Interest (POI):
The zone between the 50% and 61.8% Fib levels (roughly 18,550 - 18,700) is your key decision area for a potential short entry. 👍
3. 15-Minute Timeframe (M15):
Entry Confirmation Trigger 🔫
The M15 timeframe will be crucial if price reaches your H4 POI (around the 50% Fib level).
What to Look For: During the potential pullback towards ~18,550, the M15 will likely show a temporary bullish structure (higher highs and higher lows).
Confirmation Signal:
For your short setup, you'd want to see this M15 bullish structure fail upon reaching the H4 resistance zone. Look for:
A break of market structure (BOS) to the downside on M15 (price making a lower low after failing to make a higher high).
Formation of clear M15 lower highs and lower lows.
Bearish candlestick patterns (e.g., engulfing candles, pin bars/shooting stars) rejecting the H4 resistance/Fib level.
Potential divergence on indicators like RSI or MACD (though price action is primary).
Synthesized Outlook & Strategy:
The NAS100 is undeniably in a bearish phase across multiple timeframes. The current test of daily lows / H4 support (~17,973) is a critical juncture. A bounce from here seems plausible, aligning with your expectation of a pullback.
The Strategy:
Patience: Wait for price to potentially rally towards the H4 50%-61.8% Fibonacci retracement zone (~18,547 - ~18,682). 🧘♀️
Confirmation:
Monitor the M15 timeframe closely as price approaches this zone. Look for a clear shift in market structure from bullish (pullback) to bearish (resumption of trend). 📉
Entry: If bearish confirmation occurs (M15 BOS), consider a short entry.
Targets:
Initial targets could be the recent lows (~17,973), followed by the Fibonacci extension levels shown on your chart (e.g., -50% at ~17,400.4) or the area below the daily equal lows. 🎯
Risk Management: Crucially, define your stop-loss level (e.g., above the swing high formed during the M15 structure break or above the 61.8%/78.6% Fib level) to manage risk effectively. 🛡️
Fundamental Check:
cross-reference this technical setup with any major news releases or shifts in market sentiment that could invalidate the pattern. 📰

NQ for the weeki don't see a lot of options for shorters here if you didn't catch the move, possibly you can you get some short in lower time frame toward that ray i pointed out there, some options if you want to buy is wait for that thursday low get taken and patiently wait for a reversal. IF today have been this volatile, i don't suggest to trade tomorrow.

The Brightest Metal Right NowGold isn’t just shining, it’s on fire, burning through resistance levels as investors seek shelter from global chaos.
Figure 1: Gold Prices Climbing to New Highs
Gold surged past $3,000 per ounce this March, setting 16 record highs this year alone. While it took more than a decade for gold to gain 1,000 points previously, this time it took less than two years.
Figure 2: Correction in the Equities and Cryptocurrencies
In stark contrast, the S&P 500 has dropped 10% since its February peak, marking its first correction since 2023. Bitcoin has also plunged to $81,000, a 25% decline since U.S. President Donald Trump’s inauguration. The AI-driven momentum that propelled tech stocks and the broader equity market higher in 2024 appears to have faded.
Figure 3: Historical Reactions to Crisis
The correction in equities and crypto stands in sharp contrast to gold’s rally—an outcome that should come as no surprise given gold’s reputation as a safe-haven asset. Historically, financial crises and major market pullbacks have consistently triggered capital flows into gold as investors seek refuge from economic uncertainty.
This time, gold’s outperformance is driven by a “perfect storm” of prolonged geopolitical tensions, escalating trade disputes, political uncertainty under Trump’s second term, and a weakening U.S. dollar.
The CNN Business Fear & Greed Index, a widely used measure of market sentiment, has remained in the “fear” and “extreme fear” zones. This stems largely from Trump’s protectionist policies, which have sparked swift retaliation from U.S. trading partners. With new tariff headlines surfacing almost daily, the future of economic policy and inflation has become increasingly uncertain, injecting heightened volatility into global markets. This has, in turn, strengthened gold’s appeal as a hedge against instability.
Figure 4: Gold’s Demand is not Limited to Investors
According to the World Gold Council, investment demand for gold doubled year-over-year in 2024. However, central banks have been the real drivers of demand, purchasing over 1,000 tons of gold for three consecutive years; accounting for 21% of global demand in 2024.
The rising U.S. budget deficit and Trump’s "America First" policies have created additional risks for central banks holding large reserves of U.S. Treasuries. The ongoing tariff war not only undermines confidence in the U.S. as a reliable trade partner but also raises concerns about the U.S. dollar’s long-term stability as a safe-haven asset. This has accelerated the de-dollarization process, prompting many central banks to stockpile gold as a hedge against dollar exposure.
Unlike investors who may hesitate to buy gold at record highs, central banks operate based on mandates, making them less price-sensitive. They are willing to continue accumulating gold at elevated levels, reinforcing sustained demand for the precious metal.
Figure 5: A Weakening Dollar
Since most gold futures contracts are denominated in U.S. dollars, a weaker dollar makes gold relatively cheaper for non-U.S. buyers, supporting its price. This negative correlation between the two assets has been a key driver of gold’s recent surge.
The Trump administration has long argued that the U.S. dollar’s global dominance has kept it too strong for too long, hurting American manufacturers and contributing to deindustrialization. Further, a strong dollar reduces the price competitiveness of U.S. exports and has widened the trade deficit, leading the administration to pressure the Federal Reserve to cut interest rates.
While the Fed maintains its independence and data-driven approach, inflation trends continue to justify further easing. The market has already priced in three quarter-point rate cuts for this year, with expectations that the first cut could come as early as June.
Gaining Access to Gold
Historically, the London over-the-counter (OTC) market, operated by the London Bullion Market Association (LBMA), has been the largest gold trading center. Traders use the LBMA gold price as the global benchmark for gold transactions, including central bank purchases.
On the other hand, the futures market is the preferred choice for hedge funds, bullion dealers, refineries, and mints to hedge against price fluctuations. Retail investors also typically gain exposure to gold through futures contracts, most commonly via the COMEX gold futures market.
However, executing arbitrage strategies between the OTC and futures markets is capital-intensive and logistically challenging. Traditional arbitrage requires buying physical gold in the LBMA market at a lower price while simultaneously selling COMEX futures at a higher price. This involves storing, insuring, and shipping gold to COMEX-approved vaults, making it difficult to determine the fair value of the spread.
Figure 6: B3 Gold Futures Contract
A more accessible alternative is emerging: Brazil’s B3 Exchange will soon list a new gold futures contract referencing the LBMA gold price.
This new contract offers several advantages:
Easier arbitrage execution: Traders can capitalize on price discrepancies between the B3 contract and COMEX futures.
Lower capital requirements: The contract size is just one troy ounce, 1/100th of the standard COMEX contract, allowing for greater flexibility in position sizing and risk management.
Financial settlement: Both the B3 and COMEX one-ounce contracts are cash-settled, eliminating the logistical challenges of physical delivery.
Putting into Practice
Case Study 1: Arbitrage Strategy
Figure 7: Current Available Gold Futures
A comparison of the existing gold futures contracts highlights key differences in specifications, including fineness, contract size, and settlement methods. While these variations cater to the diverse needs of hedgers managing different gold inventories, they pose challenges for traders looking to establish arbitrage strategies due to mismatches in contract structures.
The introduction of B3’s new gold futures contract addresses these limitations by aligning closely with the COMEX 1-ounce gold contract. This structural similarity simplifies the process of determining fair value in spread pricing, making arbitrage strategies more feasible. The primary distinction between the two lies in their price settlement methods, which, interestingly, also forms the basis of arbitrage opportunities between futures and spot prices.
Additionally, traders can now take advantage of price discrepancies between the two LBMA daily fixing prices by utilizing the B3 Gold and TFEX Gold Online futures contracts. This expands the range of arbitrage opportunities and enhances market efficiency for gold traders.
Case Study 2: Directional Strategy
By considering all the factors – gold’s safe-haven appeal, geopolitical tensions, central banks accumulation, and a weakening dollar – we believe that this is not the end of the gold rally. An investor looking to express a bullish view on gold could do so by buying the B3 one-ounce futures contract, gaining exposure to gold’s price movements in a more accessible and cost-effective manner.
Conclusion
As global uncertainties mount, gold’s resilience remains undeniable. Whether as a hedge against inflation, a refuge from geopolitical turmoil, or a tool for strategic trading, gold continues to prove its value in times of crisis. With central banks stockpiling at record levels, the metal’s rally may still have room to run. For investors navigating today’s volatile landscape, gold is not just a safe-haven, it’s a strategic asset poised for continued strength. It is extremely timely to have new trading instruments like B3’s gold futures providing more accessible opportunities for investors.
For traders looking to enhance liquidity and capitalize on bid-ask spread, B3 also offers a market-making program. Interested participants can reach out to the exchange for further details.

Weekly Market Forecast: Stocks Markets Are Stalled! Patience!In this video, we will analyze the S&P 500, NASDAQ, and DOW JONES futures for the week of April 21 - 25th
The Markets are stalled! No bullish follow through from the previous week. Last week failed to break the previous weekly high. This stall out looks consolidative and unclear. Wait for clarity! Let the markets break the high or low of the range convincingly... and trade accordingly.
Enjoy!
May profits be upon you.
Leave any questions or comments in the comment section.
I appreciate any feedback from my viewers!
Like and/or subscribe if you want more accurate analysis.
Thank you so much!
Disclaimer:
I do not provide personal investment advice and I am not a qualified licensed investment advisor.
All information found here, including any ideas, opinions, views, predictions, forecasts, commentaries, suggestions, expressed or implied herein, are for informational, entertainment or educational purposes only and should not be construed as personal investment advice. While the information provided is believed to be accurate, it may include errors or inaccuracies.
I will not and cannot be held liable for any actions you take as a result of anything you read here.
Conduct your own due diligence, or consult a licensed financial advisor or broker before making any and all investment decisions. Any investments, trades, speculations, or decisions made on the basis of any information found on this channel, expressed or implied herein, are committed at your own risk, financial or otherwise.

Will Nasdaq Test Liquidity at 17,800 Before an Upside Move?NASDAQ is experiencing bearish slow down at the support level for the past 3 weeks. A re-test of the recent low looks imminent. and if price could be rejected after clearing H4 liquidity at 17,800, then we could see a sharp upside move.
Key risks: Fed commentary, major tech earnings, and geopolitical headlines.
N.B!
- NASDAQ price might not follow the drawn lines . Actual price movements may likely differ from the forecast.
- Let emotions and sentiments work for you
- ALWAYS Use Proper Risk Management In Your Trades
#nq!
#nasdaq

E-mini S&P 500 Outlook for next week. Thought process is the same just like NQ1!. Want massive buyside expansion. But weekly profiles need to be there. Tuesday/Wednesday Low of the Week is what I' personally looking for.
So expecting an SMT Divergence on the Previous Weekly Sellside . And then a massive push up.
2nd Stage Distribution on Market Maker Buy Model. Offset it is. Crosshairs on 5529

Nasdaq - This Is Still Not The End Yet!Nasdaq ( TVC:NDQ ) cannot resist bearish pressure:
Click chart above to see the detailed analysis👆🏻
Over the past three months, we saw such a harsh correction on the Nasdaq that a lot of people are freaking out entirely. However technicals already told us that something feels wrong and this is the result. If we see another -10% from here, buying the dip will most likely pay off.
Levels to watch: $16.000
Keep your long term vision,
Philip (BasicTrading)

Celsius Holdings Outperforms Market with Strong YTD GainsCelsius Holdings Inc. (CELH) continues to attract significant investor attention, closing at $37.24 on April 17, up $0.58 (1.58%). The functional energy drink maker has delivered impressive year-to-date returns of 41.38%, substantially outpacing the S&P 500's 10.18% gain during the same period.
For the current quarter, analysts expect earnings of $0.20 per share, representing a 25.9% year-over-year decline. However, consensus estimates have improved dramatically with a 32.8% upward revision over the last 30 days. The full-year outlook appears more favorable, with projected earnings of $0.99 per share indicating a 41.4% annual increase, followed by 15.1% growth to $1.14 per share next fiscal year.
Current quarter sales are expected to decline slightly to $345.26 million (-2.9%), but full-year revenue estimates show robust growth of 55.3% to $2.1 billion, followed by 19.4% growth next fiscal year. Celsius has demonstrated strong execution recently, beating earnings estimates in three of the last four quarters.
Technical Analysis
Technically, the chart shows a strong recovery from its $21.10 low. Price has recently broken above the 50-day moving average but remains below the 200-day moving average, suggesting improving momentum within a longer-term downtrend. Key resistance appears around $47-49, marked by a horizontal level that previously acted as support.
Volume has increased during recent price advances, adding credibility to the current uptrend. The next major challenge will be overcoming the $49 resistance zone before potentially continuing toward higher targets as indicated in the chart projection. If price faces rejection, it is likely to drop back to support at around $25.

Keurig Dr Pepper Holds Steady Ahead of Quarterly EarningsKeurig Dr Pepper (KDP) shares have shown resilience in recent weeks, climbing 5.9% over the past month while the broader S&P 500 declined by 6.9%. The beverage giant currently trades at $35.40, up $0.29 (0.83%), with 13.96 million shares traded. Analysts maintain a consensus "Hold" rating as KDP approaches its upcoming earnings announcement.
Wall Street expects the company to report earnings of $0.38 per share, unchanged from the year-ago quarter, while revenue is projected to reach $3.56 billion, representing a 2.8% year-over-year increase.
The company has seen minor positive revisions to its earnings estimates, with consensus EPS projections increasing by 0.1% over the past 30 days. This modest upward adjustment could signal improving analyst sentiment about KDP's near-term performance.
Breaking down the revenue expectations by segment, analysts forecast U.S. Refreshment Beverages will lead growth at $2.23 billion, up 6.6% year-over-year. Meanwhile, U.S. Coffee is expected to contract slightly to $884.51 million (-2.9%), and International sales may decrease to $448.32 million (-3.4%).
Technical Analysis
From a technical perspective, KDP has established an ascending trend line since reaching a low of $30.12. The stock currently trades above both its 50-day, 100-day and 200-day moving averages, suggesting positive momentum. The chart shows resistance around the $36 level, with support at the trend line near $33.60. Trading volume has increased during recent uptrend, potentially indicating stronger buyer conviction.
