Invest in STRL: Ride the Coming US Digital Infrastructure Surge◉ Abstract
Sterling Infrastructure (NASDAQ: STRL) is a top pick to benefit from America's digital infrastructure boom, with the sector expected to grow 26% annually through 2034. The company specializes in data centers, 5G networks, and smart city projects, supported by a $1 billion backlog and improving profit margins. While risks like regional market shifts and housing demand exist, STRL's fundamentals are strong—revenue grew 7% in 2024, debt is manageable, and its P/E ratio (17.9x) looks cheap compared to peers (70.5x).
Technically, the stock shows bullish patterns after pulling back 35% from highs. With government infrastructure spending rising and strategic acquisitions likely, STRL could deliver 35-40% returns in the next 12-14 months. A good option for long term investing!
Read full analysis here...
◉ Introduction
The U.S. digital infrastructure market, valued at approximately USD 140 billion in 2024, is expanding rapidly, with a projected CAGR of 26.4% through 2034. This growth is driven by factors like the expansion of 5G networks, increased demand for data centers, rising cloud services adoption, AI automation, and investments in smart cities and edge computing. The 5G infrastructure segment alone is expected to grow at a CAGR of 20.2%, reaching USD 17.26 billion by 2030. North America holds a 42.8% share of the global market.
◉ Key Trends and Opportunities
1. Data Centers: Demand continues to rise, driven by cloud computing, AI, and data-intensive applications. Power availability and location are becoming critical, with providers moving to secondary markets to secure reliable energy sources.
2. Fiber Networks: Expansion is underway to support new data centers and remote connectivity needs. Middle-mile and long-haul fiber, as well as fiber-to-the-home (FTTH), are key areas of investment and consolidation.
3. 5G and Wireless: Ongoing rollout of 5G networks is fueling growth in hardware and network densification, with increased activity expected in wireless infrastructure and tower markets.
4. Edge Computing and Smart Cities: The proliferation of IoT devices and smart city initiatives is driving demand for edge data centers and low-latency networks.
5. Mergers and Acquisitions: The market is seeing consolidation, especially in fiber and data center segments, as major players acquire smaller firms to expand their footprint and capabilities.
Today, we’ll focus on Sterling Infrastructure (STRL), a key player navigating the U.S. infrastructure market.
This report provides a detailed look at STRL's technical and fundamental performance.
◉ Company Overview
Sterling Infrastructure Inc. NASDAQ:STRL is a U.S.-based company specializing in e-infrastructure, transportation, and building solutions. It operates through three key segments: E-Infrastructure Solutions, which focuses on site development for data centers, e-commerce warehouses, and industrial facilities; Transportation Solutions, handling infrastructure projects such as highways, bridges, airports, and rail systems for government agencies; and Building Solutions, providing concrete foundations and construction services for residential and commercial projects. Originally founded in 1955 as Sterling Construction Company, the firm rebranded to its current name in June 2022. Headquartered in The Woodlands, Texas, the company serves a wide range of sectors, including logistics, manufacturing, and public infrastructure.
◉ Investment Advice
💡 Buy Sterling Infrastructure NASDAQ:STRL
● Buy Range - 148 - 150
● Sell Target - 200 - 205
● Potential Return - 35% - 40%
● Approx Holding Period - 12-14 months
◉ SWOT Analysis
● Strengths
1. Strong E-Infrastructure Backlog – With over $1 billion in backlog, Sterling has a robust pipeline of future projects, ensuring sustained revenue growth.
2. Higher-Margin Services Shift – The company’s strategic focus on higher-margin work (21% gross profit margin in Q4) improves profitability without relying solely on volume.
3. E-Infrastructure Growth Potential – Expected 10%+ revenue growth and 25%+ operating profit growth in 2025 position Sterling for strong earnings expansion.
4. Strategic M&A Opportunities – Strong liquidity allows for accretive acquisitions, enhancing market share and service offerings.
5. Share Repurchase Program – Active buybacks reduce outstanding shares, potentially boosting EPS and shareholder value.
● Weaknesses
1. Texas Market Transition Risks – Moving away from low-bid work in Texas may slow revenue growth in the Transportation segment if not managed well.
2. Revenue Loss from RHB Deconsolidation – Excluding $236 million in RHB revenue could distort growth metrics and reduce reported earnings.
3. Residential Market Pressures – A 14% decline in residential slab revenue (due to DFW affordability issues) could persist if housing demand weakens further.
4. Geographic Expansion Challenges – High costs and logistical hurdles in expanding data center projects outside core regions may limit growth opportunities.
5. Competitive Bidding & Acquisition Risks – Difficulty in securing profitable acquisitions or winning competitive bids could hinder margin and revenue growth.
● Opportunities
1. Data Center & E-Commerce Boom – Rising demand for data centers and distribution facilities presents long-term growth potential for E-Infrastructure.
2. Government Infrastructure Spending – Federal and state investments in highways, bridges, and airports could boost Transportation Solutions revenue.
3. Strategic Acquisitions – Pursuing complementary M&A deals could expand capabilities and market reach.
4. Diversification into New Regions – Expanding into underserved markets could reduce dependency on Texas and mitigate regional risks.
5. Operational Efficiency Improvements – Further margin expansion through cost optimization and technology adoption.
● Threats
1. Economic Slowdown Impact – A recession could reduce demand for residential and commercial construction, affecting Building Solutions.
2. Rising Interest Rates – Higher borrowing costs may pressure profitability and delay large-scale projects.
3. Labor & Material Cost Inflation – Increasing wages and supply chain disruptions could squeeze margins.
4. Intense Competition – Rival firms competing for the same infrastructure projects may drive down pricing and profitability.
5. Regulatory & Permitting Delays – Government approvals and environmental regulations could slow project execution.
◉ Revenue & Profit Analysis
● Year-on-Year
➖ FY24 sales reached $2,116 million, reflecting a 7.28% increase compared to $1,972 million in FY23.
➖ EBITDA rose to $334 million, up from $264 million in FY23.
➖ EBITDA margin improved to 15.8%, up from 13.4% in the same period last year.
● Quarter-on-Quarter
➖ Q4 sales decreased to $499 million, down from $593 million in Q3, but showed a slight increase from $486 million in Q4 of the previous year.
➖ Q4 EBITDA was $80.3 million, down from $105 million in Q3.
➖ Q4 diluted EPS saw a notable rise, reaching $8.27 (LTM), up from $5.89 (LTM) in Q3 2024.
◉ Valuation
1. P/E Ratio (Price-to-Earnings)
● Current vs. Peer Average
➖ STRL’s P/E ratio is 17.9x, much lower than the peer average of 70.5x, suggesting the stock is undervalued compared to peers.
● Current vs. Industry Average
➖ Compared to the broader industry average of 22.9x, STRL again looks relatively inexpensive at 17.9x.
2. P/B Ratio (Price-to-Book)
● Current vs. Peer Average
➖ STRL’s P/B ratio stands at 5.7x, slightly higher than the peer average of 5x, indicating overvaluation.
● Current vs. Industry Average
➖ Against the industry average of 3.6x, STRL’s 5.7x P/B ratio suggests a noticeable overvaluation.
3. PEG Ratio (Price/Earnings to Growth)
➖ STRL’s PEG ratio is 0.21, which means the stock appears undervalued relative to its strong expected earnings growth.
◉ Cash Flow Analysis
➖ Sterling Infrastructure's operating cash flow grew to $497 million in FY24, up from $479 million in FY23, showing steady financial strength.
◉ Debt Analysis
➖ The company's debt-to-equity ratio is 0.38, indicating a healthy balance sheet with manageable debt levels.
◉ Top Shareholders
➖ The Vanguard Group has significantly increased its investment in this stock, now owning an impressive 8.3% stake, which marks a 30% rise since the end of the September quarter.
➖ Meanwhile, Blackrock holds a stake of around 8% in the company.
◉ Technical Aspects
➖ On the monthly chart, the stock remains in a strong uptrend.
➖ On the daily chart, an Inverted Head & Shoulders pattern has formed, signaling a potential breakout soon.
➖ The stock is currently trading at about 35% below its all-time high, making it an attractive investment opportunity.
◉ Conclusion
Sterling Infrastructure (STRL) stands out as a strong investment candidate, backed by solid financial performance, a growing E-Infrastructure backlog, and a strategic focus on higher-margin projects. Its attractive valuation, healthy cash flow, and low debt levels provide further confidence in its growth potential. While there are challenges—such as market competition, geographic expansion hurdles, and economic uncertainties—Sterling’s strengths, including a robust project pipeline, strategic acquisitions, and exposure to high-growth sectors like data centers and 5G infrastructure, offer a favorable risk-reward balance. Overall, Sterling is well-positioned to benefit from the ongoing U.S. e-infrastructure boom, making it an attractive long-term investment opportunity.
Nasdaq

Google Ruling Could Be Very Bullish for TTDA U.S. judge has found Google guilty of illegally monopolizing the digital advertising technology markets. The monopolization of both the demand and supply sides has been a long-standing concern for the rest of the digital advertising sector.
This ruling may significantly benefit The Trade Desk (TTD), as it operates as an independent demand-side platform. The digital advertising market is projected to exceed $600 billion in 2025, and Google currently believed to be controls nearly 30% of that. Even a 5% slip in Google’s market share, with TTD capturing just 10% of that shift, could nearly double TTD's revenue. As a result, this ruling is can be considered very bullish for TTD, both in the medium and long term.
Technically, TTD recently tested the $40 level, a key support that has held since Q4 of 2020, indicating the stock is currently in a strong demand zone. With this news, the likelihood of that support holding and a bullish reversal increases.
Analyst consensus reflects an 85.8% upside potential. If the bullish scenario plays out, the horizontal level at $60 and the 200-day moving average could serve as key medium-term targets. From current levels to the 200-day SMA, the potential return is close to 50%.

"This is fine" on Nasdaq?The general sentiment coming into this week is that the bear trend is over and "things are fine." Maybe. This morning there was a 30m opening spike on NASDAQ:QQQ I cannot ignore. It is happening right at the big Daily 50% Retracement of the leg down:
The level is even more prominent on Nasdaq futures and one can add the Volume Profile Point of Control to said level.
CME_MINI:NQ1!
Playing this with June Puts on QQQ but going to use today's high as a tight stop. We'll see what "Sell in May" brings...

Are You Ready For Nasdaq Next Flight ? 500 Pips Waiting For Us !Here is my opinion on Nasdaq , i think we have a very good closure and we can say we will go up for sometime in the next few days , so i`m waiting the price to go back to my support area ( Lower One ) that already broken , and then we can enter a buy trade and targeting 500 pips . also if the price touch the higher place and give me a good bullish price action , we can enter a buy trade with small lot size and if the price go to the lower one we can add one more contract .

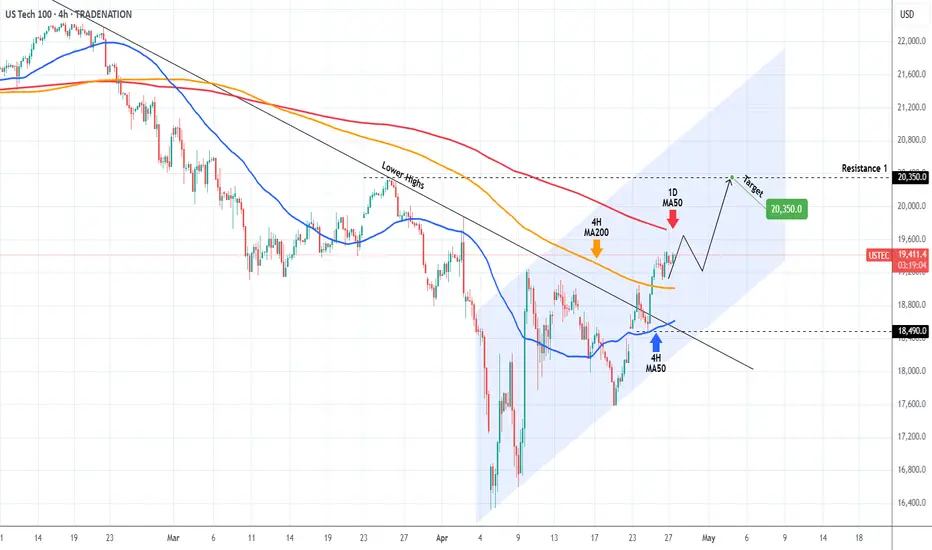
NASDAQ ahead of the most critical Resistance test.Nasdaq (NDX) not only broke above the Lower Highs trend-line of its All Time High (ATH) last week but managed to break and turn the 4H MA200 (orange trend-line) into Support.
It is now aiming for the 1D MA50 (red trend-line), which is the most crucial Resistance level of this recovery attempt and is what technically turns bearish trends into bullish if it turns into Support.
We expect a short-term rejection there, which should give a buy opportunity near the 4H MA200. Our Target for this is 20350 (Resistance 1).
-------------------------------------------------------------------------------
** Please LIKE 👍, FOLLOW ✅, SHARE 🙌 and COMMENT ✍ if you enjoy this idea! Also share your ideas and charts in the comments section below! This is best way to keep it relevant, support us, keep the content here free and allow the idea to reach as many people as possible. **
-------------------------------------------------------------------------------
Disclosure: I am part of Trade Nation's Influencer program and receive a monthly fee for using their TradingView charts in my analysis.
💸💸💸💸💸💸
👇 👇 👇 👇 👇 👇
NAS100 - Stock Market Waiting for a New Stimulus?!The index is trading above the EMA200 and EMA50 on the four-hour timeframe and is trading in its ascending channel. If the index continues to move upwards towards the specified supply zone, one can look for further Nasdaq short positions with a risk-reward ratio.
Last week, financial markets experienced a brief sigh of relief as U.S. President Donald Trump appeared to ease tensions by signaling a limited retreat in the tariff war with China, sparking hopes for reduced friction. However, this optimism quickly faded once it became clear that Trump’s retreat was neither substantial nor impactful.
From Beijing’s perspective, the trade war has transcended economic concerns, becoming an issue of national pride and sovereignty. As a result, China, the world’s second-largest economy, is not retreating as easily as Trump anticipated. This stance has evolved into a significant challenge for the White House. U.S. officials indicated that tariffs of 145% could be reduced within two to three weeks if an agreement is reached.
Nonetheless, according to Chinese authorities, negotiations have yet to even begin, raising doubts about Trump’s negotiation tactics. Additionally, other concessions, such as reducing tariffs on American automakers, remain uncertain, and Trump has even threatened to raise tariffs on Canadian car imports.
This environment not only fails to clarify U.S. trade policy but also deepens uncertainty for domestic businesses. Although the White House claims it is monitoring markets closely and Trump is eager to strike deals with key partners, these assurances have not alleviated concerns about the future of the U.S. economy.
In the upcoming week, critical economic data could either intensify or ease current worries. On Tuesday, the Consumer Confidence Index for April and the JOLTS job openings data for March will be released. The highlight, however, will be the preliminary estimate of GDP growth, scheduled for Wednesday.
The Atlanta Fed’s GDPNow model forecasts a 2.2% annualized contraction in the U.S. economy for Q1 2025. Meanwhile, a Reuters survey of economists projects a modest 0.4% growth rate, a significant slowdown from Q4’s 2.4% growth.
Accompanying these reports, the ADP private-sector employment data and the Personal Consumption Expenditures (PCE) index will be published. The core PCE for March is expected to show a monthly increase of 0.1% and an annual rise of 2.5%, down from 2.8% previously. Personal spending is anticipated to maintain its 0.4% monthly growth, reflecting resilient household expenditures.
Additionally, on Wednesday, the Chicago PMI and pending home sales figures will be released. Thursday will bring the Challenger layoffs data for April, but market focus will be on the ISM manufacturing PMI, expected to drop from 49 to 47.9.
The week’s main event will be Friday’s release of the Nonfarm Payrolls (NFP) report. Forecasts suggest job growth will slow from 228,000 in March to 130,000 in April, while the unemployment rate is expected to remain at 4.2%. Wages are projected to rise by 0.3%.If NFP and PCE data come in weaker than expected, market expectations for a 25-basis-point rate cut by the Fed in June could intensify, although the likelihood of a cut in May will remain low. Such data would likely be bearish for the U.S. dollar but could support equity markets if recession fears do not dominate sentiment.
Some Federal Reserve officials have suggested that if economic conditions deteriorate significantly, rate cuts could start as early as June. Currently, the Fed has maintained high rates to combat inflation but may lower them to support growth and prevent a sharp rise in unemployment if necessary.
Trump’s trade wars pose a dual risk of increasing inflation while hurting employment, complicating the Fed’s monetary policy strategy. Presently, the Fed is in a “wait-and-see” mode, but several officials indicated last week that cuts could begin if economic data worsens.
Beth Hammack, President of the Cleveland Federal Reserve Bank, told CNBC on Thursday that the Fed might lower rates starting in June if signs of economic weakening due to Trump’s sporadic tariffs appear.
Christopher Waller, a Fed Board member, stated on Bloomberg TV that he could foresee rate cuts if the labor market collapses but does not expect such a scenario before July.
On Thursday, Waller remarked, “It would not be surprising to see an increase in layoffs and a higher unemployment rate, especially if major tariffs return. I would expect faster rate cuts once signs of severe labor market deterioration emerge.”
These comments highlight the Fed’s current dilemma as it awaits clearer evidence of significant economic fallout from Trump’s trade wars.
The Federal Reserve’s mandate is to maintain low inflation and unemployment levels. Its primary tool, the federal funds rate, influences borrowing costs across the economy. The Fed can stimulate growth by lowering rates or curb inflation by raising them.
Economists warn that Trump’s tariffs present the risk of simultaneously driving up inflation while damaging employment, forcing the Fed to prioritize which challenge to address first.

Nasdaq market analysis: 28-APRIL-2025Good morning. Welcome to today's Nasdaq market analysis and educational insights for price action traders.

Was this the best buying opportunity since 2011?Sure, here's a rewritten version of your text in an engaging tone:
"Have you ever heard of the Zweig Breadth Thrust? Well, let me tell you, it’s an incredible metric that can really shed some light on the current market situation!
So, what would it take for me to believe that this bounce isn't just another bear market rally? My first step would be to dive into the breadth indicators and look for signs of that elusive breadth thrust.
Think of a breadth thrust like a rocket taking off. You need a strong initial boost to break free of gravity's grip. If the thrust is weak, the rocket can’t escape, and the same applies to stock market reversals. When we see a robust breadth thrust, that's a signal that a significant reversal is underway. Without it, we could be facing another false bounce.
Now, let’s talk numbers! As of Friday, April 25th, the SPX has surged an impressive 14.2% from its recent lows, and while that’s quite a leap, it’s essential to keep it in perspective. Just think back—this index was down 21.35% from its all-time high earlier in February during the panic sell-off. Now, with the recent strength, it’s only 10.75% off its peak.
The Zweig Breadth Thrust is calculated based on the 10-day EMA of NYSE Advances divided by the sum of Advances and Declines. A bullish signal pops up when the ZBT shifts from below 0.40 to above 0.615 within just ten days or less. Keep an eye on that—it might just help us navigate these choppy waters!"
On the monthly chart, it’s clear that what we’ve been seeing in the broader economy (you know, Main Street) is actually showing us some bearish divergence—a concept I've mentioned in my previous ideas.
Since 2009, we've had four notable instances on the Monthly chart where the ZBT dipped below 0.40, only to bounce back up past the 0.6 mark. Remember back in November 2011? That was when we got a significant signal with a low reading of 0.31, which climbed back to 0.62 by February 2013. That surge sparked a bull run that peaked in February 2020!
So, the takeaway here is that this breadth thrust is generating the positive momentum we need to reach new stock market highs this year. Exciting times ahead!

WEEKLY ANALYSIS TO HELP YOUR TRADING: Nasdaq, NQ, NAS100A bullish weekly bias as I believe price action will probably reach for the breaker block outlined in my video before seeing an aggressive move away from it.

MNQ1!/NQ1! Day Trade Plan for 04/25/2025MNQ1!/NQ1! Day Trade Plan for 04/25/2025
📈 19430 19580
📉 19140 18980
Thanks to all my followers! Truly appreciate the support!
Please like and share for more NQ levels Tues & Thurs 🤓📈📉🎯💰
*These levels are derived from comprehensive backtesting and research and a quantitative system demonstrating high accuracy. This statistical foundation suggests that price movements are likely to exceed initial estimates.*

NASDAQ Bullish Monday (MMBM, Quarterly Theory) Hello guys, looking at the current weekly profile, as well as the 4h bullish outbreak, im expecting to see Monday pushing into my marked weekly Orderblock. This scenario is especially to my liking of a high probability for a London Reversal. I want to see London sweep Sell Side Liquidity and tap into a Discount Area.

A Long-term Bullish Trend ?With an upcoming Earnings report we can observe rather uncertain future behavior.
But since the trend has been bearish for a longer period of time and the price is "nearly" at the same position which was achieved for the first time in early April in 2019, we can, mostly based only on the technical analysis and Earnings report, determine quite confidently that the price is ready to rise.
Important data:
EPS Estimate: -$3.12
Revenue Estimate: $106 million to $166.7 million
Notable developments:
Cost-cutting initiative = Targeting $1.1B in reductions by 2027
By the end of 2024 $9.5 billion allocated in investments

$MAGS Repeating History? - Nasdaq Oscillator Flashes Caution📉 CBOE:MAGS (MAG 7 ETF) is showing striking similarities to its previous top, right before a 30% drop. Both price action and the Nasdaq Oscillator are echoing that same setup.
🔍 Key Observations:
Price has rallied into a confluence of resistance near the previous breakdown zone.
The Nasdaq Oscillator has returned to a historically high reading – the last time this happened, MAGS topped and dropped hard.
A similar structure could suggest a -30% move, targeting the $32–$33 range.
⚠️ Caution: We’re in a potential bull trap zone. Unless we break cleanly above the red trendline and consolidate, this rally may be short-lived.
🧠 Smart money may already be unloading into this strength.

WolfIn a premature stage but if the price sustain at the level of around 3$ then the potential targets around 3.5 and above.

ADMA Biologics, Inc. (ADMA) – Plasma Power with Policy TailwindsCompany Snapshot:
ADMA Biologics NASDAQ:ADMA is carving out a dominant position in plasma-derived immunotherapies, with a 100% U.S.-based supply chain that delivers both regulatory resilience and logistical strength in a vital healthcare segment.
Key Catalysts:
Strategic Domestic Advantage 🇺🇸
Fully U.S.-based manufacturing and supply chain
Aligns with national healthcare policy and reduces global exposure risk
Elite Healthcare Partnerships 🏥
Works with Mayo Clinic & Cleveland Clinic
Validates product quality and ensures recurring revenue streams
Strong Insider Conviction 📈
CEO Adam Grossman purchased $1.2M in stock
Insiders own 12%, showing long-term commitment
Plasma Therapy Demand on the Rise 🚨
Growing market for immune deficiency and infectious disease treatments
Reliable production scale + strategic partnerships = compounding value
Investment Outlook:
✅ Bullish Above: $19.00–$20.00
🚀 Target Range: $29.00–$30.00
🔑 Thesis: Fully domestic moat + institutional partnerships + insider alignment = high-conviction growth biotech
📢 ADMA: A rare mid-cap with stability, growth, and a policy-aligned advantage.
#BiotechStocks #PlasmaTherapy #Immunology #ADMA #InsiderBuying #HealthcareMoat

US100 - Corrective Pullback into FVG + Golden Pocket setup?This 1H Nasdaq chart paints a classic structure of retracement within a bullish leg, offering potential for continuation after a clean corrective move into inefficiency. It's all about balance restoration before the next impulse.
---
1. Resistance Reaction & Local Distribution
Price faced strong rejection at a clearly defined Resistance Zone , marking a point of supply where sellers stepped in with aggression.
- The sharp rejection indicates profit-taking from earlier longs or a short-term distribution zone.
- Structure is transitioning from impulsive to corrective, suggesting a pullback is unfolding rather than a trend reversal (at least for now).
---
2. Short-Term Demand Zone Holding Price (Gray Box)
Before reaching deeper liquidity, price is hovering above a local demand block —a previously unmitigated consolidation that supported the last push up.
- This gray zone may provide temporary support, but lacks depth of imbalance.
- It's a weak floor, and smart money typically seeks deeper fills for proper re-accumulation.
---
3. Fair Value Gap Below (Primary Draw on Liquidity)
The key area of interest lies just below, where a clean Fair Value Gap (FVG) is formed. This imbalance represents a void in price action where buy-side inefficiency remains.
- Aligned with the 0.618–0.65 Fibonacci retracement range (confluence entry).
- Price is likely to seek this inefficiency for proper rebalancing.
- It’s not just a “fill the gap” play—it’s a liquidity grab where smart money is most likely waiting.
This zone is ideal for reaccumulation before resuming the move higher.
---
4. Internal Structure Suggests Bullish Intent After Fill
Price is forecasted to:
- Step 1: Break beneath the short-term demand to draw in liquidity
- Step 2: Tag the FVG zone, tapping into fresh demand
- Step 3: Shift structure via higher low formation and breakout
This is the behavior of an engineered retracement—not panic selling.
---
5. Macro Bias Still Bullish – Controlled Pullback
While the short-term price action looks bearish, the context remains supportive of upward continuation:
- No signs of aggressive selling below structure
- Current flow is corrective, not distributive
- FVG zone is strategically placed in alignment with optimal trade entry levels (OTE)
If this zone holds, expect a return to bullish expansion targeting inefficiencies left behind on the push down.
---
Conclusion:
This setup is textbook:
- Efficient rejection at resistance
- Controlled retracement into FVG with Fibonacci confluence
- Potential structural shift post-rebalance
Watch for bullish intent to return once the imbalance is filled. Until then, this is not a breakdown—it's a setup.

Nasdaq on Thin Ice? Smart Money is Bearish!📊 COT Analysis – NASDAQ E-MINI Futures
Asset Managers → Consistently net long, but without accumulation: showing little conviction on new lows.
Leveraged Money → Confirmed aggressive shorts, a clear sign that smart money doesn't believe in the bounce.
✅ COT Conclusion:
Smart money is not buying the dip → fundamental bias = bearish.
🧠 Technical Breakdown + My Long Trade
📉 Structure:
Strong rejection from the 16,700–17,300 zone, with a long weekly wick = signs of accumulation.
Price formed a double bottom + weekly engulfing candle, right on the demand zone → confirming strong buyer pressure.
🎯 My Long Trade (LIVE SETUP):
Entry: After confirmation of bullish price action on the blue demand zone
Target: Supply zone 20,400–21,000
Exit: Closed just before the drop → perfect trade management, respecting structure and weekly resistance
📈 Post-trade context:
Price then rejected violently from that zone → we’re now back around 18,400, and if 18,000 breaks, the door opens toward 16,700.
🧭 What’s Next?
🔹 If price pulls back to 19,200–19,500, I’ll look for a short setup
🔹 If it breaks below 18,000 → clean path toward 16,700–16,500
✅ Trade Summary
🔥 Long from structural demand zone → exit at weekly supply
🧠 Setup based on price action + RSI and structural confluence
🐻 Now the bias shifts back to bearish: watch the 18k level closely

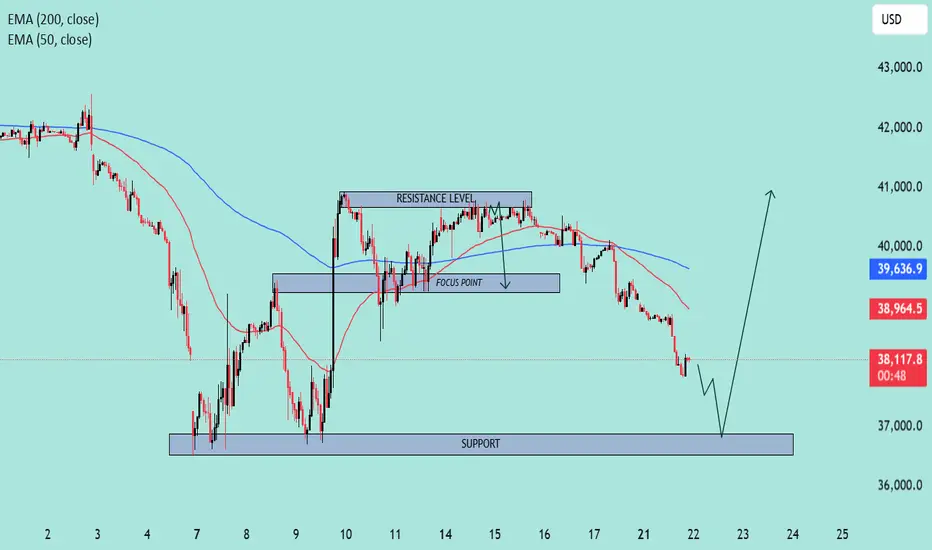
US30 Approaching Key Support Zone – Potential Reversal Ahead?📊 Chart Overview:
Timeframe: Looks like an intraday (maybe 1H or 2H).
Indicators:
EMA 50 (Red): 38,964.7
EMA 200 (Blue): 39,637.0
🔍 Key Levels & Structure:
🔵 Support Zone (Highlighted):
Around 36,800 – 37,200 range.
This is a well-tested support level where price previously bounced.
Current price action is approaching this zone again, which increases the chance of a potential bullish reaction.
🟣 Resistance Level:
Defined around 40,500 area.
Price has rejected multiple times from this zone.
Previously served as a consolidation/decision area.
📍 Focus Point (Previous Support Turned Resistance):
Near 38,700 – 39,000.
This level may act as a reaction point on the way back up.
📉 Current Price Action:
Strong downward momentum heading into the support zone.
Price is under both EMAs, suggesting short-term bearish trend.
However, the drawn arrow suggests a potential reversal bounce from the support.
🧠 Interpretation & Scenario Plan:
🅰️ Bullish Scenario:
Price touches or sweeps the support zone.
Bullish structure or reversal candle forms (e.g., hammer, bullish engulfing).
Break back above EMA 50 & Focus Point could confirm the shift.
Target: Revisit Resistance Zone (above 40,000).
🅱️ Bearish Scenario:
Support fails to hold.
Clean break below 36,800 with volume could lead to accelerated sell-off.
Watch for breakdown retests of support turned resistance.
🔔 Takeaway:
⚠️ Current move is bearish, but price is approaching a key demand zone. Bulls might step in if the zone holds. Confirmation is key before going long. Reclaiming EMAs would strengthen bullish bias.
Analysis of Nasdaq 100 (US100) based on Price ActionThis analysis examines the recent price action of the Nasdaq 100 (US100) and identifies potential scenarios based on key technical levels.
Current Situation:
The price has recently moved above a short-term downtrend line, which could indicate a shift in momentum. This development suggests a possibility of upward movement.
Potential Bullish Scenario:
A decisive break and sustained close above the recent resistance level of 19,224 may open the door for further gains. In such a scenario, the index might target the 20,329 level. A successful move beyond that could potentially lead to a test of the historical peak at 22,245.
Potential Bearish Scenario:
Conversely, if the index fails to overcome the 19,224 resistance, there is a chance it could retest previous support levels. These levels are identified at 17,592 and, subsequently, at 16,322.
Conclusion:
The US100 is currently at a critical juncture. The ability of the price to sustain a move above 19,224 may determine its short-to-medium-term trajectory. Both bullish and bearish scenarios remain possible, and traders should monitor price action closely around these key levels.

NASDAQ Potential DownsidesHey Traders, in today's trading session we are monitoring NAS100 for a selling opportunity around 19,400 zone, NASDAQ is trading in a downtrend and currently is in a correction phase in which it is approaching the trend at 19400 support and resistance area.
Trade safe, Joe.

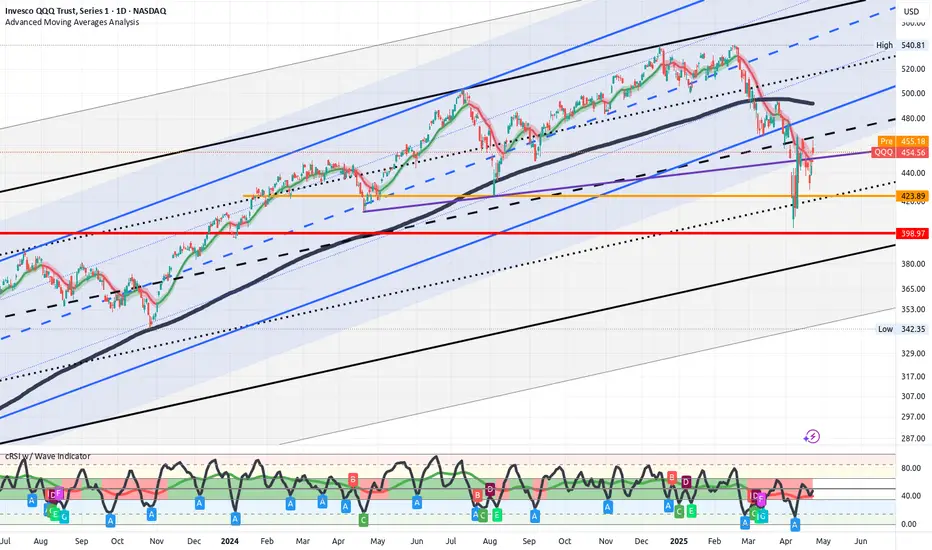
QQQ - Your guess is as good as mineMarkets are all over the place. I know ground breaking info. I don't think there is any clear answer to what is next.
Even if Trump does reduce tariffs on China, they are still going to be some of the highest in recent history. However, it looks like Trump has flinched and China has the upper hand. That is just likely going to make Trump more erratic since his policies are emotional/ego driven and not strategic.
Overall, there are likely some short-term gains to be have as the market likes to always push up when not in an panic sell. For now, the worst of the news is over and the low from the other week is likely going to be the bottom for the near future. I expect stock to continue this up and down until the tariffs work there way through the system and we see the true effect on the economy.
We punched above the 20 day SMA yesterday and will likely test it for support today and tomorrow. If it holds, I wouldn't be surprised to see prices test the 200 day. Hard to know what crazy stuff Trump will do over the weekend, so we will have to see. Good luck and enjoy the ride.
NASDAQ Breakout Done , 5oo Pips Waiting For Us , Are You Ready ?Here is my opinion on Nasdaq , we have a stop hunt very clear and then we have a very good breakout with amazing bearish candle , so i`m waiting for the price to go up a little to retest the broken support and new Res , and then we can enter with good bearish P.A And Targeting from 300 to 500 pips .

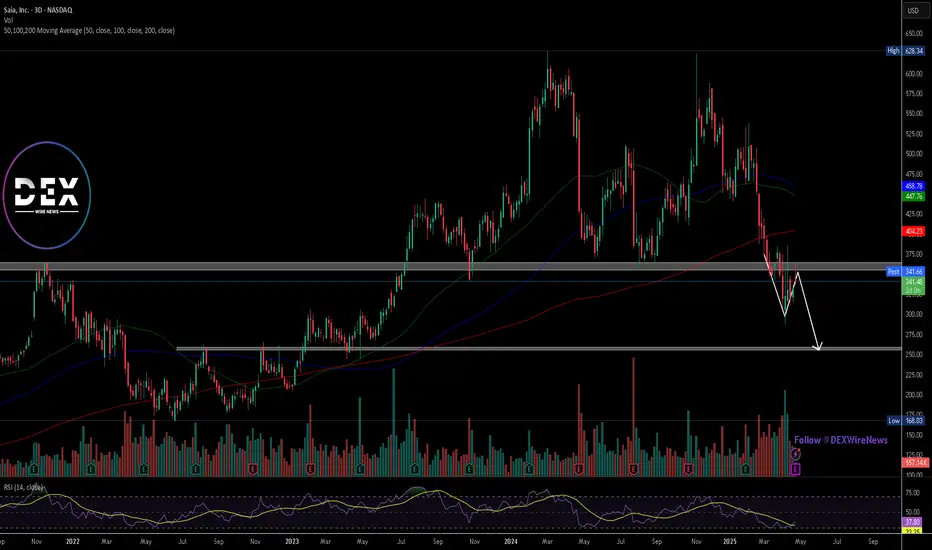
Upcoming Saia Earnings Announcement Draws Investor Attention Saia Inc. (NASDAQ:SAIA) is expected to release its first-quarter earnings soon, drawing investor attention amid recent downward revisions in analyst estimates. Wall Street forecasts earnings of $2.77 per share, marking an 18.1% decline from the same quarter last year. Revenue is projected to increase by 7.3% year-over-year to $810.08 million.
Over the past month, consensus EPS estimates have been revised down by 7.6%, reflecting a shift in analyst sentiment. These estimate changes are often used as signals to predict short-term stock movement.
Beyond the top and bottom lines, analysts have modeled key metrics to provide deeper insight into the company's performance. The operating ratio, a critical efficiency indicator in the transportation sector, is projected to rise to 87.6% from 84.4% a year earlier. A higher ratio suggests an increase in operating costs relative to revenue.
Analysts also expect Saia’s Less-Than-Truckload (LTL) revenue per hundredweight to drop to $24.75 from last year’s $26.51, signaling potential pricing pressure. Saia stock has declined 14.4% over the past month, underperforming the S&P 500’s 8.9% drop. The stock currently holds a Zacks Rank #3 (Hold), suggesting performance in line with the broader market.
Technical Analysis
Saia’s share price has broken below a key support level at $360, continuing a bearish trend. The next support lies near $258. All major moving averages are above the current price and sloping downward—50-day at $447, 100-day at $458, and 200-day at $404—confirming the downward momentum.