Nasdaq: Higher Low or Lower High?NASDAQ:QQQ
Are we making a lower low or a higher low?
This $438-$444 previous resistance needs to hold and be flipped into support to continue this rally.
If not then we are going to break the lows!
Not financial advice
Nasdaq

MNQ!/NQ1! Day Trade Plan for 04/10/2025MNQ!/NQ1! Day Trade Plan for 04/10/2025
📈19130
📉18530
Thanks to all my followers! Truly appreciate the support!
Please like and share for more NQ levels Tues & Thurs 🤓📈📉🎯💰
*These levels are derived from comprehensive backtesting and research and a quantitative system demonstrating high accuracy. This statistical foundation suggests that price movements are likely to exceed initial estimates.*

PEG @ 0.22 DEBT/ASSET @ 0.09 NVIDIA LOOKS CHEAP WITH SELL-OFFFundamental metrics favour NVIDIA and with the company's return on equity (ROE) stands above 119%, NVDA stock price looks irresistible below 105.
N.B!
- NVDA price might not follow the drawn lines . Actual price movements may likely differ from the forecast.
- Let emotions and sentiments work for you
- ALWAYS Use Proper Risk Management In Your Trades
#nvda
#nasdaq
#nyse

NVIDIA Update 3 Rangebound with new Low for longsIn this video I bring to your attention what we could possibly expect if we lose the current level and if we do then where is the next crucial zone to look for Longs.
If you have read this then pls do Boost my work and any questions then leave them below

07/04/25 Weekly Outlook Last weeks high: $88,502.90
Last weeks low: $77,786.89
Midpoint: $83,144.89
Never a dull moment in this game, last week we saw a relatively flat move from Bitcoin as traditional markets continued their heavy sell-offs thanks to the tariff trade war. The high of the week coming from the run up to Trumps tariff announcement, that then retraced as the speech went on and as the week closed a heavy capitulation move down.
As the week begins BTC's price hit as low as $74,500 barely frontrunning the HTF goal of $73,500 to close the inefficiency wick from the US election 6 months ago. For me this is where I start to pay attention to where buyers may be stepping into the market at this HTF support area. Obviously the worry is still in Tradfi, just how low will the SPX, DJI etc go? That's hard to tell but there is certainly a huge amount of fear in the market and fear brings opportunity.
The NY open should be an interesting one and should set the tone for the week, A reclaim of the weekly low sets up yet another SFP long opportunity to then go and test the midpoint, acceptance under the weekly low may provide one last push to close tout the move to $73,000.
The Federal Reserve is having am emergency closed board meeting today too, if an emergency cut to interest rates comes of this to boost growth then BTC will definitely see the benefits of this.
Good luck for the week ahead!

Nasdaq insights: 10-APRIL-2025Rise and shine, traders! Start your day with actionable Nasdaq insights. Let's grow your skills together, one chart at a time.

Today analysis for Nasdaq, Oil, and GoldNasdaq
The Nasdaq closed with a sharp surge following news of a possible delay in Trump’s tariff implementation. A 12% single-day rally on the daily chart is unprecedented — it was an extraordinary rise. On the daily chart, the 20-day moving average is acting as resistance, and to fully fill the April 3rd gap-down, the index would need to rise to around 19,750. If the Nasdaq continues to climb and fills that gap, a potential pullback should be anticipated.
Although the MACD has turned sharply upward in a V-shape, it hasn't fully broken above the Signal line yet. Given the rapidly changing global conditions, the possibility of a reversal still exists. However, since the 90-day tariff delay has been confirmed, the market may be entering a phase of relative stability. On the weekly chart, we see a sharp rebound that has brought the index up to the 5-week moving average. Both the Nasdaq and the VIX suggest that today could be a range-bound (sideways) session, so it's better to set wider trading ranges and adopt a box-range trading strategy.
On the 240-minute chart, a double bottom pattern has formed, with the MACD bouncing off the Signal line and rising again. The MACD is trending upward, but the Signal line remains below the zero line, which means a short-term pullback could still occur. Overall, it is advisable to use a buy-low, sell-high approach, with more upside potential still open. Also, today’s CPI report is scheduled, so please be mindful of increased volatility around the data release.
Crude Oil
Crude oil rebounded sharply from the $55 level, showing an impressive 12% range between high and low. However, the sell signal remains active. The price has broken above the 5-day moving average and entered a box range between the 5- and 10-day MAs, suggesting that a moving average-based box strategy would be effective.
On the weekly chart, oil has not yet reached the 5-week MA, so there’s still room up to the $65 level, which has historically served as strong resistance. Around that area, it might be more effective to consider short positions. On the 240-minute chart, the MACD showed signs of a third wave down, but failed to make a new low — signaling bullish divergence. A head-and-shoulders inverse pattern may be forming, with the right shoulder potentially developing around the $59–$60 zone. Overall, the strategy should remain range-based, with some more room to the upside.
Gold
Gold also closed sharply higher, benefiting from the tariff delay news. On the daily chart, the price closed higher, giving the illusion of a support bounce off the lower Bollinger Band, as that band is rising. The MACD remains above the zero line, so there’s still room for a retest of the Signal line, but given the current gap between MACD and Signal, the price needs to either rise further or move sideways to bring the MACD closer and potentially break above the Signal line.
If it fails to rise from here, the MACD may turn down again, so avoid chasing the price upward. Like Nasdaq and oil, gold is heavily influenced by global developments, so stay updated on the geopolitical landscape. On the 240-minute chart, gold formed a triple bottom around the 2,980 level and then rebounded strongly. The MACD is trending upward and pulling the Signal line along with it, but resistance around the 3,130 level remains significant. Gold may see increased volatility from today’s CPI report and tomorrow’s PPI release, so stay alert.
Market Summary
The market has been showing signs of irrational behavior. Investor sentiment is extremely volatile and driven more by emotion than logic. In times like this, it’s more important than ever to stick to the basics, shorten trade duration, cut back on risk, and trade with discipline. The more you chase after gains, the more likely your trades will be swept away by market turbulence.
Warren Buffett is considered a legend in the financial markets precisely because he has always stuck to fundamental principles. Likewise, it is crucial to establish and stick to your own trading principles to survive in the markets. If you haven’t yet experienced the kind of volatility we saw during the Trump era or the pandemic, this is a time to be especially cautious and defensive in your approach.
Wishing you another day of successful trading
If you like my analysis, please follow me and give it a boost!
For additional strategies for today, check out my profile. Thank you!

Tesla Taps the Golden Zone – Is the Launch Sequence Engaged?Tesla (TSLA) has shown textbook precision by respecting the golden zone after a significant sweep of previous highs. Rather than violating the last HTF low—which would’ve hinted at deeper downside—price instead retraced cleanly into the OTE (Optimal Trade Entry) range and reacted with strong bullish intent.
This move indicates a healthy retracement rather than weakness, suggesting a continuation to the upside. Confirmation of this potential bullish leg would be a sustained close above the 272–300 level, which aligns with previous buyside liquidity zones and Fibonacci confluence.
Key Observations:
- Golden Zone respected: Price bounced cleanly between the 62–79% fib levels.
- HTF low protected: No violation of higher timeframe bullish structure.
- Volume spike supports the reversal move.
Targets:
- Short-term: 300.61
- Mid-term: 416.67
- Long-term swing: 861.17 (over 255% potential gain)
Conclusion:
Tesla looks set for lift-off 🚀. The reaction at the golden zone and the preservation of structure give high confluence for a potential explosive move higher. Wait for confirmation via price continuation and structure integrity.
As always — DYOR (Do Your Own Research).

Another tariff u-turn: Oil overbought on news? President Trump announced a 90-day pause on reciprocal tariffs for countries that have not retaliated, sparking a sharp rally in U.S. markets. The Nasdaq 100 led gains with a 12.2% surge. The U.S. dollar also strengthened against safe-haven currencies such as the Japanese yen and Swiss franc.
Crude oil prices rebounded alongside equities, with oil futures rising more than 4% to trade above $62 per barrel.
However, the strength of the oil rally may be overstated. China, one of the world’s largest oil consumers, was among the first to retaliate against U.S. tariffs. Tensions between Washington and Beijing have worsened, prompting the U.S. to raise tariffs on Chinese goods to 125%.
Adding to the caution, analysts at Goldman Sachs revised down their 2026 average price forecasts for Brent and WTI, citing rising recession risks. The bank now expects Brent to average $58 per barrel and WTI to average $55.

Micron's Time to Be THAT Semiconductor is coming and FastNASDAQ:MU is extremely undervalued, I produced this chart last night. Its time that the market appreciates this monster with such solid fundamentals. Micron since 2022 has been working hard to become a major producer in the United States. I believe that Trump and his government could get behind the only major memory company to be based in the United States.
-----------------------
Balance Sheet:
Cash: $8.22b
Debt: $11.54b
Equity: $48.63b
Total Liabilities: $24.42b
Total Assets: $73.05b
All Stated in $ USD
-----------------------
Valuation:
Price To Sales: 2.72
Price To Earnings: 18.30
Forward Price To Earnings: 6.84
-----------------------

Monster Beverage Corp (MNST) – Energizing Global GrowthCompany Snapshot:
Monster NASDAQ:MNST continues to dominate the $60B+ global energy drink market, expanding across 159 countries with a diverse portfolio and strong executive leadership.
Key Catalysts:
Global Market Expansion 🌐
Strategic brands like Predator and Fury targeting emerging markets
New geographies = incremental revenue & brand exposure
Category Leadership & Diversification 🥤
Strong lineup: Monster Energy®, Reign®, Bang®, Java Monster®, NOS®
Broad consumer appeal → fuels market share gains in both premium & value tiers
Industry Tailwinds 📊
Energy drink market projected to grow at 7.6% CAGR (2025–2029)
Monster well-positioned with affordable, recognizable, and global brands
Leadership & ESG Strength 💼💚
Longtime Co-CEOs Rodney Sacks & Hilton Schlosberg driving global strategy
Involvement in charitable events reinforces brand goodwill and consumer trust
Investment Outlook:
✅ Bullish Above: $50.00–$51.00
🚀 Upside Target: $75.00–$76.00
📈 Growth Drivers: Emerging market expansion, brand strength, leadership, and rising category demand
⚡️ Monster – Powering growth from the shelf to the streets. #MNST #EnergyDrinks #GlobalLeader

Today analysis for Nasdaq, Oil, and GoldNasdaq
The Nasdaq closed lower after forming an upper wick at the 5-day moving average on the daily chart. If it had closed with a bullish candle, a technical rebound from the oversold condition could have opened the way to the 10-day moving average, but instead, it ended with a bearish candle.
The daily chart still shows a sell signal, but the best-case scenario would be for the market to form a double bottom pattern after confirming a short-term low and attempt another rise toward the 10-day moving average.
On the intraday charts, there's a high probability that the market will show a double bottom during the pre-market session, especially since there's no clear sell reversal on lower timeframes yet. The 240-minute chart shows a golden cross on the MACD, and although a death cross hasn't yet occurred, the large gap between the MACD and the zero line suggests a continued corrective trend.
As long as the death cross doesn't materialize, buying on dips near the bottom remains favorable. The 16,500 level is a strong support zone on the monthly, weekly, and daily charts, so shorting is not recommended — better to lean toward long setups. With the FOMC minutes due out early tomorrow and the CPI report on the horizon, volatility is expected to rise as the market attempts to form a bottom. Stick to buying on dips, manage risk carefully, and reduce leverage in this volatile environment.
Crude Oil
Crude oil closed lower, continuing its recent downtrend on the daily chart. Concerns over a global economic slowdown and increased production from OPEC nations are dampening the upside. Although the sell signal on the daily MACD remains, there's still potential for a short-term rebound toward the 5-day moving average. If trading short, make sure to set a stop-loss, especially near the strong $57 support zone, where shorting is riskier.
On the 240-minute chart, the MACD has re-crossed into a death cross, showing signs of a third wave of selling pressure. However, there's still a chance of bullish divergence, so avoid chasing short positions. The $57–$59 support range remains strong, and unless this level breaks, buying on dips offers a more favorable risk-reward ratio. Note that today's U.S. crude inventory report could introduce more volatility, so trade carefully.
Gold
Gold closed lower with an upper wick on the daily chart. While the price is still above the 0 line on the MACD, if it pulls back to the previous high resistance area, which coincides with the lower Bollinger Band and the 60-day moving average, it may present a good buying opportunity for swing trades. On the weekly chart, gold is still moving within a sideways range, trapped between key moving averages. With the FOMC minutes today and the CPI tomorrow, it's important to monitor whether the price breaks out of this range.
The 240-minute chart shows that the MACD has not yet formed a golden cross, and there's still a large gap from the 0 line. If MACD rebounds and then corrects again, it's crucial to check whether a double bottom around the 2,980 area is forming. Overall, gold remains a buy-the-dip candidate, and if the price falls to around the 60-day moving average, it could present a great swing entry.
Investor sentiment is reaching extreme levels, and we're witnessing unusually fast and wide price swings. It's hard to rely on daily or weekly charts alone, so it's important to focus on short-term price action and use appropriate leverage for your strategy.
The market will always be open. Survival and consistent profitability are what matter most in the long run. Stay disciplined, manage risk carefully, and take a long-term view as a trader.
Wishing you another day of successful trading!
If you like my analysis, please follow me and give it a boost!
For additional strategies for today, check out my profile. Thank you!

Nasdaq market analysis: 09-APRIL-2025Good morning, traders! Welcome to today's Nasdaq market analysis. Compare my price action insights with your own charts and enhance your trading skills.

Navigating the Correction using SPX, Platinum, and DXYLikely levels that all sectors tend to bottom at using Fibonacci retracement, measuring likely degrees of magnitude on falling knife bounces, as well as determining the PM sector bottom via platinum price, and looking at ratios.

NASDAQ: Cyclical correction most likely completed. ATH by June?Nasdaq remains oversold both on its 1D (RSI = 25.630) and 1W (RSI = 28.851, MACD = -442.980, ADX = 36.399) technical outlook as yesterday's rally is being corrected today on strong technical selling. Long term it looks like this was a cyclical correction, reached -25%, hit the 3W MA50/1W MA200 zone (which has been the best buy entry in the past 10 years) that has most likely been completed. In addition, the 1W RSI is on the same oversold levels as May 16th 2022, the lowest it has been since 2008. According to the Fibonacci Channel Up, the market can hit 22,300 as early as June.
## If you like our free content follow our profile to get more daily ideas. ##
## Comments and likes are greatly appreciated. ##

Today analysis for Nasdaq, Oil, and GoldNasdaq
The Nasdaq closed lower after experiencing extreme volatility the previous day. Following a gap-down open, the market attempted a bottoming process. However, the spread of fake news related to tariffs triggered a 10% intraday swing, making the Nasdaq trade more like an individual stock than a major index. Massive trading volume occurred due to margin calls from CFDs and hedge funds, and the market showed some signs of recognition around a potential short-term bottom.
On the weekly chart, the index rebounded but was resisted at the 3-week moving average. On the daily chart, a doji bullish candlestick with strong volume formed, suggesting the market may attempt another rebound. However, since volatility from the bottom remains significant, if you’re planning to enter long positions, it's best to buy as close to the bottom as possible. If the market continues to form a base, a rebound toward the 5-day or 10-day moving average on the daily chart is possible.
On the 240-minute chart, the market is still in a death cross and remains oversold. Still, it's showing signs of forming a base around the 16,500 level, so it's better to avoid chasing short positions during any pullbacks that could form a double bottom. In this oversold environment, a buy-on-dip approach near the lows is favorable for a technical rebound. But since volatility remains high, make sure to set clear stop-loss levels for both long and short trades.
Crude Oil
Crude oil experienced a gap-down on the daily chart and closed lower after hitting resistance at the 3-day moving average. On both the daily and weekly charts, the $57–$59 zone appears to be a short-term support level. If the price dips into this zone, it may offer a buying opportunity. Yesterday’s candle was resisted at the 3-day line, so if a bottoming pattern forms today, a rebound toward the 5-day moving average could be anticipated. However, since the MACD has just issued a sell signal near the zero line, it's better to treat any long positions as short-term trades.
On the 240-minute chart, the sell signal is still valid, and the market remains in oversold territory. Watching for a potential double bottom formation before entering long positions is recommended. That said, if market sentiment continues to accept economic recession as a given, oil prices could keep falling. There's also the risk of a one-way downward move, so if you're going long, ensure tight stop-loss levels are in place.
Gold
Gold saw sharp volatility and closed lower after being rejected at the 5-day moving average. Due to the weaker dollar from U.S. tariff announcements, the attractiveness of gold has diminished in the short term. On the weekly chart, gold is still forming a range-bound movement near the 10-week moving average, with support appearing near the $2,975 level. On the daily chart, the lower Bollinger Band and the 60-day moving average are rising and beginning to converge.
These overlapping indicators could form a strong support zone, so if the price drops into this area, it may present a good opportunity to buy the dip. On the 240-minute chart, the MACD and signal lines have both dropped below the zero line, and the RSI has entered oversold territory.
While this could lead to further accelerated selling, it is also a zone where a rebound from oversold conditions could easily occur. It’s best to avoid chasing the downside and instead focus on buying during pullbacks near strong support zones.
Market volatility is increasing, but this is also a zone where technical rebounds are likely due to excessive declines. While confirmation of a bottoming pattern is needed, in this kind of market, it's safer to focus on one direction rather than trying to trade both ways.
Long positions currently offer a better risk-reward ratio, so it’s advisable to enter at the lower end of the range. Reduce leverage as much as possible and always set stop-loss levels to ensure safe trading in these turbulent conditions.
If you like my analysis, please follow me and give it a boost!
For additional strategies for today, check out my profile. Thank you!

Are we done with the slide, or not? US indices are suffering right now, but is there light at the end of the tunnel?
Let's dig in!
MARKETSCOM:US500
MARKETSCOM:US100
MARKETSCOM:US30
Let us know what you think in the comments below.
Thank you.
77.3% of retail investor accounts lose money when trading CFDs with this provider. You should consider whether you understand how CFDs work and whether you can afford to take the high risk of losing your money. Past performance is not necessarily indicative of future results. The value of investments may fall as well as rise and the investor may not get back the amount initially invested. This content is not intended for nor applicable to residents of the UK. Cryptocurrency CFDs and spread bets are restricted in the UK for all retail clients.

Nasdaq trading insights: 08-APRIL-2025Nasdaq trading insights: Not signals, but informative zones to aid your decision-making. Please note: These zones are not trading advice. Use them as a starting point for your own analysis.

SoFi Technologies (SOFI) – Prepping for Liftoff?Analysis Overview:
The chart suggests that SOFI may be setting up for a major bullish reversal, but confirmation is still needed. Let’s break it down:
Key Bullish Factors:
✅ Optimal Trade Entry (OTE)
Price is currently sitting at an OTE level, a premium zone for long setups often used by smart money. These zones historically mark powerful reversal points.
✅ Monthly Fair Value Gap (FVG) Respected
The stock tapped into a monthly FVG—a high-probability demand zone—suggesting institutional interest. A break and close above this zone would strengthen the bullish case significantly.
✅ 30 Moving Average (MA) as Confirmation
Price is still below the 30MA. A clear break and close above the 30MA would serve as the first strong confirmation that buyers are regaining control.
✅ Massive Upside Potential
If this plays out, the first target is the previous buy-side liquidity at $18.33, and if momentum sustains, we could even see a long-term move toward the all-time high at $28.54—a potential 228% gain from current levels.
What We Want to See Before Full Confidence:
🔹 Price to break and close above the 30MA
🔹 Clear displacement through the Monthly FVG
🔹 Sustained bullish volume stepping in
Conclusion:
SOFI could be gearing up for a powerful upside run, but let the market confirm it. Watch the 30MA and how price behaves around the FVG. If those get respected and price pushes higher—this could be a sleeper play to watch in 2025.
🧠 As always... DYOR (Do Your Own Research)!

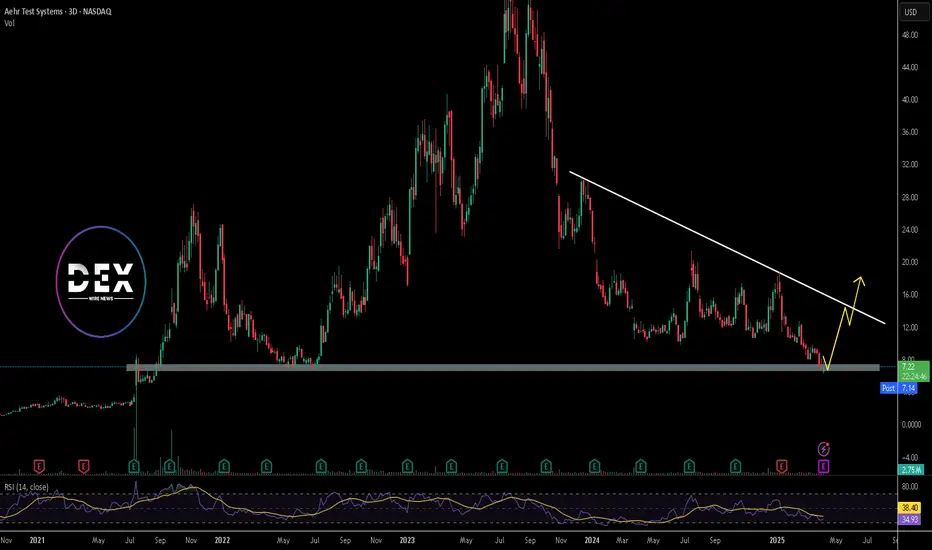
$AEHR Set to Report Q125 Financial Results Post-Market April 8thAehr Test Systems ( IG:NASDAQ : NASDAQ:AEHR ) will report its first-quarter fiscal 2025 financial results on April 8, 2025. The announcement will follow the market close and the earnings call will begin at 5:00 p.m. Eastern Time.
The upcoming report covers the fiscal quarter ending February 28th, 2025. Zacks Investment Research expects the company to post an EPS of $-0.02. This compares to an EPS of $-0.05 from the same quarter last year.
As of 3:35 p.m. EDT on April 7th, AEHR stock traded at $7.31, up $0.05(0.69%), with the price hovering above a key support level at $7.
Recent Financial Performance and Guidance
In July 2024, Aehr reported financial results for the fourth quarter and full fiscal year 2024.
For Q4 2024, revenue was $16.6 million, down from $22.3 million in Q4 2023. GAAP net income was $23.9 million or $0.81 per share. This included a tax benefit of $20.8 million. Non-GAAP net income was $24.7 million or $0.84 per share.
Bookings during the quarter totaled $4.0 million. The backlog stood at $7.3 million as of May 31, 2024. Effective backlog, including post-quarter orders, reached $20.8 million. For the full year 2024, Aehr recorded record revenue of $66.2 million. This was slightly higher than $65.0 million in 2023. GAAP net income for the year was $33.2 million or $1.12 per share. Non-GAAP net income reached $35.8 million or $1.21 per share.
Cash and cash equivalents were $49.2 million at the end of May 2024. This was an increase from $47.6 million at the end of February 2024. The company expects at least $70 million in revenue for fiscal 2025. It also projects a pre-tax profit of at least 10% of revenue.
Technical Analysis: Support at $7 Holds
AEHR stock is testing a crucial support zone at $7, a level that has shown buyer interest in the past. The stock is currently trading slightly above support as traders watch to see if it remains above this level after earnings.
A positive earnings report may offer more bull strength at the support and trigger a rebound. If the price rebounds, the next immediate target is a descending trendline resistance. The trendline has rejected prices to trade above it in recent months. This therefore acts as a strong point that will need positive market developments to break above.
However, if earnings disappoint and bearish pressure grows, the stock could fall below $7. A breakdown would however expose NASDAQ:AEHR to lower support zones and potential new lows.
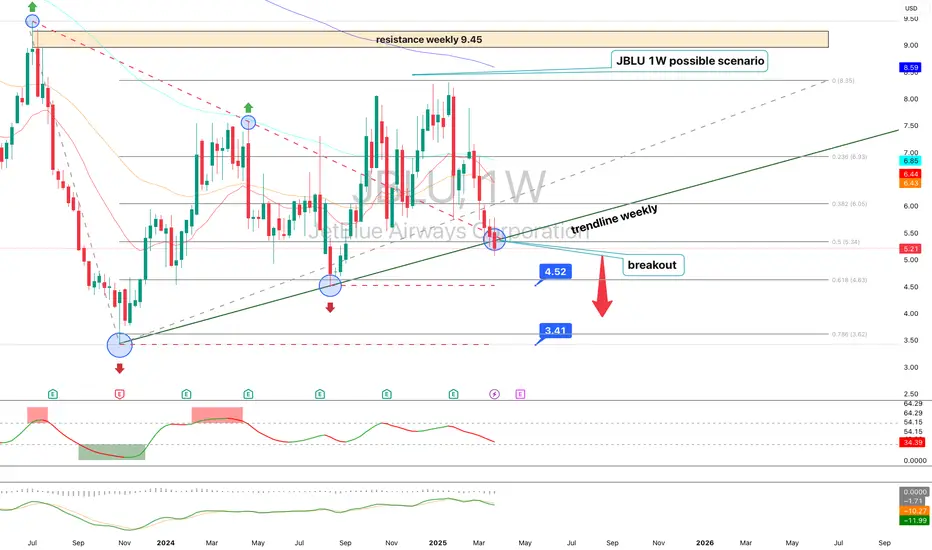
JetBlue Airways (JBLU) – Technical Analysis 1WJetBlue shares have broken a key weekly trendline, reinforcing a bearish outlook. After breaking support at $5.21, the price is heading toward $4.52 and potentially $3.41.
Technical indicators confirm the weakness: RSI shows declining momentum, MACD signals a bearish crossover, and EMA 50/200 indicate sustained selling pressure.
Fundamentally, the airline sector faces macroeconomic instability, rising Fed rates, and volatile fuel prices. A close below $5.21 will confirm the downtrend, targeting $4.52 and $3.41, while a recovery above $6.44 could signal a potential rebound.
$SPX Flirting With a Bear Market alongside $QQQ NASDAQ fell another 4% touching down 26%
S&P 500 walking a tight rope falling 21% to play with the idea of a Bear Market, but has rebounded a bit.
NASDAQ:QQQ did have a stronger response from buyers than SP:SPX
Nonetheless, we would need several WEEKLY closes sub 20% losses to enter a textbook Bear Market.

TLT - Monthly Targets (Long Term)Markets are currently tight squeezing due to Trumps terrifs etc, something has to give in, based on this chart:
- TLT has found a bid at .963 Fibonacci level @ $82.42 (EXTREME RETRACE)
- Dec 2, 2024 = the 369 ratio in time for $82.42 (time & price 📐)
NEXT TARGET PROJECTION IS 50% OF THE MAX TARGET ANGLE = ($121)
(BETWEEN 2025 - 2029)
MAX TARGET = $183 - $212
(BETWEEN 2025 - 2034)
