Apple ($AAPL): Shares Jump After Tariff Exemption on ElectronicsApple Inc. (AAPL) experienced a significant rally on Monday, climbing as high as $212.94 before settling around $206.05 as of writing, reflecting a 4.5% intraday gain. The spike followed the U.S. government's decision over the weekend to exclude smartphones and other electronics from the latest round of tariffs on Chinese imports. This move provided relief for tech companies like Apple that rely on global supply chains.
As of 3:38 PM EDT, Apple shares Volume reached 258.63 million shares, indicating heightened investor interest. The favorable news also triggered substantial profits for derivatives traders. One bullish options trade worth $5 million, opened on Friday, was reportedly valued at around $14 million by Monday morning—a 180% gain as per Reuters.
According to Capital Market Laboratories CEO Ophir Gottlieb, the trade may have been a calculated bet anticipating favorable policy moves affecting Apple or broader China-related tariffs.
Technical Analysis
The 2-day chart shows a strong bullish reaction from a major support zone near $172, where the price rebounded sharply following the news. The current price at $206 is trading slightly below key moving averages, including the 50-day at $231.81, 100-day MA at $228.36, and 200-day MA at $205.91
Price action also broke above a previous resistance area of $196, turning that level into new support. If momentum holds, Apple could aim for a move toward the $260.10 recent high. However, technical structure suggests a possible pullback before further upside continuation. Overall, the rebound and volume surge indicate strong buyer interest in the wake of the tariff announcement.
Nasdaq

Price Action: Nasdaq NDX Monday 4/14/2025In this video, we will be looking at the Nasdaq (NDX) on the daily chart and its potential Movement throughout Monday 4/14/2025.

NASDAQ Trump's 2 TRADE WARS are identical! What you need to knowNASDAQ (NDX) had a massive bullish reversal 1W candle last week as, despite a Lower Low opening, the intra-week rebound surpassed the opening of the previous week. The sell-off reached almost as low as the 1W MA200 (orange trend-line) , which has been the Support level of the late 2022 Inflation Crisis bottom and has been untouched for more than 2 year.
This is not the first time we see this pattern. In an interesting twist of events, we saw the exact same formation during Trump's 1st Trade War, which bottomed on the week of December 24 2018, near the 1W MA200 as well and exactly on the 0.382 Fibonacci retracement level from the Top.
The similarities don't stop there as both Trade War periods were manifested within Megaphone patterns. Their sell-off/ Bearish Leg was -25% (now) and -23% (2018) respectively, while the set-up leading to those Megaphones was a +103.50% and +113.50% Bull Cycle respectively. Also both sell-offs got an oversold (30.00 or lower) 1W RSI bottom.
So, since NDX has currently completed a -25% correction near the 1W MA200 and the 0.382 Fib with the 1W RSI bouncing off the oversold barrier, it is very likely that we've formed the pattern's bottom, especially if the global fundamentals point towards trade deals.
If this Low remains intact, we expect a similar +35% short-term Top at 22500 within a 3-4 month period and then long-term rally near the -0.382 Fibonacci extension at 29000.
-------------------------------------------------------------------------------
** Please LIKE 👍, FOLLOW ✅, SHARE 🙌 and COMMENT ✍ if you enjoy this idea! Also share your ideas and charts in the comments section below! This is best way to keep it relevant, support us, keep the content here free and allow the idea to reach as many people as possible. **
-------------------------------------------------------------------------------
💸💸💸💸💸💸
👇 👇 👇 👇 👇 👇

Nasdaq Technical Analysis. What Makes Nasdaq a Trader’s Favorite📊 Nasdaq Technical Analysis – Week 15, 2025
This week’s Nasdaq structure suggests a high probability of sideways movement between 19,500 and 18,700,
despite recent macro-driven volatility.
Key headlines include: – U.S. tariff adjustments & China’s 125% retaliation
– March CPI hitting the lowest level since early 2021
– Bond market instability and capital outflows
From a technical perspective:
🔹 volatility on the weekly is overheated — suggesting reduced volatility ahead
🔹 Fibonacci 0.618 near 20,084 may act as short-term resistance
🔹 Ideal long zone sits between 18,600 and 18,700, with invalidation below 18,500
(by 12H closure)
🔹 Ideal long zone sits between 18,000 and 18,300, with invalidation below 17,900
(Just a touch of 17,900 might invalidate this idea)
This analysis includes trendline setups held since 2023, confirming the value of clean charting.
A full structure review from Yearly to 4H charts is included.
No news-based guesswork. Just structured, chart-driven insight.
📌 If this chart aligns with your bias, feel free to save, comment, or follow.

Nasdaq market analysis: 14-APRIL-2025Good morning! Happy New Week! Here's your daily Nasdaq market analysis. Learn, grow, and trade wisely.

Trade the Structure: NAS100 Possible Retrace & Buy OpportunityThe NAS 100 recently broke its market structure after a twist in trade policy—with Donald Trump delaying tariffs by 90 days—which sparked a robust rally. On the 4‑hour chart, we're looking for a bullish setup where the initial surge might be followed by a pullback into a sideways accumulation zone. This consolidation is expected to form a "spring" pattern—a brief retest that could trap sellers—followed by a clear break of market structure that signals a renewed upward move. The entry is ideally on the breakout, backed by supportive volume, while risk management is maintained with a stop-loss positioned just below the range if/when price retraces into support. 🚀📈💰

Tactical US100 Trading: Converting 1W Trend into 30m Opportunity📈 The US100 index is currently exhibiting a bearish trend pattern on the weekly timeframe. We can observe a notable rally followed by a retracement into equilibrium when analyzed against the previous price wing range.
🔎 Currently, the index is positioned at a premium level, creating an environment where short sellers might be building positions in anticipation of further downward movement. However, market dynamics remain highly sensitive to external influences, particularly unexpected statements and social media announcements from influential figures like Donald Trump.
🌊 With such market unpredictability in play, focusing on shorter timeframes provides more actionable intelligence. Price action signals offer clearer guidance in this volatile environment.
⚡ Trade Opportunity: The 30-minute chart reveals a defined trading range worth monitoring. A definitive break above this range could present an opportunity to enter long positions, while a breakdown below support might signal a favorable short entry point.
🎯 This breakout strategy enables traders to respond to actual market movements rather than attempting to forecast the broader market direction—a particularly valuable approach given the current unpredictable market landscape.
⚠️ DISCLAIMER: This analysis is provided for informational purposes only and does not constitute financial advice. Trading carries significant risk of capital loss and may not be appropriate for all investors. Historical performance does not guarantee future outcomes. Always perform independent research and consider your personal financial circumstances before executing any trades. Market conditions are subject to rapid changes, and no trading methodology ensures profits. The information presented should be used as one of many inputs in your decision-making process.

Today analysis for Nasdaq, Oil, and GoldNasdaq
The Nasdaq closed higher on the daily chart. It held above 18,360 at the close, and today’s candle formed a golden cross as the MACD crossed above the Signal line, creating a potential buy signal. However, this signal will only be confirmed if the candle closes as a solid bullish bar, so it's too early to say that a buy confirmation has been established.
On the weekly chart, although the index has not yet reclaimed the 5-week MA, it has gapped above it. Overall, the index appears to be forming a box range between the 3-week and 10-week MAs, and if further upside occurs, we could potentially see a move toward the 60-week MA. However, since the MACD and Signal line on the weekly chart are still sloping downward, there's a high possibility of a medium-term pullback even if the index rallies to the 10-week MA.
On the daily chart, the index is still meeting resistance at the 20-day MA, and the key point now is whether the MACD completes the golden cross or turns downward again. Since the index has managed to hold above 18,360, the potential for a rebound remains open. Buying during pullbacks near the lower wick remains a favorable strategy.
On the 240-minute chart, the MACD is turning upward after finding support at the Signal line, forming a potential third wave of buying. In short-term timeframes, buying on dips remains favorable.
This week, the Retail Sales data is scheduled for Wednesday, and the U.S. markets will be closed on Friday. Please keep that in mind for risk management.
Crude Oil
Crude oil closed higher in a narrow range on the daily chart. On the weekly chart, a long lower wick formed, finishing with a doji candle, suggesting indecision. Last week, oil was rejected at the 3-week MA, forming an upper wick. If it rallies this week, it could target the 5-week MA. The $65 level, near both the 5-week and 240-week MAs, remains a strong resistance zone, making it a potentially favorable area to consider short trades.
On the daily chart, oil has entered a box range between the 5-day and 10-day MAs. Though the MACD and Signal line still point downward, oil is currently holding within a supportive range. There is a possibility the MACD could begin to turn upward, so keeping both bullish and bearish scenarios open is advisable.
On the 240-minute chart, the MACD is still rising after a golden cross but remains below the zero line, suggesting a potential for another pullback. Overall, monitor intraday movements and continue to trade within the range.
Gold
Gold closed higher, setting a new all-time high. The weekly chart formed a strong bullish candle, resuming its upward trend. Buying near the 3-week MA remains favorable. As the price has overshot the previous target of $3,216, we’ve now entered an overshooting zone, making it difficult to define the next resistance. Therefore, caution is advised for short positions, and it’s best to focus on buying the dips.
On the daily chart, the new all-time high generated a bullish signal, and buying near the 3-day MA is recommended. Gold may enter a sideways consolidation phase while aligning its moving averages. In that case, buying near the 5-day MA may also be considered, but avoid chasing the price higher.
The MACD has made another golden cross, and it’s important that the MACD doesn’t create a divergence by failing to surpass its previous peak. Avoid shorts, and stick with buy-the-dip strategies. On the 240-minute chart, buying momentum remains strong. The RSI is in overbought territory, so again, avoid shorting and focus only on buying during pullbacks.
Market Outlook
Compared to the last two weeks of high volatility, this week is expected to be more subdued. After a period of extreme moves, the market is likely to consolidate and seek direction. Rather than swinging for home runs, it's better to focus on small base hits and steadily build profits.
Wishing you a successful trading week!
If you like my analysis, please follow me and give it a boost!
For additional strategies for today, check out my profile. Thank you!

Golden Rule: Charts always predict the newsI've reviewed a recent trade I was in and a useful lesson we can learn from it.

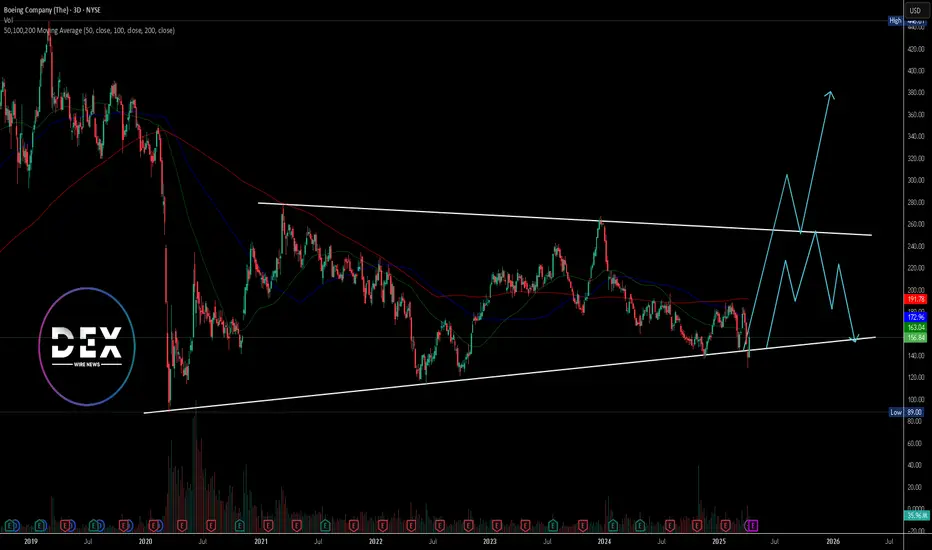
Boeing ($BA) Faces Renewed Scrutiny After Latest Safety ConcernsBoeing (NYSE: NYSE:BA ) stock closed at $156.84 on April 11, gaining 0.85% despite fresh concerns surrounding delayed aircraft deliveries. China's Juneyao Airlines recently postponed the delivery of a 787-9 Dreamliner, originally valued at $120 million. The decision comes amid renewed U.S.-China trade tensions driven by tariff escalations from President Trump’s administration.
This delay could disrupt Juneyao’s planned expansion into European routes this summer. The Dreamliner, known for its long-range capabilities, was central to these international plans. The incident signals how geopolitical strain continues to impact global aviation and commercial aircraft deals.
Boeing has already cautioned that additional tariffs may put more pressure on supply chains. These chains had only recently begun to stabilize following years of pandemic-related disruptions. The company remains exposed to evolving international policies, which can affect order fulfillment and investor sentiment.
Earnings for Boeing are expected on April 23, 2025. Investors are watching closely for guidance on production capacity, deliveries, and any fallout from global trade developments.
Technical Analysis
Boeing is trading within a broad wedge pattern marked by long-term support and resistance trendlines. Price recently bounced from the support, rising sharply to the current level of $156.84. The 50, 100, and 200-day moving averages sit at $163.04, $172.96, and $191.78 respectively.
These levels now act as dynamic resistance. Price remains below all three, signaling overall bearish pressure unless a breakout occurs. A breakout above the resistance trendline may lead to a rally. However, if price fails to gain momentum and breaks below the lower trendline, it could revisit the $89 low from 2020.
MNQ!/NQ1! Day Trade Plan for 04/11/2025MNQ!/NQ1! Day Trade Plan for 04/11/2025 (Just because 😏)
📈18670 18820
📉18220 18060
Thanks to all my followers! Truly appreciate the support!
Please like and share for more NQ levels Tues & Thurs 🤓📈📉🎯💰
*These levels are derived from comprehensive backtesting and research and a quantitative system demonstrating high accuracy. This statistical foundation suggests that price movements are likely to exceed initial estimates.*

Electronic Arts Inc. Stock Sees Momentum Ahead of Earnings Electronic Arts Inc. (NASDAQ: NASDAQ:EA ) is gaining attention as the gaming industry shows signs of recovery. The stock closed at $142.93 on April 11, 2025, reflecting a gain of $3.54( 2.54%) for the day. Its next earnings report is scheduled for May 6, 2025.
The gaming industry grew rapidly during the COVID-19 pandemic but saw a decline as restrictions lifted. In 2024, inflation and lower spending led to layoffs and studio closures, though upcoming game releases may support a recovery.
EA is a major player in digital entertainment. It develops and distributes games across platforms, including consoles, mobile, and PCs. Popular titles in its lineup include EA SPORTS FC, Battlefield, Apex Legends, The Sims, Madden NFL, Need for Speed, Dragon Age, and Plants vs. Zombies. Billionaire investors continue to show confidence in EA, placing it among the top gaming stocks.
Technical Analysis
EA recently bounced sharply from the support zone around $115. This level aligns with a previous support zone. A strong bullish candle followed, with high volume pushing the price above key moving averages. Currently, EA trades near $143. The 50-day moving average is at $144.38, the 100-day at $141.01, and the 200-day at $133.68. These are levels that are likely to support the price in case of further declines.
The RSI stands at 52.41, showing neutral momentum. Next potential move suggests a short-term pullback before continuation. If the stock breaks above the immediate target and ascending trendline resistance, the next target lies near $168.50 previous high. EA is showing strength both fundamentally and technically as it approaches its next earnings release.

DoorDash (NASDAQ: $DASH) Gains Strength Ahead of May EarningsDoorDash, Inc. (NASDAQ: NASDAQ:DASH ) is showing strong momentum in a volatile market. As of April 11, DASH closed at $180.49, up 1.10% for the day. The stock has risen about 9% year-to-date, while the overall Computer and Technology sector has dropped around 11.8%. This places DoorDash ahead of many of its peers.
DoorDash belongs to the Computer and Technology group, which ranks #6 out of 16 sectors based on the Zacks Sector Rank. The company currently holds a Zacks Rank of #2 (Buy), signaling positive analyst sentiment. Over the last three months, analysts have revised DoorDash's full-year earnings estimate up by 14.7%. This indicates growing confidence in the company’s future performance.
Investors are now watching closely as DoorDash prepares to release its earnings report on May 7, 2025. The stock's upward trend and revised estimates may influence how it reacts to the upcoming results.
Technical Analysis
The daily chart shows that DASH recently bounced off a strong support zone around $162. This zone has acted as a demand area before, pushing the price higher in past sessions. Currently, DASH is approaching key resistance level at $200. A break above these could lead the stock toward the recent high at $215.25. The chart also suggests a possible retracement before a new leg up, reflecting a bullish continuation structure.
Volume increased during the bounce, indicating strong buying interest. RSI is at 48.16, which suggests neutral momentum with room for further upside. DoorDash remains one to watch heading into earnings season.

Netflix Earnings Growth Expected As It Prepares For Q125 ResultsNetflix (NASDAQ: NASDAQ:NFLX ) is set to report its earnings for the quarter ending March 2025 on April 17. Analysts expect year-over-year growth in both revenue and earnings. However, consensus earnings per share (EPS) estimates have been revised down slightly by 0.07% over the past 30 days. This suggests a cautious outlook among analysts.
At the close on April 11, Netflix stock traded at $918.29, down by 0.31%. In after-hours trading, the price edged slightly higher to $919.80. The stock traded with a volume of 4.07 million shares. RSI stands at 47.76, reflecting neutral momentum.
The final result could trigger a sharp price move. A positive earnings surprise might push the stock higher. On the other hand, a miss could lead to a decline. The outcome will also depend on management’s commentary during the earnings call.
Technical Analysis
On the daily chart, Netflix recently bounced off a key demand zone near the $820–$830 range. This zone had previously served as a strong support area. After touching this level, the price formed a reversal candle, signaling potential buying interest.
The stock is now hovering around $918.29, near the 50-day and 100-day moving averages at $961.61 and $931.24, respectively. If the price clears these levels, it may aim for the recent high of $1,064.50. A short-term retracement could occur before a possible continuation higher.
Volume analysis shows a spike during the bounce from support, indicating accumulation. The price pattern suggests a bullish structure is forming. Overall, eyes remain on the April 17 earnings report for the next major move, which might see Netflix surge to a new all-time high.

$QQQ Poised for Lift-Off: Flipping Resistance, Eyeing $470-$475!🚀 NASDAQ:QQQ Poised for Lift-Off: Flipping Resistance, Eyeing $470-$475! 🚀
As mentioned in my recent post, we’ve successfully flipped the $443.14 resistance into support—a key technical shift!
🔹 Momentum Building:
- Wr% Indicator: Making higher lows and advancing steadily towards the Red Barrier.
- Volume Gap: Still in play and ready to be filled.
With a higher low now established, I believe we’re set up for a potential move to $470-$475 next week.
📈 Let’s see how this plays out—exciting times ahead!
💡 Have an amazing weekend, friends!
Not financial advice

Janover Stock Spike 1100% After Completing First Solana PurchaseJanover (NASDAQ: NASDAQ:JNVR ) has invested over $9.6 million into Solana (83,000+ SOL) as part of a new digital asset treasury strategy, with plans to stake its holdings and run validators to generate onchain revenue.
The move follows a $42 million funding round and has triggered a 1,100% surge in Janover’s stock price as the company positions itself as a transparent, publicly traded vehicle for crypto exposure.
The company bought $4.6 million of Solana’s SOL token on Thursday. Earlier this week, Janover announced that it raised $42 million through the private offering of convertible notes and warrants, with plans to acquire SOL.
Janover shares were last higher by more than 64%, after skyrocketing more than 1,100% earlier in the day.
“Our aim is to be the most efficient and transparent vehicle for crypto accumulation in the public markets,” Janover CEO Joseph Onorati said in a statement Thursday. “Executing our first SOL purchase within days of completing our restructuring reflects that commitment.”
Janover, a software company founded in 2018, on Monday announced a new crypto-focused treasury management strategy after a team of former executives from the popular Kraken crypto exchange acquired majority ownership of the firm. It also plans to change its name to DeFi Development Corporation and revise its ticker symbol.
As of the time of writing, the stock is up 13.88% with the RSI at 58.77 there could be room for more bullish campaign. Similarly, the 45 -minute price chart depicts a cup formation with the handle still forming- this is typically identified as a bullish pattern.

Nvidia (NASDAQ: $NVDA) Shares Rally Amid AI Sector OptimismShares of Nvidia Corporation (NASDAQ: NASDAQ:NVDA ) have gained over 3% on Friday 11th April. The positive results come after U.S. markets rallied on tariff news. President Trump announced a 90-day pause on new tariffs. Reciprocal tariffs for most countries dropped to 10%, sparking investor optimism.
Major U.S. indices rose sharply following the announcement after being under pressure from rising trade tensions. The pause was seen as a welcome shift toward calmer negotiations.
However, Trump excluded China from this relief. Instead, he stated that tariffs on Chinese goods would increase to 125%. This came after China announced new retaliatory tariffs on U.S. imports. The tough stance toward China contrasted with the softened approach to other countries.
Despite the relief, market uncertainty remains. Investors are unsure whether the rally will last. Ongoing trade disputes, especially with China, could disrupt momentum.
Nvidia's price rose to $110.78, gaining $14.99 on Friday's session. The stock reached an intraday high of $111.53 and a low of $107.48. The current resistance sits at $153.13 high.
Technical Analysis
Nvidia bounced sharply off the $92 support zone, highlighted by strong buying pressure. The RSI sits at 49, indicating neutral momentum. A clear resistance lies near $153.13 high. If Nvidia breaks this level, a move toward $180 is likely. If it fails, price may revisit the $92 zone. Two scenarios are possible. The stock could either continue upward to $180 or face rejection and fall back. Watch the $153 level closely for confirmation.

NASDAQ 19200 POTENTIAL BREAKOUTKey important level holding 18k after important catalyst 90 days tariffs pause.
Looking this levels, for a major move in next weeks

NAS100 Triangle Apex – Breakout or Breakdown ImminentBullish View:
• Price is forming higher lows and holding above the lower ascending trendline.
• A breakout above the upper descending trendline near 18,500 would confirm bullish
momentum.
• If the breakout is sustained, potential upside targets include 18,650 and 18,800.
Bearish View:
• Price has tested the lower support trendline and shown weakness near the apex of the
triangle.
• A breakdown below 18,100 would indicate bearish momentum and invalidate the ascending
structure.
• If the breakdown is sustained, potential downside targets include 17,950 and 17,700.

NASDAQ heading lowerNasdaq looks to be in the ABC pull back just before another nasty 1,2,3,4,5 down. It always surprises me how many investors buy back in here. Its weird. Suckers rally. But they cant help themselves, the bargains are just too good.

Warning: what can save us from a collapse: must read.⚠️This analysis isn’t purely chart-based, but in this macro environment, understanding the bigger picture is essential for predicting market movements. Hopefully, TradingView will allow this idea so that everyone can read it.
What Can Save Us?
Before looking for a solution, we must first acknowledge the problem—and then determine if and when a resolution is coming.
1. Trump’s Tariffs & Policies: A Market Shock
Trump’s economic strategy marks a radical departure from the policies of the past 30 years. However, previous administrations weakened U.S. global influence, shifting power in favor of China.
Since Trump's motto is "Make America Great Again", serious changes are inevitable. Until investors fully grasp these policies, uncertainty will persist.
Let’s break down the key areas of impact and Trump’s expected responses:
2.Monetary Policy & The Federal Reserve
The Federal Reserve (FED) and Jerome Powell are not aligned with the White House.
Powell is sticking to his monetary policy approach, but Trump needs 0% interest rates to implement his vision.
Markets hate uncertainty, and this is fueling volatility.
🔴 Trump's Response:
Expect a bombshell move—Trump will fire Jerome Powell and replace him with a Fed chairman who supports rate cuts to 0%. This will cause short-term chaos but ultimately fuel a massive market rally as:
✔️ The housing market recovers
✔️ Liquidity surges
✔️ Stocks skyrocket
3.U.S. Dependence on China & Russia for Raw Materials
The U.S. imports essential resources from China and Russia, making it vulnerable.
The BRICS alliance is strengthening, further threatening U.S. dominance.
🔴 Trump's Response:
Trump has openly expressed interest in acquiring Greenland, citing its rich natural resources. He will take it by military force if necessary, positioning the U.S. as a raw material powerhouse on par with Russia.
4.Lost Allies: Canada, Mexico & South America
Canada is aligning with Europe
Mexico & South America are leaning towards BRICS
🔴 Trump's Response:
To counter this:
Canada will be pressured into rejoining a U.S.-led trade bloc—or face potential annexation.
South American economies will be crippled by tariffs, forcing them to reintegrate under U.S. influence.
5.Geopolitical Conflicts: Middle East & Ukraine
Iran is aligned with Russia & China
Ukraine relies on Europe (France, UK, EU), rather than the U.S.
The U.S. is not benefiting from these wars
🔴 Trump's Response:
If Zelensky continues to align with Europe, Trump may order a full-scale U.S. bombing of Ukraine, flatten Kyiv, eliminate Zelensky live on TikTok, and then split Ukraine with Russia.
This move would:
✔️ Strengthen U.S.-Russia relations
✔️ Secure a deal on Greenland
✔️ Humble Europe
6.Conclusion: A Global Power Shift
Expect a period of chaos and fear. However, what investors must understand is that Trump is 100% serious about these moves—and he will execute them regardless of global opinion.
If Trump’s strategy works:
✅ The U.S. will regain dominance
✅ Markets will rally hard
✅ Confidence in the U.S. economy will be restored
If Trump fails:
🚨 A prolonged economic downturn (15-20 years of stagflation)
🚨 U.S. & Europe suffer major losses
🚨 Best move? Relocate to Asia or the Middle East before the crash.
So, even if Trump’s policies seem insane, the best-case scenario is that he succeeds.
💡 DYOR (Do Your Own Research)
#Bitcoin #Crypto #Trump #MAGA #Geopolitics #StockMarket #SPX500 #Trading #Investing #Economy #FederalReserve #RateCuts

Actionable Nasdaq insights: 11-APRIL-2025Rise and shine, traders! Start your day with actionable Nasdaq insights. Let's grow your skills together, one chart at a time.

Today analysis for Nasdaq, Oil, and GoldNasdaq
The Nasdaq closed lower following news of additional tariffs on China. On the daily chart, the index failed to break above the 20-day moving average and pulled back to the 5-day MA, continuing its box-range movement. Since the 5-day MA is still acting as support, the current trend can still be seen as a sideways consolidation, with 18,500 acting as a central pivot level.
The MACD on the daily chart has not yet clearly broken above the Signal line, so it remains uncertain whether it will make a golden cross with additional upward momentum, or turn downward again. Thus, it’s best to adopt a neutral range-bound trading strategy, keeping strict stop-losses on both sides.
On the 240-minute chart, both the MACD and Signal line have moved above the zero line, entering a key area to observe whether the third wave of MACD upside begins after this box-range consolidation. Since the current price is correcting after a rebound from a double bottom, and is maintaining the center of the prior bullish candle, buying remains more favorable. Unless the previous day’s low is broken, it’s better to stay buy-biased.
Please note that today's PPI data release is scheduled, which may lead to increased volatility around the announcement time.
Crude Oil
Crude oil closed lower with a large bearish candle. On the daily chart, it failed to hold the 5-day and 10-day moving averages, breaking below the 5-day MA. The MACD continues its downward slope, and unless oil clearly reclaims the 10-day MA, the market will remain bear-biased.
There is resistance now at the 3-day and 5-day MAs, so it’s important to see whether further downside unfolds. As previously noted, the $59 level is a key support zone — watch closely for any breakdowns.
On the 240-minute chart, the MACD is trending up and pulling the Signal line along, but both remain below the zero line. If oil continues in a box range but the MACD turns downward again and forms a dead cross, there could be another leg lower. For now, continue to focus on buying near the $59 level, and maintain a range-trading approach until further confirmation.
Gold
Gold closed higher with another strong rally. On the daily chart, the MACD has now crossed above the Signal line, generating a buy signal. However, this signal will only be valid if today’s candle closes as a bullish bar, so watching the daily close is critical.
Gold hit new all-time highs during the pre-market session, with the long-awaited 3,216 level, which has been the target since March, now within reach. Beyond this level, we enter the overshooting zone, where it’s difficult to define a precise top. Therefore, it's best to stick to dip-buying strategies, as safe-haven demand continues to surge.
Even though the MACD has crossed bullishly, divergence may form if the current MACD fails to exceed the previous peak. Avoid chasing long positions at the top; instead, look for entries during pullbacks.
On the 240-minute chart, the MACD has climbed above the zero line, showing a strong one-way bullish trend. RSI across intraday charts is now in overbought territory, so it’s best to avoid short positions entirely for today.
Market Sentiment & VIX
Looking at the VIX index, the daily candle has once again broken above the 5-day MA, indicating that volatility could expand further at any time. With Trump’s remarks shaking markets, it’s impossible to predict what new developments might emerge over the weekend.
Avoid holding overnight positions due to heightened headline risk, and make sure to wrap up this trading week with solid risk management.
Wishing you a profitable trading day!
If you like my analysis, please follow me and give it a boost!
For additional strategies for today, check out my profile. Thank you!
