Short Position - NASDAQShort Position Entry: Consider initiating a short position if the Nasdaq-100 Index falls below 21,000.
Stop Loss (SL): Set a stop loss at 21,555 to manage potential losses.'
Market Sentiment: The combination of the Federal Reserve's cautious approach and rising inflation may contribute to a weakening market sentiment, potentially leading to a downward movement in the index.
his recommendation is for educational purposes only. Always consult your financial advisor before making any investment decisions. Stock trading involves risks, including the potential loss of capital. Ensure to evaluate your risk tolerance and conduct thorough research.
Nasdaq

NASDAQ CRASH: Are We in a Bear Market? Let’s Break it Down!The NASDAQ 100 (NDX) just took a huge dive, dropping 21.69% from its recent highs. That officially meets the definition of a bear market (a decline of 20% or more). The question is: Are we going lower, or is a reversal coming? Let’s analyze the moving averages, Fibonacci levels, and key market signals to figure out what’s next.
📊 Moving Averages Breakdown: A Bearish Trend Confirmation?
One of the biggest red flags here is how the price is behaving relative to its moving averages:
🔴 Short-Term Moving Averages (Yellow & Green - 9 EMA & 21 EMA)
These are the fastest-moving indicators and help us track momentum.
The price has been consistently closing below them, showing strong bearish pressure.
Whenever the price tries to bounce, it gets rejected at these levels, signaling weak demand.
🟠 Mid-Term Moving Averages (Orange - 50 MA)
The 50-day moving average acts as a key support/resistance zone in many market trends.
In this chart, we saw a breakdown below the 50 MA, and since then, the price hasn’t even attempted to reclaim it.
This suggests that even mid-term traders are losing confidence, leading to further selling pressure.
🔵 Long-Term Moving Averages (Blue - 200 MA)
The 200-day moving average is a critical level for defining long-term trends.
Right now, the index is trading well below the 200 MA, which signals a major trend shift—we're no longer in a bull market.
The further we move away from this level, the harder it becomes for bulls to regain control.
➡️ Conclusion: All key moving averages are trending downward, and the price is failing to reclaim even short-term levels. This means we are likely in a sustained bear market unless we see a major reversal.
Key Fibonacci Levels & Market Structure
We are currently testing the 1.618 Fibonacci extension at 17,268. If this level fails, we could see further downside towards 15,771 (2.618 Fib) or even lower.
Any bounce will face major resistance at 18,500 - 19,100, where multiple Fib retracements and moving averages converge.
🔥 What’s Next?
If buyers step in at 17,268, we might see a relief rally.
If we break below it, expect 15,771 or even 14,273 to be the next downside targets.
Watch the moving averages closely if we start reclaiming the 9 & 21 EMA, that could be an early sign of a recovery.
Are we heading deeper into a bear market, or is this just a big correction before another bull run? Drop your thoughts below!

NASDAQ tanking! Do the right thing and CUT RATES NOW Jerome!The market is collapsing, China is retaliating with 34% tariffs and Powell is making jokes!
Well that pretty much sums up the market news since yesterday, with Nasdaq / US100 having the worst day since the COVID crash 5 years ago while President Trump shouting 'the market is going to boom'.
Today China imposed 34% reciprocal tariffs on imports of U.S. goods and the worst of all.. Jerome Powell on his speech a little earlier was making jokes about his purple tie, avoiding to address the elephant in the room and take action!
Nasdaq is testing the August 5th 2024 Low, having crossed even under the 1week MA100 for the first time since May 15th 2023! At the same time the 1week RSI just got oversold at 30.00.
Reminds you of something? Yes that's right the last time Nasdaq broke under its 1week MA100 that fast and got oversold on its 1week RSI was on the week of March 16th 2020: YES the COVID crash.
What happened then? Well dear old Fed stepped up, did what they HAD to and cut rates to near zero (0.25%).
Even President Trump tweeted just a few hours ago that Powell should cut rates now and stop playing politics!
Tariffs are in place and they will pay off very well in the long term. On the shorter term, it is in Powell's hands save the economy.
-- Do the right thing and finally CUT THE RATES Jerome! --
Follow us, like the idea and leave a comment below!!

Short-Term Gamble on a NASDAQ Bounce Using TQQQIn this quick update, I’m taking a speculative short-term trade on a possible NASDAQ recovery after a steep sell-off. Was the market oversold—at least for a day? Maybe. Do I think the pain is over for the longer term? Probably not.
I’m using NASDAQ:TQQQ , a 3x leveraged ETF that tracks the NASDAQ-100 (the top 100 non-financial stocks in the NASDAQ). This means if the index moves up 2%, TQQQ should theoretically gain roughly 6%, and vice versa on the downside. Leveraged ETFs like this are high-risk, time-sensitive instruments—they’re designed for short-term trades, not buy-and-hold investing.
The idea here is that after a sharp drop, institutions might step in to scoop up oversold tech stocks, creating a brief rebound. If that happens, TQQQ could give me amplified upside. But this is purely a gamble—I’m under no illusion that the market has bottomed. In fact, I expect more downside ahead.
I entered in the after-hours session once some of the heavy bearish volume faded, and I’ve set a tight 5% stop-loss to manage risk. Yes, I could get shaken out by an early dip before any rebound, but the stop is there to protect me if the sell-off continues.
This is a high-risk, short-term trade—buyer beware. If you’re considering TQQQ, understand the risks: decay from daily resetting leverage, extreme volatility, and the potential for rapid losses.
I’ll update on how this plays out. Wish me luck in the comments below 😁
Real question is where to take profit...

Agape ATP's $24 Billion Breakthrough! In a market landscape clouded by macroeconomic uncertainty and weakening sentiment, Agape ATP Corporation (NASDAQ: ATPC) has emerged as a countercyclical outlier with its recent announcement of two landmark Sales and Purchase Agreements (SPAs) worth approximately USD 24 billion. Signed with Swiss One Oil & Gas AG, these agreements mark a bold step forward for ATPC, setting the stage for an ambitious entry into the refined fuels distribution market on a global scale.
The SPAs follow a successful Initial Corporate Purchase Order (ICPO) completed in February 2025, which served as a proving ground for initial trial shipments. Under the terms of the agreements, ATPC will initially supply 200,000 metric tonnes of EN590 10PPM diesel and 2 million barrels of Jet Fuel A1 in March 2025. Following successful execution of this validation phase, the contracts are structured to scale rapidly to weekly deliveries of 500,000 metric tonnes of diesel and 2 million barrels of Jet Fuel A1 — an exponential increase that underscores the strategic ambition of both parties.
All deliveries will be conducted using Free on Board (FOB) procedures at major international ports, with product quality certified by SGS or equivalent agencies in accordance with ASTM/IP standards. This not only enhances transparency and credibility but also signals ATPC's commitment to international compliance and operational rigour.
What makes this deal truly transformative is the sheer scale of the undertaking. If executed to full potential, weekly deliveries of 2 million barrels of jet fuel would translate into an annual supply of roughly 104 million barrels — equivalent to around 2% of total annual U.S. jet fuel consumption. Such volume would position ATPC as a serious contender within the global energy trade ecosystem, shifting its profile from a relatively obscure player to a recognisable force in refined fuel logistics and supply.
The structural staging of the agreement — trial, validation, then full-scale execution — reveals a commercially astute strategy. It reduces upfront risk and capital exposure while providing room for operational ramp-up and systems optimisation. However, the magnitude of the weekly delivery requirements suggests that ATPC must urgently enhance its logistical capabilities, secure dependable supply sources, and establish robust quality assurance and compliance frameworks.
From a financial standpoint, the implications are staggering. The USD 24 billion value of the agreements stands in stark contrast to ATPC's current market capitalisation of just USD 5.17 million — a disconnect representing a multiple of over 4,600 times. While such disparity is not uncommon in early-stage high-growth stories, it highlights the importance of scrutinising the company’s readiness to scale operationally and financially.
Under FOB terms, ATPC will bear the cost of acquiring and transporting the fuel to the port of loading, thereby requiring significant working capital. Timely financing and cash flow management will be paramount, especially as delivery volume scales. Questions surrounding margin structure, procurement reliability, and commodity price hedging strategies will need to be addressed to fully appreciate the risk-return profile of this venture.
Yet, amid broader market softness and investor caution, ATPC’s bold strategic execution stands out. If the company successfully navigates the complex logistics, financial demands, and operational scale-up, this agreement has the potential to redefine its financial trajectory and long-term shareholder value.
In an era where execution is everything, Agape ATP’s audacious move could very well prove prescient. Investors will be watching closely — not just for signs of progress, but for proof of delivery.
Article inspired by Stock Titan.

BUY NASDAQBeen a while since I last posted about the American market, you can buy and target the same level as mine.
Follow for more!

Today analysis for Nasdaq, Oil, and GoldNasdaq
The Nasdaq closed sharply lower due to the aftermath of tariff impositions. Following a significant gap-down, the index broke below the lower Bollinger Band, intensifying selling pressure. Yesterday’s bearish candlestick confirmed a sell signal, leading to an expanded third wave of selling. The index has now reached the previous support zone near 18,500, with additional volatility expected due to today’s Non-Farm Payrolls (NFP) report and Fed Chair Powell’s speech.
On the monthly chart, the Nasdaq is forming a lower shadow around the 20-month moving average. Given the sharp decline, if further selling occurs, oversold conditions may trigger a strong rebound, making it risky to chase shorts at this stage. The 240-minute chart also shows a sell signal, with heavy selling pressure continuing. However, this is a risky zone to enter new short positions, so it's advisable to monitor short-term price movements before making a move.
Regardless of whether you take long or short positions, due to high volatility, make sure to set stop-loss levels and adjust leverage to a manageable risk level.
Additionally, the VIX surged, forming a large bullish candle and reaching its March 11 high. With the VIX in an uptrend and a buy signal appearing, further volatility expansion is likely. However, since it has reached a key resistance zone, a short-term pullback in the VIX could allow for a Nasdaq rebound. For the VIX to break above its previous high, a period of consolidation may be necessary. Given the strong buying momentum on both the weekly and monthly charts, this should be taken into consideration when forming a trading strategy.
Crude Oil
Crude oil plunged following the OPEC meeting, where supply increases became a key issue. While oversupply concerns are a factor, the economic slowdown fears from tariffs have also played a major role in the decline. Previously, $68 was considered a strong support level, but oil collapsed from $72 in a steep decline. The final key support lies around $66.
On the daily chart, the MACD and signal line are converging near the zero line, suggesting that once a new wave begins, it could lead to a strong trend movement. Depending on today's session and Monday’s market, oil could see an aggressive breakout in either direction. Current candlestick patterns indicate that the weekly chart remains bearish, meaning holding long positions over the weekend carries significant risk.
The 240-minute chart also confirms a strong sell signal, with MACD plummeting. Oil may form a temporary sideways range near the $66 support, but if this level breaks, selling pressure could intensify. Ensure you manage stop-loss risks carefully in case of further downside.
Gold
Gold declined, reacting to fluctuations in the U.S. dollar's value. The price failed to hold above $3,200 and dropped below the 5-day moving average. Gold has been in a one-way trend, so a bullish approach remains valid unless it breaks below the 10-day MA. However, it has now entered a range-bound phase, and MACD on the daily chart is nearing the signal line, suggesting potential downside risks. The MACD failed to break its February highs, increasing the likelihood of divergence, which could trigger a strong correction if selling intensifies. With rising market volatility and today's NFP release, further wild swings in gold prices are expected.
The 240-minute chart has shown a sell signal, leading to a sharp decline. However, the price has found support near a key resistance-turned-support zone. Since the MACD and signal line remain above the zero line, gold may continue trading within a range in the short term. On shorter timeframes, candlestick volatility is high, so reducing leverage and widening stop ranges would be a prudent strategy.
During periods of extreme market volatility, technical analysis may become less effective, as market sentiment often overrides chart patterns. As always, trade only within your manageable volatility range. The market is always open, so even if you incur losses, there will always be opportunities to recover. Manage risk wisely, and best of luck with your trades today!
If you like my analysis, please follow me and give it a boost!
For additional strategies for today, check out my profile. Thank you!

Are Time and Reason in Harmony in SPX?Are Time and Reason in Harmony in SPX?
S&P 1D Technical and Fundamental Analysis;
This structure, which looks like an ordinary decline on the SPX daily chart ... in fact, we can say that it carries the pieces of a big scenario that develops synchronously both technically and fundamentally.
Let me explain now;
5 December 2024 was not just a breaking point. Because Trump's statements after taking the presidency for the second time, especially the message that ‘customs walls may rise’ had become clear.
In the same week, the uptrend in SPX quickly weakened and declined as the FED gave the message ‘Interest rate cut is not imminent’.
From here, Bullish Sharq started the formation of harmonic formation.
Now comes the week of 1 May.
- FED's interest rate decision,
- Trump's budget plan,
- And one of the critical macro thresholds where company balance sheets are announced.
While everything is going well so far, if we take into account that the chart will also touch a strong trend line, it may mean ‘either a bounce or a collapse from here’.
Because the price in the market does not just move, it looks for reasons .
I would also like to ask you here;
What will greet the market when this date comes?
Harsh interest rate rhetoric?
Trump's aggressive economic agenda?
Or a recovery supported by positive balance sheets?

NQ - Nasdaq's potential to reboundThe Median or Centerline:
The Median (Centerline) Line is the central element of the Pitchfork and acts as the equilibrium point. Price tends to oscillate around this line, and it often serves as a strong reference for potential reversals or price targets. A price move back toward the Median Line is common after significant moves away from it.
Pitchfork (Red):
The red Pitchfork, drawn through significant price points, provides the overall trend direction and shows the potential path to the downside. The red line indicates a bearish bias in the current setup, as it has been guiding the price lower.
Green Circles and Arrows:
These represent key areas of support.
The lower green circle and green arrows indicate price has found solid support in this region. The price has been bouncing from this support level, showing that it is reacting to the [ower boundary of the Pitchfork. This behavior aligns with the rule that the price tends to respect these boundaries, creating a foundation for a potential move back toward the Median Line.
Price Action Analysis:
The price recently tested the lower green circle and green arrows, bouncing off this support level, which is a typical reaction in a Pitchfork setup.
According to the Median Line theory , when the price moves too far away from the Median Line, it often returns toward it. Therefore, the bounce off the lower boundary suggests that price may now be setting up for a bullish reversal toward the RED Median Line .
Bottom Line:
The price action is following the general Pitchfork playbook . The bounce from the lower green circle suggests that the price is setting up for a potential bullish reversal toward the RED Median Line .
The next major test will be the upper resistance in the red Pitchfork , after the break of the Centerline. If the price can break through this resistance, a strong move higher is likely.
Keep an eye on this critical point!

Nasdaq market analysis: 04-APRIL-2025Good morning. Welcome to today's Nasdaq market analysis and educational insights for price action traders.

Combined US Indexes - Lower High checked; Lower Low next...As expected from previous analysis, there is a lower high likely as the TD Sell Setup is Perfected. This just missed the target but has the TD Bear Trend intact
Following, a Bearish Engulfing pattern plus a Gap Down occurred yesterday.
Breaking back into Extension Zone box... and likely to protrude out the other side.
MACD is turning down in the bearish zone too.
So, looking for a lower low now...

Nasdaq's Drop: A Temporary Rebound Before More Downside?I've been calling for a strong correction in the Nasdaq (and all major U.S. indices) since the start of the year—long before the tax war even began. I warned that a break below 20,000 was likely, with my final target set around 17,500.
And indeed, the index has fallen—regardless of what the so-called "cause" might be. Right now, Nasdaq is trading at 18,400, sitting right at a minor horizontal support zone.
________________________________________
A Short-Term Rebound Before More Downside?
📉 Overall Bias Remains Bearish – The broader trend still points lower.
📈 Rebound Likely – A push above 19,000 in the coming days wouldn’t be surprising.
⚠️ High-Risk Setup – Going long here is risky, given the current macroeconomic backdrop.
________________________________________
Trading Strategy: Short-Term vs. Long-Term
✅ For Short-Term Traders & Speculators – A temporary upside correction could offer a buying opportunity.
❌ For Swing & Long-Term Traders – It's better to wait for this rebound to fade and position short for the next leg down.
While a bounce could be on the cards, the bigger picture still points lower—I remain bearish in the long run. 🚀
Disclosure: I am part of Trade Nation's Influencer program and receive a monthly fee for using their TradingView charts in my analyses and educational articles.

Expand Energy (EXE) – Fueling Growth in the LNG BoomCompany Overview:
Expand Energy NASDAQ:EXE is strategically positioned near the Gulf Coast, enabling it to capitalize on rising global LNG demand with a disciplined growth strategy.
Key Catalysts:
$2.7 Billion Capital Plan (2025) 💰
$500M for debt reduction & share buybacks, improving financial flexibility.
Balances growth investments with shareholder returns.
Production Expansion 📈
2024: 6.41 Bcfe/d
2025: 7.1 Bcfe/d 🚀
2026: 7.5 Bcfe/d 🌍
Scalable drilling & infrastructure investments enhance efficiency.
Strategic LNG Market Positioning ⚡
Located near key export hubs, maximizing access to high-demand markets.
Flexible capacity investments ensure adaptability to pricing trends.
Investment Outlook:
✅ Bullish Above: $95.00-$96.00
🚀 Upside Target: $140.00-$145.00
📈 Growth Drivers: LNG market demand, financial discipline, and production scalability.
🔥 Expand Energy – Driving the Next Wave of LNG Growth. #EXE #Energy #LNG

Nano Nuclear Energy – Pioneering Next-Gen Small Modular ReactorsCompany Overview:
Nano Nuclear Energy NASDAQ:NNE is revolutionizing clean, compact nuclear power with small modular reactors (SMRs), addressing data centers, remote sites, and disaster relief energy needs.
Key Catalysts:
ZEUS Microreactor Development 🚀
Successfully assembled first hardware, marking a key milestone toward commercialization & revenue generation.
Patent-Backed Innovation 🏆
Filed four new patents in February 2025 for its Annular Linear Induction Pump (ALIP).
Strengthens NNE’s edge in molten-salt & liquid-metal reactor technology.
Surging Global Electricity Demand ⚡
Aligns with the growing need for cost-effective, sustainable energy solutions.
Ideal for off-grid, military, and high-demand industrial applications.
Investment Outlook:
✅ Bullish Above: $21.50-$22.00
🚀 Upside Target: $44.00-$47.00
📈 Growth Drivers: Breakthrough SMR tech, patent leadership, and clean energy demand.
🔥 Nano Nuclear – Powering the Future, One Microreactor at a Time. #NNE #NuclearEnergy #CleanTech

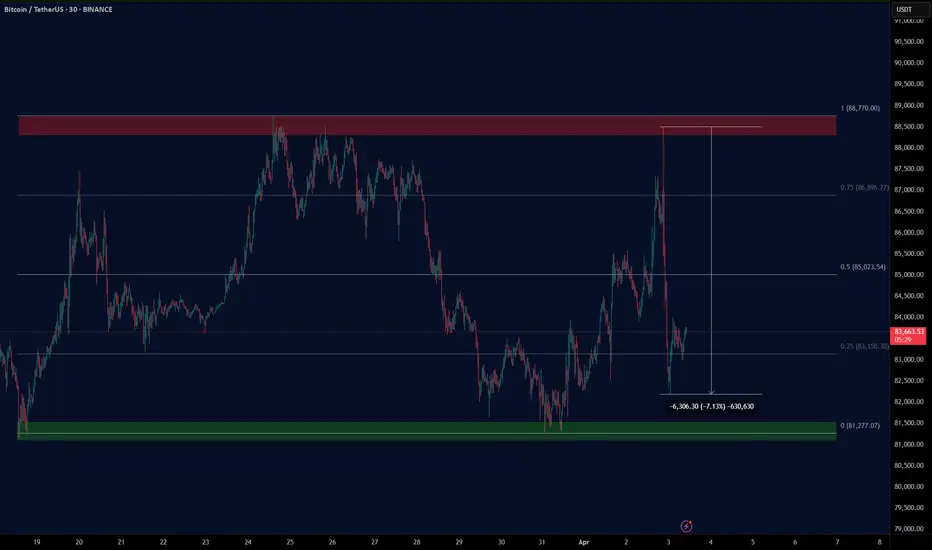
BTC TARIFF TALKAs President Trump steps up on the stage to deliver his tariff plan BTC had a steady price rise going into the talk, a nice HH & HL LTF structure up into range high/ last weeks high, then as the speech began all of the progress made throughout the day wiped in less than 2 hours to reset BTC's price to Tuesdays low.
In the end the news event gave volatility as expected but ultimately the structure remains the same, rangebound. As the Tax year comes to an end it would be a hard ask for this choppy price action to shift bullish when institutions are going to be window dressing their portfolios for the next financial year.
In essence A continued LTF range with an overall HTF bearish trend looks to continue, this is compounded by yet another failed attempt at the 4H 200 EMA which had temporarily been broken but sent back below by the tariff announcements.
The SPX, DJI & NASDAQ Futures pre-market is looks dreadful so a revisit on the range low is probable on the cards at some stage today.

NASDAQ Trade Plan: From 4-Hour Trend to 15-Minute Execution!NAS100 Strategy: Using Fibonacci and Market Structure for Precision!
📊 In this NASDAQ (NAS100) trade idea, I focus on a top-down approach starting with the 4-hour chart. If the 4-hour trend is bullish, I look for higher highs and higher lows. If bearish, I focus on lower highs and lower lows. 🔄 My key strategy is identifying pullbacks into equilibrium—around the 50% Fibonacci retracement level—within any price swing. This is my point of interest.
Once price moves into this area, I shift to the 15-minute chart to refine my entry. 🔍 Here, I wait for a break of structure during the pullback, aligning with the overall trend direction. This approach allows for precise execution while staying in sync with the larger trend. 🚀
⚠️ This is not financial advice. Always trade responsibly and manage your risk.

NAS100 Analysis: Reversal Predictions Based on Trading MathDear Trader,
Please find attached my analysis of $Subject, which uses mathematical calculations to identify potential reversal times and price levels.
The analysis details projected south and north price targets (horizontal lines on the chart), along with estimated time frames for possible reversals (vertical lines on the chart, accurate to within +/- 1-2 candles). Please note that all times indicated on the chart, including the vertical lines representing potential reversal times, are based on the UTC+4 time zone.
To increase the probability of these analysis, I recommend monitoring the 5-minute and 15-minute charts for the following key reversal candlestick patterns:
Doji’s
Hammer/Inverted Hammer
Double/Triple Bottom/Top
Shooting Star
Morning Star
Hanging Man
I welcome your feedback on this analysis, as it will inform and enhance my future research.
Regards,
Shunya Trade
⚠️ Disclaimer: This post is educational content and does not constitute investment advice, financial advice, or trading recommendations. The views expressed here are based on technical analysis and are shared solely for informational purposes. The stock market is subject to risks, including capital loss, and readers should exercise due diligence before investing. We do not take responsibility for decisions made based on this content. Consult a certified financial advisor for personalized guidance.

Nasdaq market analysis: 03-APRIL-2025Good morning Dear Traders! Join me for Nasdaq market analysis for the today. Share your charts, ask questions, and let's discuss trading strategies.

Today analysis for Nasdaq, Oil, and GoldNasdaq
The Nasdaq closed higher on the daily chart. However, following the announcement of mutual tariffs after the previous session’s close, the index experienced a significant gap-down. On the daily chart, the MACD has crossed below the signal line, generating a sell signal, though confirmation is still pending. If today's session closes with a bearish candle, we must monitor whether this leads to a third wave of selling, signaling further downside.
Due to the gap-down, the price is now significantly distanced from the 3-day and 5-day moving averages (MAs), making it crucial to observe whether the price rebounds intraday or continues to decline further. With the first support level at 19,000 now breached, the next key support is around 18,500. When considering buy positions, it is essential to manage stop-loss risk carefully.
On the 240-minute chart, a sell signal has appeared but is not yet confirmed. If confirmed, it could trigger a third wave of selling pressure, potentially leading to further declines. Given the increased market volatility, a cautious approach is recommended—reducing leverage and only trading at key price levels to minimize potential losses.
Crude Oil
Crude oil closed higher while maintaining a range-bound movement around $72. On the daily chart, the MACD has moved above the signal line and the zero line, establishing a bullish trend. However, following the mutual tariff announcement, the price gapped down, dropping below $70. The strongest support zone lies around $68, making it crucial to observe whether the MACD adjusts and aligns with the signal line before rebounding from this support level to resume the bullish trend.
On the 240-minute chart, a sell signal has appeared, but with multiple support levels nearby and both MACD and the signal line still above the zero line, the market is likely to attempt rebounds. A buy-the-dip approach remains favorable, but caution is necessary given today’s OPEC meeting, which could lead to increased volatility.
Gold
Gold closed higher, finding support at the 5-day MA. Following the mutual tariff announcement, the price initially gapped up to around 3,200, before pulling back. As previously mentioned, the upward target for this wave is around 3,216, with strong buying momentum continuing. On the daily chart, gold is trading between the 5-day MA and the upper Bollinger Band, maintaining a one-way bullish structure.
A bullish strategy remains favorable unless the daily close falls below the 10-day MA. On the 240-minute chart, the MACD remains above the zero line and previously attempted to break above the signal line but has since pulled back. Since buying momentum is still present, if the price finds support at a key supply zone, another leg higher could occur, potentially triggering a golden cross in the MACD and leading to a third wave of buying pressure.
Short positions should be approached with caution, and given the increased market volatility, risk management is crucial. Whether buying or selling, stop-loss discipline is essential to manage potential risks.
Market volatility has surged since the pre-market session due to Trump’s mutual tariff policies. Volatility is both an opportunity and a risk for traders. Do not let greed lead to losses in a market that doesn’t match your trading style. Adjust position sizes accordingly and only trade within your comfort zone. The market is always open. Do not focus solely on today—take a steady and stable approach to trading.
Wishing you a successful trading day!
If you like my analysis, please follow me and give it a boost!
For additional strategies for today, check out my profile. Thank you!

NASDAQ INDEX (US100): Great Opportunity to Sell
NASDAQ Index formed a strong bearish pattern after a test of a key daily
resistance area.
I see a head & shoulders pattern on an hourly time frame
and a confirmed breakout of its horizontal neckline.
The index can continue decreasing.
Next support - 19240
❤️Please, support my work with like, thank you!❤️

Nasdaq trading zones: 02-APRIL-2025Discover today's Nasdaq trading zones and refine your market analysis skills.

Today analysis for Nasdaq, Oil, and GoldNasdaq
The Nasdaq closed higher on the daily chart. Although a sell signal briefly appeared in the previous session, the MACD failed to form a bearish crossover with the signal line, instead finding support and rebounding. The index strongly bounced from its low, reaching the 5-day moving average (MA) before closing with an upper wick.
Since the MACD is supporting the signal line and potentially resuming an upward trend, the key level to watch is whether the price can break through the strong resistance at 19,625–19,675. As long as the MACD does not confirm a bearish crossover, it is advisable to trade within the range.
On the 240-minute chart, the index rebounded from the bottom while generating a buy signal. However, with strong resistance around 19,675, if the price pulls back once more, it could either form a double bottom or resume a strong upward move from a single-bottom structure.
Although the MACD has crossed above the signal line (golden cross) on the 240-minute chart, it is still far from the zero line, suggesting that further pullbacks may occur after additional gains. It is important to avoid chasing the price and instead focus on buying dips at key support levels while maintaining a range-trading approach.
Crude Oil
Oil closed flat, facing resistance at $72. On the daily chart, the price broke above the 240-day MA and is now testing resistance from a previous supply zone. It is likely to consolidate within a range while pulling up the short-term moving averages.
The daily MACD has moved above the zero line, lifting the signal line as well. If the price remains in a range-bound consolidation, the signal line will eventually rise above the zero line, further supporting a bullish structure.
Key upcoming events include today’s oil inventory report and tomorrow’s OPEC meeting, which could act as catalysts for either a continuation of the rally or a pullback. Since there is still a gap between the 3-day and 5-day MAs, range trading remains the best approach.
On the 240-minute chart, strong buying momentum continues, but given the heavy supply at previous resistance levels, a period of sideways movement or a pullback is likely.
If a bearish crossover occurs on the 240-minute chart, oil could drop below $70. For now, monitor whether the uptrend can hold, and if it does, consider trading within the range while managing downside risks.
Gold
Gold closed lower after an overshoot to the upside. On the daily chart, the price was in an overextended high position, with a significant gap from the 3-day and 5-day MAs. After a brief rally, selling pressure emerged, leading to a bearish close.
Since gold has yet to properly test the 5-day MA, a pullback to this level remains a possibility. However, the daily MACD is still trending upward, and liquidity remains strong, increasing the likelihood of a one-way rally unless the 10-day MA is broken. Short positions should be approached with caution.
On the 240-minute chart, a bearish crossover has occurred, leading to a pullback from the high. However, since the uptrend remains intact, even if the MACD crosses below the signal line, the fact that it is still above the zero line suggests a potential rebound.
The best strategy is to focus on buying dips at key support levels, as the market is likely to consolidate before resuming a trend move. Be cautious when trading within a range-bound market.
With Friday’s U.S. employment report approaching, market volatility remains elevated. Trump’s tariff policies are increasing concerns about inflation and a potential economic slowdown. The interpretation of upcoming economic data will be crucial in determining market direction.
Risk management remains essential, so trade cautiously and stay prepared.
Wishing you a successful trading day!
If you like my analysis, please follow me and give it a boost!
For additional strategies for today, check out my profile. Thank you!
