Nasdaq updated forecast with sell-side & buy-side targetsNQ futures aiming at 18900 level off these last highs. Now seeing developing weakness... expecting sellers to take it down for one more low as we approach the implementation of Trump's tariffs on 4/2.
Look for renewed buyer strength after the next set of lows as we approach the next FOMC rate decision into first half of May 2025.
This is a great swing trade setup for TQQQ, if desired, or long dated in-the-money QQQ call options.
Nasdaq

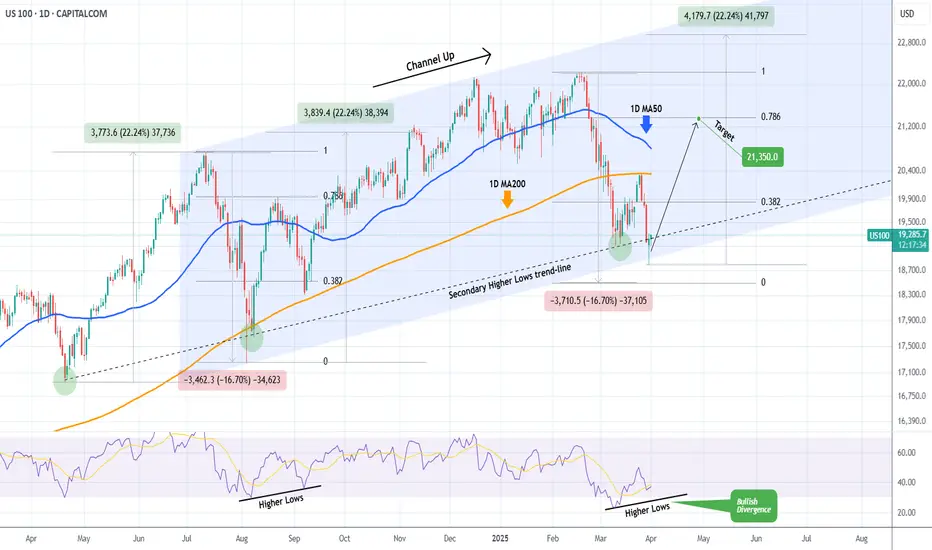
NASDAQ Huge Bullish Divergence points to 21350 inside April.Nasdaq (NDX) has been trading within a Channel Up pattern since the July 11 2024 High. The latest rally that started on March 11 2025 after a brutal 3-week downtrend/ Bearish Leg, got rejected on the 1D MA200 (orange trend-line) as the market digested the disappointing PCE.
Despite this aggressive rejection, the price hit and rebounded yesterday exactly at the bottom of the Channel Up with the previous such contact going back to the August 05 2024 Low. Not to mention that both the March 11 2025 and August 08 2024 Lows were formed exactly on the secondary Higher Lows trend-line.
What's perhaps more critical than any of these though, is that the 1D RSI didn't make a new Low last week and remains above the oversold barrier on a Higher Low trend-line that is a huge technical Bullish Divergence against the price's Lower Lows.
As with the August 22 2024 High, our first short-term Target is on the 0.786 Fibonacci retracement level at 21350.
-------------------------------------------------------------------------------
** Please LIKE 👍, FOLLOW ✅, SHARE 🙌 and COMMENT ✍ if you enjoy this idea! Also share your ideas and charts in the comments section below! This is best way to keep it relevant, support us, keep the content here free and allow the idea to reach as many people as possible. **
-------------------------------------------------------------------------------
💸💸💸💸💸💸
👇 👇 👇 👇 👇 👇
Nasdaq market analysis: 01-APRIL-2025Good morning! Happy New Day! Here's your daily Nasdaq market analysis. Learn, grow, and trade wisely.

Today analysis for Nasdaq, Oil, and GoldNasdaq
The Nasdaq closed lower with a gap-down amid growing recession fears. Although it did not reach the 20-month moving average (MA) on the monthly chart, last month’s long bearish candlestick has resulted in a sell signal on the monthly futures chart—the first time in three years since February 2022. From a monthly perspective, the 16,900–17,500 range appears to be a good buying zone, but it is important to monitor whether the index reaches this level within this month’s candle. The 20-month MA is likely to be briefly breached, even if a lower wick forms.
On the weekly chart, the Nasdaq is currently finding short-term support around 19,000, but given the large gap between the 3-week and 5-week MAs, a rebound remains a possibility. On the daily chart, a sell signal has not yet been confirmed. If further declines confirm a bearish crossover, the Nasdaq could enter a third wave of selling, with a target of 17,300. The key question is whether the market experiences another sharp drop.
However, given the significant distance from the 5-day MA, the more likely scenario is sideways movement for a few days, allowing the moving averages to catch up before a potential further decline. In this case, it is advisable to trade within the range but always use stop-losses. The 240-minute chart also shows strong downward movement. While the market is in oversold territory, making short-selling more favorable, there is also the possibility of a range-bound pattern forming on the daily chart. If taking buy positions at the lows, strict stop-loss management is essential.
Crude Oil
Oil closed higher following news of tariffs imposed on Russian oil. The price successfully broke above the key resistance at $70, also surpassing the 240-day MA. On the monthly chart, oil has now entered a range where further upside potential exists, and there is a possibility that the MACD could attempt a bullish crossover with the signal line.
On the daily chart, the MACD has moved above the zero line, pulling the signal line upward. If the price stays above the 240-day MA, it may form a strong trend reversal pattern with accelerated gains. On the 240-minute chart, the MACD remains above the zero line and is crossing above the signal line, indicating continued buying momentum.
Overall, it is best to focus on buying dips, as April’s first trading session could see the price gapping above the 240-day MA. Holding overnight short positions carries risk, so caution is advised.
Gold
Gold closed higher, driven by strong demand for safe-haven assets. On the monthly chart, gold formed a long bullish candlestick. However, given the large gap between the price and the 3-month & 5-month MAs, a pullback remains a possibility. The key question is whether gold will continue rising before a correction or correct first before resuming its uptrend. It is best to monitor the price action closely.
On the daily chart, the MACD is forming a third wave of buying pressure, opening the possibility for a price target around 3,216. Thus, it is advisable to focus on buying dips, while being cautious about chasing highs due to potential volatility. The 240-minute chart indicates that strong buying momentum continues, as gold remains in overbought territory.
Since this is the beginning of a new month, key economic reports—including the ISM Manufacturing PMI and the U.S. Jobs Report—could significantly impact gold’s volatility. For both buy and sell positions, it is essential to set stop-loss levels, as increased volatility is expected.
With Trump’s tariff policies increasing the risk of a global recession, liquidity in global equity markets is drying up, reducing the attractiveness of stocks. The clear contrast between Nasdaq and gold’s performance is likely to persist for some time.
As we enter April’s first trading session, trade cautiously and adapt to market conditions.
Wishing you a successful trading day!
If you like my analysis, please follow me and give it a boost!
For additional strategies for today, check out my profile. Thank you!

NASDAQ: Forming the bottom. Don't miss the 2025 rally to 28,000.Nasdaq is bearish on its 1D technical outlook (RSI = 35.342, MACD = -382.320, ADX = 38.919), headed towards oversold territory. 1W is also headed towards an oversold state (RSI = 36.953) as the price has crossed under the 1W MA50 and is approaching the 1W MA100. This is currently waiting at the bottom of the 2 year Channel Up. This 6 month correction is so far technically nothing but the bearish wave of this Channel Up and has been almost as strong (-15.89%) as the previous in July-Aug 2024.
Notice an key technical tendency here, no correction/bearish wave has ever crossed under the S1 level of two highs before. The current S1 is at 18,400. So taking those conditions into consideration as well as the fact that the 1W RSI is at the bottom of its Channel Down, we see this week as the bottom formation candle that will start a new bullish wave. The prior two such waves both made an incredibly symmetric rise of +52.60%, so expecting the same puts our target at TP = 28,000, most likely by December 2025-January 2026.
## If you like our free content follow our profile to get more daily ideas. ##
## Comments and likes are greatly appreciated. ##

Nasdaq 100 Opens the Door to a New Bearish TrendThe Nasdaq has been one of the indices showing the strongest selling bias in recent sessions. Over the past four trading days, it has fallen by more than 7% , as the market remains gripped by uncertainty surrounding White House trade policies and the threat of a new trade war. The proposed 25% tariffs on several countries are expected to take effect on April 2, and so far, there has been no official indication of a change in schedule. This has increased fears of a potential global economic slowdown, and if these conditions persist, it could further pressure equity indices, especially those already showing strong short-term bearish momentum.
New Potential Downtrend
Since February 20, the Nasdaq has been experiencing consistent selling pressure, driving the index below the 19,000-point level. Recent bullish attempts have so far failed to break through this new downward trendline, which now stands as the dominant technical structure for the index. If selling pressure remains intact, the current bearish trend could extend over the coming sessions.
ADX Indicator
Although the ADX line remains above the 20 level—generally considered the threshold for trend strength—it has been sloping downward, suggesting that the recent buying momentum may be losing strength, potentially leading to a short-term pause in market activity.
RSI Indicator
The Relative Strength Index (RSI) shows a similar picture. The RSI is hovering near the oversold zone at 30, and a bullish divergence has formed, as the Nasdaq has made lower lows, while the RSI has posted higher lows. This could indicate that selling momentum may be weakening, potentially paving the way for a short-term bullish correction.
Key Levels:
20,500 points – Distant resistance: This level aligns with the 200-period moving average. Price action approaching this area could revive bullish sentiment and potentially invalidate the current downtrend visible on the chart.
19,700 points – Near resistance: This level marks the upper boundary of the short-term descending trendline. It may serve as a tentative area for corrective upward movements in the upcoming sessions.
18,800 points – Key support: This level corresponds to 2024’s neutral price zone. If the price breaks below it, it could reinforce the current bearish trend and lead to further downside.
By Julian Pineda, CFA – Market Analyst

Agape ATP Corporation (ATPC) Technical Analysis | 31 March 2025Agape ATP Corporation (ATPC) has demonstrated a significant breakout above a key resistance level, with the current price trading at $1.18, reflecting an increase of +0.85% on the day. The bullish move is backed by an increase in trading volume from the previous trading day, which signals renewed investor interest and growing confidence in the stock’s upward trajectory.
This breakout marks a shift in sentiment, indicating the potential for a sustained rally as the price decisively cleared its previous consolidation range.
The price action has remained consistently above the Exponential Moving Average (EMA) slope cross indicator, with the dynamic support now situated between $1.12 and $1.17. The bullish crossover of the EMA signals confirms a strengthening uptrend, as the widening of the EMA cloud suggests that buying pressure is increasing. Historically, such a pattern indicates that the breakout is not merely a short-term spike but a shift toward higher price levels, paving the way for sustained gains.
The EMA zone is expected to act as a buffer against any minor retracement, maintaining bullish momentum.
Adding to the bullish outlook is the Relative Strength Index (RSI) Divergence Indicator (14, close), which currently stands at 81.14, suggesting that the stock has entered overbought territory. While an overbought condition often raises concerns of a potential pullback, in the context of a strong breakout, it typically serves as a confirmation of the stock’s strength.
Stocks that experience such momentum tend to remain in overbought territory for extended periods before any meaningful consolidation occurs. The RSI divergence, which previously indicated bearish pressure, has been invalidated by the recent surge, giving further credence to the current bullish momentum.
The breakout above $1.18 is significant as it marks the upper limit of a prolonged consolidation phase where buyers have consistently absorbed selling pressure. Throughout this consolidation, the emergence of multiple “Long” buy signals, combined with a noticeable reduction in “Short” signals, indicated that accumulation was underway. The recent breakout confirms that buyers have taken control, and the subsiding of selling pressure further strengthens the bullish case. The consistency of these buy signals, coupled with increased volume, suggests that the breakout is not merely speculative but supported by strong underlying demand.
Overall, the technical setup suggests that ATPC is well-positioned for further upside. The combination of a decisive breakout, increasing volume, and sustained bullish signals points to the likelihood of continued gains. With momentum firmly in favour of the bulls and the stock showing resilience above key levels, the outlook remains positive. Investors should monitor the price action closely for confirmation of continued strength, with a focus on maintaining support above $1.12 while aiming for potential targets of $1.25 to $1.30 in the near term. If momentum persists, a further extension toward $1.40 could be possible, supported by the bullish market sentiment surrounding the stock.

Today analysis for Nasdaq, Oil, and GoldNasdaq
The Nasdaq closed sharply lower, forming a long bearish candlestick, as recession fears intensified. The index fell toward the lower Bollinger Band on the daily chart, while the MACD moved closer to the signal line, indicating a correction.
On the weekly chart, the Nasdaq faced resistance slightly above the 5-week MA, forming an upper wick and closing lower. The MACD is falling steeply, and the signal line is also in a downtrend, suggesting the potential for an overshooting move downward before forming a bottom. From a daily perspective, key support zones to watch are around 19,000 (first level) and 18,500 (second level). The MACD has not yet crossed below the signal line, but if a bearish crossover (death cross) occurs, a strong third wave of selling pressure could emerge. Therefore, caution is advised for long positions. However, since the MACD has not yet confirmed a bearish crossover, there is also the possibility of a rebound off the signal line. It is crucial to wait for a confirmed trend reversal before taking long positions.
On the 240-minute chart, strong sell signals have emerged, leading to a steep decline. The current price action resembles the movement seen on February 21, but since the bottom is not yet clear, it is best to adopt a conservative approach. For short positions, the 3-day moving average can be used as a reference level. For long positions, the lower Bollinger Band may provide a short-term buying opportunity. As today marks the last trading day of the month, watch closely to see if the Nasdaq reaches the 20-month MA or ends the month with a lower wick.
Crude Oil
Oil closed lower, facing resistance at $70. It has fallen back below the 5-day MA, trapping the price within a range-bound structure. On the weekly chart, oil was rejected at the 10-week MA, and since the MACD has not yet formed a bullish crossover, there is a chance that oil could retest its previous double-bottom level. A consolidation phase between the 5-week and 10-week MAs appears likely.
On the daily chart, as the price corrected, the MACD began converging with the signal line. If oil retraces to around $68, a short-term buying opportunity may arise. For oil to resume its uptrend, it needs to pull back toward $68, rebound, and break above $70 with strong momentum. However, this move would likely require a global catalyst. On the 240-minute chart, both the MACD and signal line remain above the zero line, suggesting a higher probability of a rebound and a golden cross formation. Overall, the best approach is to focus on dip-buying opportunities during this phase.
Gold
Gold closed higher, breaking to a new all-time high on the daily chart. Last week, there was a possibility of a pullback toward the 5-week MA, but the MACD has turned upward, surpassing its previous high, reducing the likelihood of a bearish divergence and increasing the probability of further upside. However, since gold has not yet tested the 5-week MA, a short-term correction remains a possibility. On the daily chart, buying opportunities were available at the 3-day MA following a strong bullish candle. A pullback to the 5-day MA within the next few days remains possible, and if this happens, it could present another dip-buying opportunity. Based on wave analysis, gold could target around 3,216. To confirm this upside scenario, the daily chart must show stronger bullish momentum, eliminating the risk of MACD divergence.
On the 240-minute chart, gold has been experiencing strong upward momentum, making it a buy-on-dips market. However, for a more comfortable long position, the MACD needs to exceed its previous peak. Overall, a long-only strategy remains preferable. For short positions, it is difficult to pinpoint the exact peak, so strict stop-loss management is essential. This week, key economic events include the ISM Manufacturing & Services PMIs and Friday's U.S. jobs report, which could increase gold's volatility. Stay cautious.
Today marks the final trading session of March. Tariff-related news and gold’s record highs indicate rising market volatility. Stay adaptive to the market’s movements and trade safely as we close the monthly candle.
Wishing you a successful trading day!
If you like my analysis, please follow me and give it a boost!
For additional strategies for today, check out my profile. Thank you!

NAS100 - Stock market still in a downtrend?!The index is trading below the EMA200 and EMA50 on the 4-hour timeframe and is trading in its descending channel. If the index moves down, it will be clear that it is heading for further moves. At the channel ceiling, I could be close to the next sell-off.
As the new US tariffs are set to take effect on April 2, new evidence suggests that they may be less than the markets had expected. According to a recent report in the Toronto Star, Canada is likely to face the lowest level of tariffs, while Mexico, another member of the US trade agreement, is likely to face a similar situation. In addition, Trump’s recent statements about significant progress in controlling fentanyl (an industrial drug), are seen as a positive sign for improving trade relations.
In this regard, CNBC reported that VAT and non-tariff barriers will not be taken into account in calculating the tariff rate, or at least not fully. The main concern is that by threatening to impose a 25% tariff, Trump is actually preparing Canada and Mexico to accept higher rates than the current conditions. It seems that his goal is to impose the highest possible tariff level. This decision could be an incentive to increase tariff revenue to reduce taxes. Of course, such an approach is associated with high risks, since any level of tariffs can lead to retaliatory measures from trading partners.
In the case of Europe, tariffs imposed on American goods are higher than in other countries, but a large part of them relate to the automotive industry. Europe has previously announced that it is ready to reduce these tariffs. The question now is whether the EU will take a different approach than Mexico and Canada? That is, first impose higher tariffs and then negotiate to reduce them.
This scenario could ultimately benefit the US economy, as the bulk of its trade is with Mexico and Canada. Meanwhile, China remains a complex challenge, as it is the main target of Trump’s tariff policies. In addition, the US president recently proposed imposing tariffs on Venezuela, which could be a pretext for intensifying trade pressure on China. Polls show that 50% of the market expects new tariffs on China, which indicates the level of investor concern.
The European Union has reacted to the Trump administration’s decision to impose new tariffs on imported cars and expressed regret over the move. European Commission President Ursula von der Leyen has said the bloc will seek a negotiated solution to ease tensions, but she has also stressed that Europe’s economic interests will be protected against US trade policies.
The US credit rating has risen to a new low, according to a new report from Moody’s, which warns that tax cuts and trade tariffs could widen the country’s budget deficit.
Analysts at Goldman Sachs and Deutsche Bank say investors expect the effective tariff rate on all imports to be between 9% and 10%, although some analysts at Goldman Sachs have suggested a rate of 18%. However, inflation and exchange rate expectations point to lower figures.
If Trump’s promise of “reciprocal tariffs” is implemented, the effective tariff rate could be even lower than 5 percent, although this depends on whether the agricultural sector is also subject to tariffs. Some reports also suggest that non-tariff barriers may be completely ignored.
According to Deutsche Bank, it is very difficult to determine market expectations precisely. But if the tariff rate ultimately falls between 5 and 7.5 percent, markets are likely to react with more confidence. Otherwise, more volatility and turbulence in financial markets are expected.
At the beginning of the year, markets were in a positive and optimistic mood. The Republican victory in the election, the continuation of tax breaks and the possibility of new support packages were among the factors that reinforced this optimism.
However, factors such as the high US budget deficit, the deadlock in Congress and the high inflation rate have now challenged this optimism. Meanwhile, two important support tools that were effective in the past may no longer be as effective:
1. During Trump’s first term, the stock market was of particular importance to him. Even during the COVID-19 crisis, he constantly talked about the stock market and considered it part of his successes.
The term “Put Trump” meant that even if he made harsh statements, he ultimately acted in the market’s favor.
2. But now, in Trump’s second administration, he talks about “short-term pain” and “economic detoxification.” Tariff threats, reduced investment and policy uncertainty have caused the S&P 500 to fall 10% since February. Trump still considers the market important, but he is no longer as staunchly supportive of it as he used to be.
In addition, this week will include the release of a series of key economic data. Including:
• Tuesday: ISM Manufacturing PMI and JOLTS.
• Wednesday: ADP Private Employment Report
•Thursday: ISM services index and weekly jobless claims.
One of the big risks to the markets is that economic data remains weak while the ISM price sub-indices rise. Such a situation could signal a deflationary tailwind. In such a situation, even if the Federal Reserve moves to lower interest rates, it will still be difficult for the stock market to grow.

Yearly Candle on NQ 2025I believe what we're seeing right now is simply the market printing the “open low” of the yearly candle. The recent dip seems driven by short-term fear surrounding the new tariffs, but in my view, this is just noise. Long-term, this sets up a bullish scenario.
Businesses won’t adjust overnight—it takes time to shift operations away from high-tariff regions. But as that transition unfolds, we’ll likely see improved margins and stronger fundamentals emerge.
From a technical standpoint, I’m watching for a key reversal after price revisits the order block. If we get that reaction, it could mark the beginning of a broader move higher. This looks like manipulation, not distribution.
OLHC
- Gavin
NFA, DYOR

Update about my previous warning about a crash of the SPX500📉 SPX500 Major Correction: Scenario 1 or 2?
In my previous analysis, I explained a scenario that could mimic the 2022 crash (Scenario 1):
🔗
However, the price action dropped much faster than in 2022, accelerating the correction.
Now, on the daily timeframe, we already have a bullish MACD crossover, signaling a potential bullish trend for several days:
🔗
Could This Invalidate the Bearish Trend?
✅ Yes, absolutely.
In June 2023 (Scenario 2), a similar situation occurred:
A bearish MACD reset was interrupted mid-course by a violent dump
This triggered a strong rebound, breaking through resistance levels
There are now strong signs that Scenario 2 might play out again.
What Does This Mean for Crypto & TradFi?
📈 If this bullish reversal holds, it could sync Crypto & TradFi, with both gaining bullish momentum on the weekly timeframe, peaking around May 2025.
Two Possible Outcomes:
1️⃣ Scenario 1 – The reversal collapses, and the correction continues 📉
2️⃣ Scenario 2 – The reversal holds, leading to a rally 📈
Let’s monitor this closely to see which scenario unfolds.
🔍 DYOR!
#SPX500 #StockMarket #Crypto #Trading #BullishReversal #BearishTrend #MACD #MarketAnalysis #Investing

Weekly Market Forecast: SELL THE INDICES!In this video, we will analyze the S&P 500, NASDAQ, AND DOW JONES Futures for the week of March 31st - April 4th.
The equity markets took a bearish turn last week. This is likely to continue for the upcoming week.
Monday is the end of March. Tuesday brings a new week and new opportunities. April 2nd brings... potentially market flipping volatility. The day the Trump tariffs are implemented.
Be careful. Let the market give you direction, and then get involved.
Enjoy!
May profits be upon you.
Leave any questions or comments in the comment section.
I appreciate any feedback from my viewers!
Like and/or subscribe if you want more accurate analysis.
Thank you so much!
Disclaimer:
I do not provide personal investment advice and I am not a qualified licensed investment advisor.
All information found here, including any ideas, opinions, views, predictions, forecasts, commentaries, suggestions, expressed or implied herein, are for informational, entertainment or educational purposes only and should not be construed as personal investment advice. While the information provided is believed to be accurate, it may include errors or inaccuracies.
I will not and cannot be held liable for any actions you take as a result of anything you read here.
Conduct your own due diligence, or consult a licensed financial advisor or broker before making any and all investment decisions. Any investments, trades, speculations, or decisions made on the basis of any information found on this channel, expressed or implied herein, are committed at your own risk, financial or otherwise.

#202513 - priceactiontds - weekly update - nasdaq e-mini futuresGood Evening and I hope you are well.
comment: Last week I wrote that we need a proper channel down and the past week was the worst case scenario for the bulls. We could not even get to the 50% retracement and turned down violently again. There is a small chance for the bulls to make this a double bottom and go sideways but as of now that is very very low probability. More likely is that we have formed the top of the channel and will get a big second leg down to 18000 or lower. If we go down below 19000, my thesis is that we go down for 2 more weeks and then earnings will decide on the next impulse. For now the technicals are clear, market could not even retrace 50%, we turned around the daily 20ema and volume on the down move is picking up again. Everything points to a bear trend.
current market cycle: strong bear trend
key levels: 19000 - 20500
bull case: Bulls running for the exits. They have some previous support at the 2024-09 low 19073 but that is most likely not stopping this freight train down. Next big support is at 18000/18100 which is my W3 target. Only question now is if we find buyers tomorrow who want to keep the market above 19000. It’s not impossible that we could see 1-2 more days of stalling around 19000 but given the current structure the selling is just too strong to look for any longs.
Invalidation is below 19000.
bear case: Bears have now erased about a year of gains and we are heading lower. Friday was another strong sell signal and bears now want to close the monthly bar at the very low to also produce a huge sell signal on the weekly and monthly charts. The selling is strong enough for at least a decent sized second leg and the measured move leads to 16200 which is between my year-end-special target of 17500 and the bull trend line from the covid lows. Plan for the next 2 weeks is the W3 and W4 where I expect W3 to hit 18000 and W4 could retest 19000.
Invalidation is above 20600.
short term: Clear bear trend now once we drop below 19000. W3 should get us to around 18000 while W4 could be good for a retest of 19000. No longs for me what so ever. Big bear trend line from 22450 has to hold.
medium-long term - Update from 2024-03-16: My most bearish target for 2025 was 17500ish, given in my year-end special. Clear W1 of this bear trend. Market now has to close below 19000 to confirm W3. Depending on how deep W3 goes, W5 will either reach only around 17500 or the bull trend line around 16000.
current swing trade: None
chart update: Added most likely upper bear trend line and adjusted the 5-wave series.

FLSR - Bulls Will control an Impending Advance---Elliott wave analysis---
As you can see on the daily chart, There is an impulsive cycle from the low of 5960 that validates all the required rules of the Elliott wave principle given below:
Wave (2) can never exceed the starting point of wave (1).
Wave (3) can never be the shortest wave among (1), (3) & (5).
Wave (4) can never enter the price territory of wave (1).
So, we have a valid reason to validate the wave count. In addition, FSLR's wave cycle has the following formation in the wave with Fibonacci levels:
Wave (1) is an impulse wave.
Wave (2) retraced 100% of wave (1). It has formed A-B-C zigzag.
Wave (3) is an extended wave.
Wabe (4) is a complex correction W-X-Y, that retraced to 0.382 level.
Wave (5) is an ending diagonal.
Wave A retraced 0.382 of wave (5), which extended to 1.618 level.
Wave (B) retraced 100% of wave A.
FLSR had accomplished impulsive structure at 232 and started corrective formation. It looks like the correction phase occurred at 132.19 . We can expect a new motive cycle from 132.19 . Traders should carefully watch the breakout of wave 4 of wave (c).
Target projection:
Using Reverse Fibonacci of wave (B)
Reverse Fibonacci Of correction
resistance and pivot levels
From the above projections, we can find a cluster of levels to measure our targets. Traders can follow cluster targets: 168 - 188 - 192 or higher. It can extend up to 100% at 232.
Alternatively, Failure can continue correction to the final support level of 115.58, which is less likely to happen.
---Indicator Study:---
Average true range:
ATR of the FLSR rose to 7.79 when the price was rising. It suggests that we can get a rapid upward move after the breakout of wave (4).
RSI:
The RSI of the FLSR surged from 31.09 to 49.5 . RSI surge along with price suggests that bulls have a strong grip on the stock. We can also see a divergence from the previous move.
Exponential Moving averages:
Major EMAs, such as the 200-day and 100-day , are trading above the price, but the 20-day Exponential Moving Average is being broken by FSLR. Its possible for security to reach quickly to 50 EMA soon.
Thank you!
By @moneydictators on @TradingView Platform

$NQ CorrectionPrice clearly is going towards Sellside Liquidity.
The standard deviation shows -2 to -2.5 is where price would reverse from and its also aligned with Sellside liquidity.
Idea: Bearish.

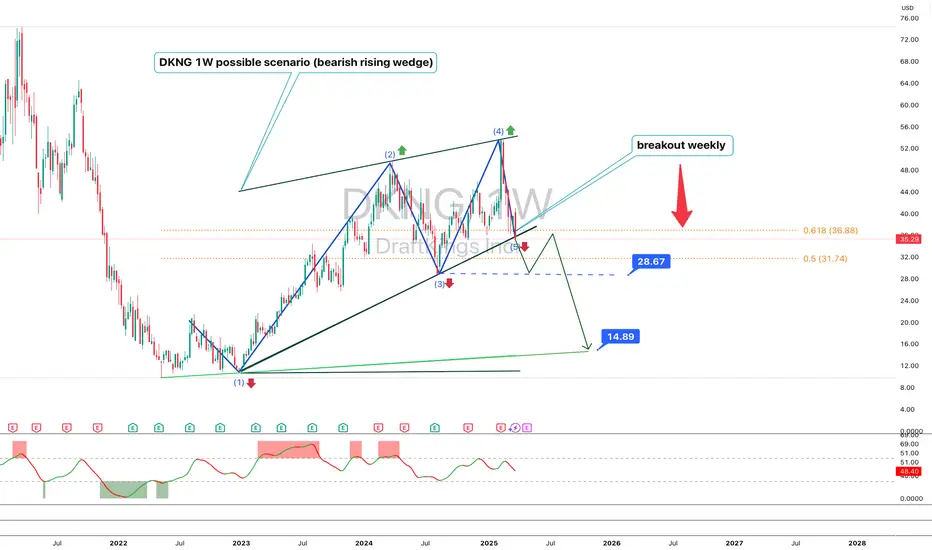
DKNG 1W – Technical and Fundamental AnalysisDKNG shares have broken a rising wedge on the weekly chart, reinforcing a bearish signal. The price is testing the $35.29 level after failing to hold above $36.88. A breakdown below $31.74 could accelerate a decline toward $28.67 and $14.89. RSI indicates weakening bullish momentum, MACD shows a bearish crossover, and EMA 50 and EMA 200 confirm a long-term uptrend but signal correction risks.
Fundamentally, DraftKings remains a leader in online gambling, but its stock is sensitive to Fed rate decisions and macroeconomic conditions. The upcoming earnings report could also impact price action. Correlation with the Nasdaq and S&P 500 increases its dependence on overall market sentiment.
A confirmed break below $31.74 could lead to further downside toward $28.67 and $14.89. If the price holds above $35.29, a recovery toward $36.88 is possible.
Realtime markups: Indices tailspin to the weekly range lowsAfter rejecting the weekly highs aggressively on Wednesday, we had a clear run toward the low of the same weekly range candle's low. I believe this low will be hit before anything else.
We will see what the Monday open sequence looks like. See you then 🫡

NASDAQ Will the disappointing PCE today form a Double Bottom?Nasdaq is on a strong 3 day correction that has almost erased the recovery attempt since the March 11th low.
That was a higher Low inside the 8 month Channel Up and the current correction may be a bottom formation attempt like September 6th 2024.
Trading Plan:
1. Buy before the closing market price.
Targets:
1. 23350 (the 1.382 Fibonacci extension).
Tips:
1. The RSI (1d) illustrates the similarities with July-September 2024 in a much better way. Strong indication that the Channel Up is attempting to price a bottom.
Please like, follow and comment!!

$QQQ - All eyes on the $472.88 LowNASDAQ:QQQ - The rally off of the lows has been in three waves thus far. For the downtrend to continue, price must take out 472.88 . If not, the market could unfold a double zigzag or a more bullish scenario, i.e. a 1-2/i-ii setup.

Nasdaq100 Update: Another Leg Down Likely After Recent Reversal?For quite some time, I have been highlighting the possibility of a strong correction in the Nasdaq 100 ( TRADENATION:USTEC ), with the 17,500 level remaining a realistic downside target.
In my more recent analyses, I argued that while a reversal from the 19,100 support zone was likely, it was merely a dead cat bounce , and the index could decline further from the 20,300-20,500 resistance zone. The lower boundary of this range was tested, and as expected, the index has started to fall again.
Although a temporary rally above 20,000 cannot be ruled out, my overall outlook remains unchanged—I still anticipate another leg down.
In conclusion, selling into rallies continues to be my preferred strategy, with 17,500 as the medium-term target.
Disclosure: I am part of Trade Nation's Influencer program and receive a monthly fee for using their TradingView charts in my analyses and educational articles.

Nasdaq analysis: 28-MAR-2025Good morning, traders! Today's Nasdaq analysis will help you achieve your trading goals. Let's work together towards success.

Nasdaq - When Rebound? There is a possibility that another major wave 5 is possible here, just like on SPX

Strong bullish outlook for the E-mini Nasdaq-100 (NQM2025)Nasdaq-100 E-mini Futures (NQM2025) – Technical & Fundamental Analysis
Technical Overview:
My Daily chart analysis on TradingView highlights a strong bullish outlook for the E-mini Nasdaq-100 (NQM2025). Here are the key takeaways:
Liquidity Sweep & Support Retest:
The recent decline led to a liquidity sweep (LQ SWEEP) at a critical ascending trendline. This suggests a classic stop-hunt scenario where weaker long positions were liquidated before stronger buyers stepped in.
Historical price action indicates that buyers previously entered at similar levels (noted as "Buyers coming in hot here"), reinforcing this demand zone.
Bullish Trendline Respect:
The long-term ascending trendline has been respected, acting as a dynamic support level.
The recent bounce suggests that this level remains intact, further validating the bullish structure.
Order Block (OB) & Market Structure Shift (MSS):
A previous bearish market structure shift (MSS) led to a short-term decline, but price has since found support and rebounded.
The chart suggests a reversion to the upside, targeting prior imbalance zones and liquidity pockets.
Projected Path & Targets:
The green projection indicates an expectation of higher highs, likely targeting the 21,500 - 22,500 range in the coming weeks.
The sell-side liquidity has been cleared, increasing the probability of a bullish move towards the order block resistance near 21,000.
Fundamental Confirmation (#EdgeFinder & #COT Data):
From a fundamental perspective, the bullish bias is further confirmed by EdgeFinder data and recent Commitment of Traders (COT) reports:
Institutional Positioning:
The latest COT data shows that institutional traders have increased their net long positions in Nasdaq futures, signaling bullish sentiment.
Macroeconomic Factors:
Recent economic reports and Fed statements have favored a risk-on environment, benefiting tech-heavy indices like Nasdaq.
Earnings season is approaching, with expectations of strong tech sector performance potentially fueling further upside.
Conclusion & Market Sentiment:
The confluence of technical support, institutional buying, and positive macroeconomic factors strengthens the case for a bullish continuation in Nasdaq-100 futures.
The key level to watch is 20,000—if held, the probability of a move towards 21,500 - 22,500 increases significantly.
Risk factors include unexpected macroeconomic shifts or stronger-than-expected hawkish Fed rhetoric, which could slow momentum.
This is not financial advice, only data analysis. Please consult a qualified financial professional for personalized guidance.
