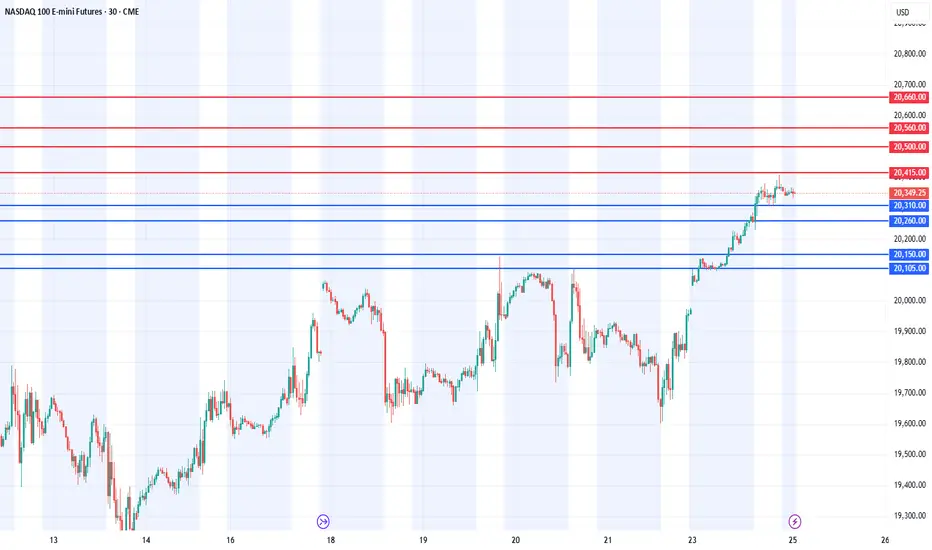
NASDAQ INDEX (US100): Bullish Reversal Confirmed?!
I see 2 very strong bullish reversal confirmation on US100 on a daily.
First the market violated a resistance line of a falling channel.
Then, a neckline of a cup & handle pattern was broken.
Both breakouts indicate the strength of the buyers.
We can expect a growth at least to 20300 resistance.
❤️Please, support my work with like, thank you!❤️
Nasdaq

NASDAQ - Support retest before new long waveMy idea is for a retest of support area
After this I looking for a reversal pattern for a new long wave.

Breaking: Alvotech Shares Dips 5% On Earnings Report Shares of Alvotech (NASDAQ: NASDAQ:ALVO ) saw a noteworthy downtick of 5% amidst earnings report yesterday after market close. Alvotech, through its subsidiaries, develops and manufactures biosimilar medicines for patients worldwide. It offers biosimilar products in the therapeutic areas of autoimmune, eye, and bone disorders, as well as cancer.
Financial Performance
In 2024, Alvotech's revenue was $491.98 million, an increase of 426.84% compared to the previous year's $93.38 million. Losses were -$231.86 million, -57.98% less than in 2023.
Highlights of the Financial Results for 2024 Full Year
Cash position and sources of liquidity: As of December 31, 2024, the Company had cash and cash equivalents of $51.4 million.
Product Revenue: Product revenue was $273.5 million for the year ended December 31, 2024, compared to $48.7 million for the same period in the prior year.
License and Other Revenue: License and other revenue was $216.2 million for the year ended December 31, 2024, compared to $42.7 million for the same period in the prior year. The license and other revenue of $216.2 million was primarily attributable to the achievement of key research and development milestones during 2024:
Cost of product revenue: Cost of product revenue was $185.3 million for the year ended December 31, 2024, compared to $160.9 million for the same period in the prior year.
Research and development (R&D) expenses: R&D expenses were $171.3 million for the year ended December 31, 2024, compared to $210.8 million for the same period in the prior year.
General and administrative (G&A) expenses: G&A expenses were $65.7 million for the year ended December 31, 2024, compared to $76.6 million for the same period in the prior year.
Operating profit: Operating profit was $69.6 million for the year ended December 31, 2024, compared to ($354.9) million for the same period in the prior year.
Share of net loss of joint venture and loss on sale of interest in joint venture: In June 2024, the Company sold its share in the joint venture for gross proceeds of $18.0 million (less $1.3 million in transaction costs). The sale resulted in a net loss of $3.0 million during the year ended December 31, 2024.
Finance income: Finance income was $80.1 million for the year ended December 31, 2024, compared to $4.8 million for the same period in the prior year.
Finance costs: Finance costs were $303.2 million for the year ended December 31, 2024, compared to $267.2 million for the same period in the prior year.
Loss on extinguishment of financial liabilities: On June 7, 2024, the Company entered into a $965.0 million Senior Loan Facility, maturing in July 2029 that was funded in July 2024. Upon the closing of the Senior Loan Facility, the Company was required to settle its existing debt obligations.
Income tax (expense) / benefit: Income tax expense was $14.3 million for the year ended December 31, 2024, compared to a benefit of $99.3 million for the same period in the prior year.
Loss for the Year: Reported net loss was $231.9 million, or ($0.87) per share on a basic and diluted basis, for the year ended December 31, 2024, compared to a reported net loss of $551.8 million, or ($2.42) per share on a basic and diluted basis, for the same period in the prior year.

$NASDAQ420 May Be Set for 1000% Surge Amidst Falling Wedge The price of Nasdaq420 ($NASDAQ420) coin may be gearing up for a massive price surge amidst a steep falling wedge pattern. The token Nasdaq420 ($NASDAQ420) created on the Ethereum blockchain is a metaphysical evolution of the Nasdaq100, harnessing vibrational energy to manifest the community's truest desires.
The asset since creation surge to $15.51 million in market cap before consolidating to $1.59 Million in market cap. Albeit not listed on any CEX, the token's price chart depicts a bullish reversal is brewing with a 1000% surge in sight. With the tokens immediate competitor $SPX6900 performing brilliantly well, Nasdaq420 ($NASDAQ420) will be poised to mirror such moves and bring light to its project and the community.
With the Relative Strength Index (RSI) at 53 Nasdaq420 ($NASDAQ420) has been holding the bears for long in the $1 million market cap support zone. With an active community of 2600 on Telegram, 2972 on X (formerly Twitter), Nasdaq420 ($NASDAQ420) might just be the next gem in the Ethereum memecoinomy.
Nasdaq420 Price Live Data
The live Nasdaq420 price today is $0.001593 USD with a 24-hour trading volume of $14,041.94 USD. Nasdaq420 is down 2.82% in the last 24 hours, with a live market cap of $1,593,336.2. The circulating supply is 1,000,000,000 NASDAQ420 and the max. supply is 1,000,000,000 NASDAQ420.

Nvidia Update New levels to the downside Longs and shortsIn this video I discuss the market structure shift in Nvidia and highlight new levels to be aware of to the downside . Potential here for longs and shorts .
Tools used Fibs, Gann Square , Speed Fan , Order blocks .
Please Like and comment if you have any questions . Have a great Day and thanks for your support

Today analysis for Nasdaq, Oil, and GoldNasdaq
The Nasdaq closed lower, facing resistance at the 240-day moving average on the daily chart. With a significant gap between the price and the 5-day moving average, a pullback toward the 5-day MA was anticipated. The index did find support at the 5-day MA, closing with a lower wick. The key question now is whether the current correction wave will fill the gap created on Monday, as it faced resistance at the 240-day line. If you’re looking to buy on dips, it’s best to focus on the gap area as a potential support zone. The MACD remains in a golden cross, and with a noticeable spread from the signal line, the market is likely to stay range-bound unless a bearish crossover occurs.
On the 240-minute chart, a bearish crossover (death cross) has formed, suggesting the potential for further downside. However, the price is approaching a strong support zone where buying interest previously emerged. Thus, buying on dips in lower zones may be favorable. In the short term, both the MACD and the signal line remain above the zero line, indicating a possible short-term rebound. Be cautious with chasing short positions and monitor lower time frames.
Also, don’t forget: Today’s GDP release may influence market direction.
Crude Oil
Oil closed higher, reaching $70 on the daily chart. Since the $70–71 range is a major resistance zone, it’s likely the trend may consolidate in this area. The daily MACD is rising sharply, and buying pressure appears strong and one-sided. Despite the resistance at $70–71, if oil gaps up over the weekend, there’s a chance this resistance could be broken by a gap-up move on Monday. Keep an open mind to this possibility, but also be cautious over the weekend (over-the-weekend risk).
On the 240-minute chart, the MACD is bouncing off the signal line, with strong renewed buying pressure. However, if oil fails to break higher, a MACD divergence could develop, so avoid chasing longs at elevated levels. Overall, it’s safer to treat the $71 level as the upper boundary of a range, favoring short-term selling strategies. Watch the lower timeframes for signs of trend reversal.
Gold
Gold ended the day flat within a narrow range, forming a small consolidation box ahead of today’s GDP release and tomorrow’s PCE data. The daily MACD is converging with the signal line, suggesting we are approaching a turning point — either a new leg up or a bearish crossover. Both bullish and bearish scenarios remain open, so it’s important to monitor how the market reacts to upcoming data. If gold fails to push higher, a bearish divergence may form, opening the door to a pullback toward the 5-week MA on the weekly chart.
On the 240-minute chart, both MACD and the signal line are hovering near the zero line, indicating sideways movement. Since the signal line remains above zero, the buy side still holds a slight edge, but confirmation via a strong bullish or bearish candle is needed to establish a trend. Any MACD signal triggered at the zero line could lead to a larger directional move, so keep that in mind. Until data is released, continue range-bound trading, and avoid premature long or short positions, as today’s trend may remain undecided.
March is coming to an end. Make sure to keep a close eye on today and tomorrow's data releases and aim to close the month with solid results.
Wishing you a successful trading day!
If you like my analysis, please follow me and give it a boost!
For additional strategies for today, check out my profile. Thank you!

Nasdaq analysis: 27-MAR-2025Good morning, traders! Today's Nasdaq analysis will help you achieve your trading goals. Let's work together towards success.

Everyone’s scared of booze stocks… Why I’m still buyingThis analysis is provided by Eden Bradfeld at BlackBull Research.
One of the things I find interesting is that a lot of people say “why do you like booze stocks so much Eden” and yet many of these same people are at the pub, or buying En primeur from Glengarry Wines. The short answer is — I like stocks that trade at multi-year lows with a predictable product. There is a fairly hysterical article in the FT wondering “Is alcohol the new tobacco?” To which I say, well, tobacco companies are absolute cash machines. The best performing stock in the S&P, of all time, to the best of my knowledge, is Altria.
I know investing in tobacco is not fashionable (and yet, how many people do you see on the street vaping?). I know it goes against “ESG” and the scolds at public health slap you on the hand and say “gosh that is very bad for you!”. But the truth is that tobacco does generate tremendous profits — the net income margin for British American Tobacco is 39.1%. For those in the back, that’s for every $1 you sell, you make 39.1 cents of profit. There’s very few businesses with such fantastic operating margins — Visa’s net income margin is 56%. If I owned only one stock forever, I guess it’d probably be Visa.
My point is — waving your hands about and saying “oh no! Tobacco!” belies the economics of it. The tobacco companies are doing very well, thank you very much. It will come as no surprise that cigarette smoking has been replaced by vaping. To paraphrase Oscar Wilde, news of nicotine’s demise has been greatly exaggerated.
This is not saying to invest in tobacco stocks, but my point is that human habits don’t change. They merely evolve, but the song remains the same.
To be fair — alcohol consumption is declining. But it isn’t declining at a rate that calls for any kind of alarm. Most of the companies I follow — Brown Forman, Diageo, Constellation, etc, reported largely flat sales. It’s also instructive to look to history.
In other words — alcohol consumption has largely normalised in the last few decades. There’s still cause for worry — I think wine is one area of concern, and Cognac is another — both industries need to think about how they introduce younger drinkers to their product. This is why I largely shy away from wine (and why Constellation is selling their wine portfolio). “Evergreens” like Guinness (a Diageo brand) and Jack Daniel’s (a Brown-Forman brand) are predictable.
Once again — a bunch of ratios for ya’ll:
Brown-Forman: 18x fwd earnings
Pernod: 12x fwd earnings
Constellation Brands: 13.25x fwd earnings
And so on… these stocks trade like they are discount retailers in biddlybunk Ohio. They are not. There’s the issue. There’s where value lies. Cigarettes never went away; they became vapes. In my opinion, I don’t see booze going away anytime soon either.

I'll be honest here friends it's not looking good...I'll be honest here friends it's not looking good...
This may have been a Dead Cat Bounce on the NASDAQ:QQQ and AMEX:SPY friends.
GAP fills in both names lead to Bear Flag Breakdowns which in my mind leads to the next leg down.
Rejecting 200DMA on the NASDAQ:QQQ and losing control on the AMEX:SPY
Markets are hanging on slightly, lets see what happens the rest of the week.
Not financial advice

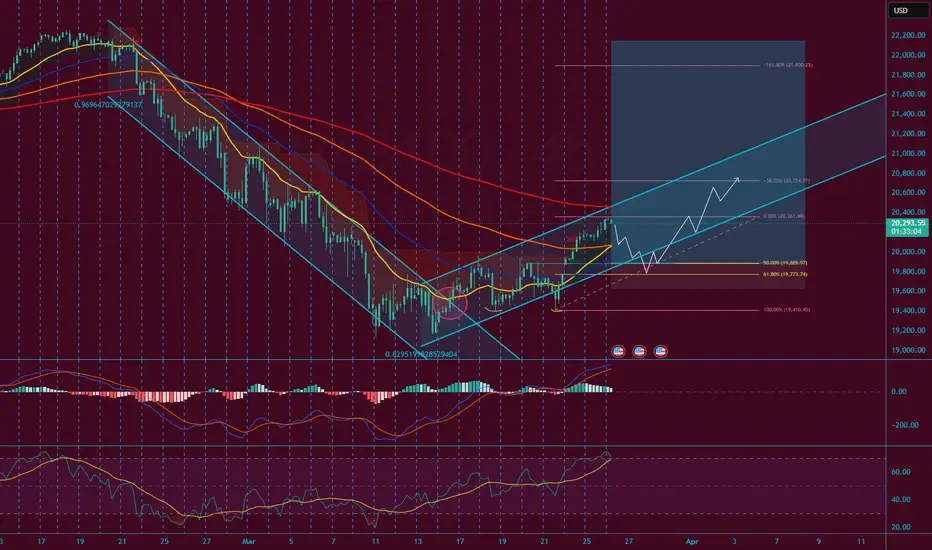
NASDAQ on the first minor pullback of the new bullish wave.Nasdaq / US100 has just started the new bullish wave of the long term Channel Up.
The bottom was made 2 weeks ago and every time the bullish wave crossed over its 4hour MA50, it is expected to make a pullback retest at some point.
This pullback is taking place today.
Whether it replicates the first bullish wave of the Channel Up or the second, the index aims for either a 22.48% total rise or the 1.382 Fibonacci extension.
Both happen to be around the same level.
Buy and target a little under them at 23400.
Previous chart:
Follow us, like the idea and leave a comment below!!

My NQ Long Idea 26/03/2025There is a big technical area that has taken the spotlight in NQ and it is around the 50% fib level with a gap opening.
US economy has seen some strengthening recently with the FED looking neutral-dovish. A price correction may not even occur here it can keep going up continuously the moment we have a conclusive risk-on environment.
Inflation has cooled down from 3.0 to 2.8 and interest rate was held at 4.50 from 4.50.
We are expecting a rate cut of 0.25 bps by Q2 so the market is looking forward to price that in.
I see a potential "buy the rumor" then "sell the news" scenario here. So during the next fomc meeting we may get a small sell off for a price correction then NQ will continue its up momentum.
Technical setup looks good I expect a turbulent price action which will fill the opening gap at the 50% a consolidation here can be healthy for price action before we get a Wyckoff spring.
We have recently exited a bearish channel and entered a new bullish channel which is still in progress but must pay attention to it as we could start trending in that direction.
I may take a short position (for the short term) since I anticipate a correction to the gap at the 50%.
Nasdaq in Correction: Technical Targets and Weekly OutlookWe can observe that Nasdaq has started a new corrective leg since its last recovery in early Q3 2024. Currently, the index is experiencing its first rebound and test of the 20-period moving average (MA20, in green) since this average turned downward. Typically, this scenario triggers a selling reaction, with the first target at the previous low of 19,200. If selling pressure intensifies, the next projections are at 18,300 and 17,900.
However, from a weekly perspective, there is still room for a deeper correction, potentially reaching the 200-period moving average (MA200), which is currently at 15,690. When applying a Fibonacci retracement to the last major bullish leg (Oct 10, 2022 – Feb 17, 2025), we see that the 50% retracement level aligns closely with the weekly MA200 at 16,300.
We know that price movements do not follow a straight line but rather unfold in waves. Given this context, the bias remains bearish, and I see further corrections ahead in the U.S. market.

Nasdaq - Long Strategy I want to be onest.. this is not an easy trade.
This trade can have a final loss but in any case we have many poit to our side with a high propability for e long correction.
We arrive on 0.61 of Long Wave
RSI is in oversold
Attention to put correctly at BE the trade

Tesla Update 3 Whats Next after Target Long Hit Quick recap of the previous level I gave for tesla which is now + 35% off of that level . In this video I use fibs and channels + gann box .
Show your support for continued analysis with a boost and feel free to ask any questions


Nasdaq insights: 26-MAR-2025Good morning, traders! As a seasoned price action trader, I'll share my Nasdaq insights to help you improve your trading skills.

NASDAQ: Short term Channel Up on critical Resistance.Nasdaq is neutral on its 1D technical outlook (RSI = 49.418, MACD = -276.610, ADX = 37.535) as it has recovered from the oversold state of 2 weeks ago. By doing so, it has formed a Channel Up on the 1H timeframe but as the price hit its top and the 1H RSI has formed a bearish divergence like the previous HH, it is possible to see a quick pullback. As long as the price stays inside the Channel Up, target the 1H MA200 (TP = 19,900). If it crosses above the top of the Channel Up, buy and target the R1 level (TP = 20,650).
## If you like our free content follow our profile to get more daily ideas. ##
## Comments and likes are greatly appreciated. ##

US100 Short Fear rises of FED possible ,,No-Rates Cut,,!wE CAN SIMPLY TELL THE SAME REASON trading stocks,indices! Simple: Economy under big inflation pressure.
2 approaches:Conservative and agressive entry. Where breakout traders enter,where others put their takeprofits,where others put stops: Thats my entry.Simple.
Near details ,please take a look at the chart above

Why we think SBC Medical Group is set for a rebound soon.Executive Summary:
SBC Medical Group Holdings Incorporated has emerged as one of the more compelling names in the post-SPAC public company landscape. Having successfully completed its business combination with Pono Capital Two, Inc. on 17 September 2024, the Japan-based aesthetic medical services provider now trades on Nasdaq under the ticker “SBC”. The SPAC merger valued the company at approximately USD1 billion and provided it with over USD11.7 million in net proceeds; capital that SBC intends to deploy strategically for international growth and asset diversification.
Key Investment Pointers:
At the heart of SBC Medical’s proposition is its extensive network of franchised and managed clinics in Japan, with forays into Vietnam and the United States. The company offers management services to cosmetic surgery and aesthetic dermatology clinics under the renowned “Shonan Beauty Clinic” brand, covering procurement, HR, customer loyalty, and more.
The SPAC listing has provided it with both visibility and liquidity at a time when demand for aesthetic healthcare continues to rise across Asia and globally.
The Group’s third-quarter results, covering the period ended 30 September 2024, underscore its operational strength. SBC posted total net revenues of USD53.1 million for Q3, a 12.3% year-on-year increase. Gross profit surged to USD43.2 million, yielding a gross margin of over 81%, reflective of the company’s high-margin service model.
While operating income dipped compared to the prior year due to a one-off non-cash stock-based compensation expense of USD12.8 million, net income for the nine-month period still rose to USD40.1 million, a 60% increase compared to the same period in 2023.
Its balance sheet tells a story of disciplined financial management and scalability. As of 30 September 2024, SBC held USD137.4 million in cash and cash equivalents, up from USD103 million at the end of 2023.
The company also saw a significant reduction in total liabilities from USD115 million to USD91 million, while shareholder equity rose to over USD205 million. These figures point to a solid capital base capable of absorbing strategic investments and macroeconomic volatility.
In a move that has drawn considerable market attention, SBC Medical has also initiated a diversification of its corporate treasury into Bitcoin.
With the cryptocurrency having rebounded strongly to the USD86,000 level, SBC’s entry appears both timely and calculated. While the exact volume of the acquisition has yet to be disclosed publicly, the Group has indicated that its Bitcoin holdings are part of a broader strategy to preserve purchasing power in a globally inflationary environment and align itself with digital-native investors. The decision places SBC in the company of firms like MicroStrategy and Tesla, which have similarly sought value preservation through Bitcoin.
The strategic trifecta of a successful SPAC listing, strong underlying financials, and an asset diversification play into Bitcoin positions SBC Medical favourably in the eyes of institutional investors. With Q4 results expected soon and a bullish cryptocurrency market supporting sentiment, SBC could well be on the cusp of a re-rating by the market.
If its fundamentals remain sound—as recent filings suggest—they may indeed ride the same momentum wave currently lifting digital assets and new-age healthcare stocks alike.

NAS100USD Buy Idea: Bullish Momentum Targets 20705🚀 OANDA:NAS100USD Buy Idea: Bullish Momentum Targets 20705 💹 - 24h expiry
OANDA:NAS100USD - We look to Buy at 20025
Stop Loss: 19825
Target 1: 20705
Target 2: 20730
Resistance: 20234, 20705, 20730
Support: 20025, 19423, 19125
Technical Setup:
📈 Continued upward momentum from 19424 resulted in the pair posting net daily gains yesterday .
⚠️ Overbought extremes indicate scope for mild selling at the open, but losses should remain limited .
🔑 Medium-term bias remains bullish .
🏁 Key resistance level at 20705 .
📰 News Sentiment
📊 Recent sessions show a bullish uptick in News Sentiment (Red Line), aligning with the price movement (Blue Line).
🌟 Positive sentiment (Red Line) is extending higher, suggesting further upside potential in the short term.
Risk Disclaimer
The trade ideas beyond this page are for informational purposes only and do not constitute investment advice or a solicitation to trade. This information is provided by Signal Centre, a third-party unaffiliated with OANDA, and is intended for general circulation only. OANDA does not guarantee the accuracy of this information and assumes no responsibilities for the information provided by the third party. The information does not take into account the specific investment objectives, financial situation, or particular needs of any particular person. You should take into account your specific investment objectives, financial situation, and particular needs before making a commitment to trade, including seeking advice from an independent financial adviser regarding the suitability of the investment, under a separate engagement, as you deem fit.
You accept that you assume all risks in independently viewing the contents and selecting a chosen strategy.
Where the research is distributed in Singapore to a person who is not an Accredited Investor, Expert Investor or an Institutional Investor, Oanda Asia Pacific Pte Ltd (“OAP“) accepts legal responsibility for the contents of the report to such persons only to the extent required by law. Singapore customers should contact OAP at 6579 8289 for matters arising from, or in connection with, the information/research distributed.

Will NASDAQ Rally Continue? Technical Analysis & Trade Idea.NASDAQ NAS100 (4H Chart) Analysis 📊📈
The NASDAQ NAS100 is showing strong bullish momentum on the 4-hour chart. The chart suggests a continuation of the uptrend, with a potential move toward the 21,013.0 target. 🚀
Key Levels to Watch 👀
Support Levels:
19,750.9: Near the 61.8% Fibonacci retracement, this level has seen strong buying interest.
19,405.8: The 100% Fibonacci retracement, marking the swing low and a critical support zone.
Resistance Levels:
20,209.4: The 0% Fibonacci retracement, acting as immediate resistance.
20,611.2: The 50% Fibonacci extension, a key target for bullish continuation.
21,013.0: The 100% Fibonacci extension, representing the ultimate bullish target in this trend.
Volume Profile Insights 📉
The Volume Profile shows heavy trading activity between 19,800–20,000, confirming strong support in this range. Above 20,200, trading volume thins out, suggesting that a breakout could lead to a quick rally toward 21,000.
Momentum and Indicators ⚡
Trend: The index is in a clear uptrend, forming higher highs and higher lows since the recent swing low.
Fibonacci Confluence: The alignment of the 50% retracement and Volume Profile support strengthens the bullish outlook.
Curved Arrow Projection: A pullback to the 19,800–19,750 zone is likely before the next leg higher toward 21,013.0.
Social Media Sentiment 🌐
Twitter: Analysts are optimistic, citing strong tech sector performance and easing interest rate fears. Many traders are eyeing the 21,000 level as the next milestone.
Reddit: Discussions emphasize the importance of the 19,800 support zone, warning that a break below this level could invalidate the bullish setup.
Conclusion 📝
The NASDAQ NAS100 is set for a bullish continuation, with key support at 19,750–19,800 and resistance at 20,209.4 and 21,013.0. Watch for a potential pullback to the 50% Fibonacci retracement before the next upward move. A break below 19,750 could signal a shift in momentum, while a breakout above 20,209.4 would confirm the bullish trend. 🚀
Disclaimer: This analysis is for informational purposes only and not financial advice. Always do your own research and consult a professional before trading. 📢

Nasdaq analysis: 25-MAR-2025Good morning, trading community! Today's Nasdaq analysis is for you. Share your thoughts, ask questions, and let me help you grow.

Today analysis for Nasdaq, Oil, and GoldNasdaq
The Nasdaq closed higher, forming a gap up on the daily chart. It showed a strong, one-directional rebound up to the 5-week moving average on the weekly chart.
Since the 5-week MA overlaps with the 60-week MA, it's unlikely to break through easily without a short-term correction.
On the daily chart, the MACD has formed a golden cross, meaning that even if a pullback occurs, the strategy should remain buy-on-dip oriented.
There is still an open gap down to 19,960, which could be filled at any time—so it's important to consider the possibility of a retest of that level. If the gap is filled, that area could be a good support zone to buy from.
On the 240-minute chart, strong buying momentum entered around the zero line, confirming a breakout after basing in a range. Therefore, buying on pullbacks remains the preferred approach in this structure.
Crude Oil
Crude oil continued its upward move, closing higher on the daily chart.
With strong support around the $68 level, the market could potentially rise toward the $70 zone, and possibly test resistance between $70–$71, which is a key area to watch closely.
Overall, traders should continue to buy on dips, but be cautious with chasing long positions above $70. If taking short positions, they should be managed with tight stop-losses.
On the 240-minute chart, oil appears to be in the midst of a third wave rally, so any short positions should be considered above $70, while buying pullbacks remains valid.
Current Middle East tensions and U.S. sanctions on Venezuelan oil are contributing to a supply risk premium in oil prices.
Since the market is recovering from the lows and showing a positive technical setup, short trades should be managed carefully with proper risk control.
Gold
Gold closed lower, remaining within its range-bound structure. On the daily chart, gold is currently trading between the 3-day and 5-day MAs above, and the 10-day MA below, forming a narrow consolidation zone. This makes sell-at-highs and buy-at-lows strategies effective.
Since there's room for a pullback to the 5-week MA on the weekly chart, chasing longs is not advised. If the MACD crosses below the signal line, this could create a bearish divergence, leading to potential sharp downside, so caution is warranted.
On the 240-minute chart, the MACD is failing to break above the signal line and continues to decline. However, since the signal line remains above the zero line, a rebound attempt is likely, even if the MACD dips below zero.
Given the current slope and distance, it's unlikely that a golden cross will form soon. Also, traders should keep in mind that major economic data such as GDP and PCE reports are scheduled later this week, which could influence market direction.
If you can understand the daily chart structure, you can better anticipate intraday high/low ranges and potential wave patterns. Make it a habit to perform thorough daily chart analysis each day, and prepare a trading scenario that suits the market’s behavior. As always, questions are welcome.
Wishing you a successful trading day!
If you like my analysis, please follow me and give it a boost!
For additional strategies for today, check out my profile. Thank you!