TSLA SELLING PRESSURE MAY REDUCE AS SHARE PRICE DIPS INTO SUPPORTesla’s support level between 200 and 260 may act as a buffer to hold the share price amid ongoing selling pressure. Will there be rejections on TSLA in coming week(s)?
N.B!
- TSLA price might not follow the drawn lines . Actual price movements may likely differ from the forecast.
- Let emotions and sentiments work for you
- ALWAYS Use Proper Risk Management In Your Trades
#tsla
#nasdaq
#nyse
Nasdaq


Possible NQ Bounce Starting Monday 3/10/25Monday and the rest of the coming week could be the start of the NQ making a bounce. If not, it's look out below with a break of 20,000 going to 19,000 rather quickly. Price will dictate how we go but a good bounce is not out of the question. Watch the video for more details.
Feel free to leave your comments.
Thanks for watching.

The Ultimate Golden Zone to Close Shorts and flip Long TESLA Must Watch Analysis on TSLA revealing the ultimate golden zone to fill your Longs and close your shorts.
In this video I pinpoint a high probability zone of where to take the next long .
I have used a suite of Fibonacci tools to include TR Pocket , Trend based fib, pitch fan , 0.618, VWAP and volume profile to determine the best Long.

NASDAQ Potential Bullish Retracement (After Major Correction)NASDAQ price seems to exhibit signs of a major correction as the price action has broken out of it's range.
During the pandemic (Covid-19), NASDAQ experienced two major corrections (worth drops of approx. 18.35% and approx. 24%). Counting these two massive corrections as anomalies, the NASDAQ on average retraces maximum around approx. 17% - 18.5% from a historical perspective.
Once the selling subsides we may potentially see the formation of a credible Higher Low on the Longer Timeframes with multiple confluences from key Fibonacci and Support levels.
The current Trade Plan caters to a drop of approx. 22.5% (to be on the safer side and potentially accounts for a major correction excluding massive systematic failure).
Trade Plan :
Entry @ 19250
Stop Loss @ 17140
TP 1 @ 21360 (Before All Time High)
TP 2 @ 23470 (After All Time High)
Note: Move Stop Loss to Break Even if TP 1 hits.

Nasdaq 100 drops below 20K after NFP, but could it rebound?The Nasdaq and S&P 500 were testing their weekly lows after what has been a bruising last few session. But with both indices testing their respective key support areas, could we see a recovery from around the current levels, especially in light of a weaker US jobs report?
Keep an eye on the area around 20,000 on the Nasdaq, where the Trump rally commenced back in November. It is a key psychological area for the market. Can we see a bounce, or will the selling continue as we head deeper into the US session?
At the time of writing, the index was below this level, but the session is not over yet. In any case, a confirmed reversal on the lower time frames should be observed by traders looking to potentially buy this dip. For example, if the index recovers to go bac above yesterday's low of 20180, that would be a bullish sign in my view. But right now it is looking quite bleak.
By Fawad Razaqzada, market analyst with FOREX.com

Don't expect bounce in Crypto without #Nasdaq
#NASDAQ NEAR 10% DOWN AND TESTING SUPPORT OF RISING CHANNEL..
US index erased all post election gain. Interesting to see that will Trump come to support or he continue create uncertainty in market.
RSI reach below 30 , oversold. So we can expect a bounce from here..
Job data, CPI and FOMC meeting on March 19 will decide major move in coming days.
CRYPTOCAP:BTC range is FWB:83K -$95k nd FWB:73K -$110k
#bitcoin

Nasdaq market analysis: 07-MAR-2025Let’s dive into today's Nasdaq market analysis. Share insights, and potentially spot opportunities for good pips.

Combined US Indexes - Breakdown and JittersMarked out previously, the US indexes broke down a tad earlier and retested to fail only to drop further based on jitters and jitter-induced expectations.
While the candlestick is long and solid pretty much, there is an extension zone to expect more of the downside to overreach and be oversold before a bounce.
You should be able to see that the Buy Setup is pretty much done and can expect a bounce reversal soon... but only after momentum ebbs and a base support is found.
Watch for it...

NASDAQ Ultimate Support test on the 1week MA50.Nasdaq / US100 is trading inside a Channel Up since the start of this Bull Cycle after the late 2022 bottom.
The price is about to test the 1week MA50, which is the ultimate Support of this bullish trend and has been holding since March 13 2023 (almost 2 years).
It is important for the index to keep a weekly closing over it. If it does we will have the most optimal buy entry case.
The previous two bullish waves interestingly enough both increased by +49.55%.
Buy and target 25500.
Follow us, like the idea and leave a comment below!!

MNQ!/NQ1! Day Trade Plan for 03/06/2025MNQ!/NQ1! Day Trade Plan for 03/06/2025
📈20420 20515
📉20235 20140
Like and share for more daily ES/NQ levels 🤓📈📉🎯💰
*These levels are derived from comprehensive backtesting and research and a quantitative system demonstrating high accuracy. This statistical foundation suggests that price movements are likely to exceed initial estimates.*

Nasdaq analysis: 06-MAR-2025Good morning, everyone! Today's Nasdaq analysis is designed to educate and empower. Use these insights to refine your price action trading strategy.

MNQ!/NQ1! Day Trade Plan for 03/05/2025MNQ!/NQ1! Day Trade Plan for 03/05/2025
📈20515 20610
📉20330 20240
Like and share for more daily ES/NQ levels 🤓📈📉🎯💰
*These levels are derived from comprehensive backtesting and research and a quantitative system demonstrating high accuracy. This statistical foundation suggests that price movements are likely to exceed initial estimates.*

Googles next Move where to Long next + Wickless Candles Hi in this video I highlight what to look for in the chart to take shorts and where to fill Longs next . In addition to that I provide a small educational idea of looking out for Wickless candles and how they can add value to your analysis . Please like follow share and ask any questions that you have and thankyou for your support

Google Update - Trade this range and new ATH Identified Update video on the google Long that has been planned since early FEB. The level has now been hit and we got a nice reaction off that level . In this video I look into where I think we go next and how price plays out .
In the video I use the following tools TR Pocket FIB , 0.618 FIB , Pivots , Parallel Channel and the Fixed range Vol Profile.
If we stay range bound inside the channel then we have the potential to see a new high on google at the top of the channel in confluence with 1-1 ext + tr pocket expansion .
Watch the video and mark the levels on your chart and ensure to set your alerts .
Dont forget to Boost the chart Please and i welcome any questions TY

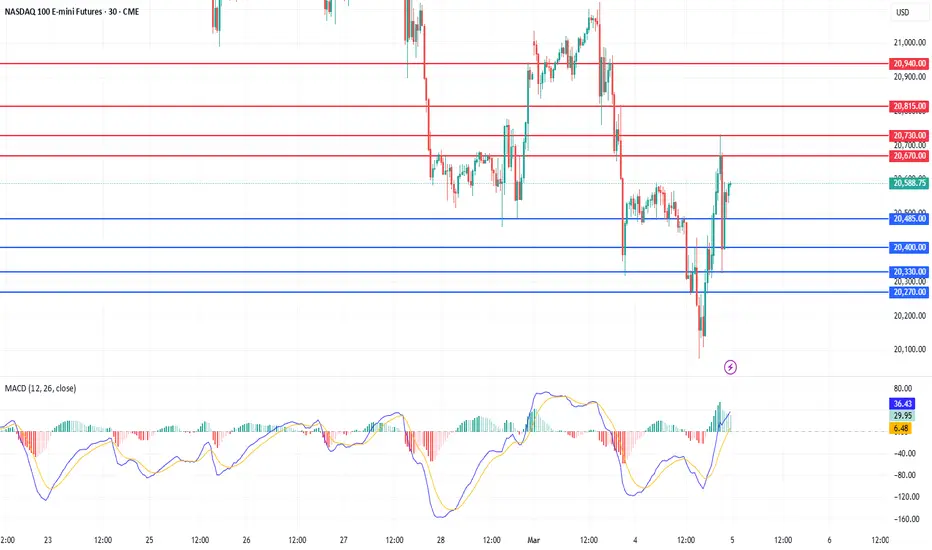
2025-03-05 - priceactiontds - daily update - nasdaq
Good Evening and I hope you are well.
comment: Market made a lower high. Most important fact today. Higher low also but for bears it was more important than for the bulls. Range is contracting between 20300 and 20730, so play it. News bombs will likely determine what we will do tomorrow. Embrace the volatility. Trade small and take profits along the way.
current market cycle: trading range - only daily closes below 20000 mark the end of this bull trend
key levels: 20300 - 20730 (above 20730 we will likely go for 21k / below 20300 is 20000)
bull case: Bulls are in reach to break the bear channel and melt higher again. They need to break above tomorrow or bears might do the unthinkable and go below 20000 into the weekend. We have corrected 10% from the ath and a bounce would be a bit more fitting than continuation. My W2 target is around 21200. Very important for bulls is to print higher lows tomorrow, means staying above 20215.
Invalidation is below 20215.
bear case: Bears continue to have deep intraday bear legs so bulls are not too happy in buying high, which is probably why we are contracting again. Bears want to continue this sharp sell off into the weekend, likely below the big round number 20000. They are still in control until the bear channel is broken.
Invalidation is above 21740.
short term: Neutral but I kinda slightly favor the bulls since we are at the 2024-11, 2025-02 and 2025-01 support. If the bear channel continues, so be it. Happily shorting this for 20k then but I’d be more surprised if we do not make new highs above 20740 tomorrow and test 21k again.
medium-long term - Update from 2024-02-23: Neutral since we are in a 4-5 month trading range. Still leaning heavily bearish for this year but for now it’s sideways until we get consecutive daily closes below 20000.
trade of the day: Range was clear and given, have to play it. Both sides made good money today.

NASDAQ: 4H Death Cross always signals a rally.Nasdaq in bearish on its 1D technical outlook (RSI = 38.073, MACD = -289.260, ADX = 41.209) as the mid February bearish wave hit the bottom of the September Channel Up. The formation of a Death Cross on the 4H timeframe has favored buying inside this pattern. In the meantime, the 4H RSI has been rising while the price was correcting, indicating the presence of a Bullish Divergence. Buy and aim for another +16% rise (TP = 23,200).
## If you like our free content follow our profile to get more daily ideas. ##
## Comments and likes are greatly appreciated. ##

SPX S&P 500 Gearing Up For A 10x Over Next 10 yearsSPX looks extremely bullish and the patterns are obvious to me. This parabola will continue into the 2030's and be even more vertical than we've seen in any prior runs. This next decade is going to be wonderful. There may be some corrections along the way but in the bigger picture we are going to go absolutely vertical. Hold onto your hats.
None of this is financial advice just my opinion.

Actionable Nasdaq insights: 05-Mar-2025Rise and shine, traders! Start your day with actionable Nasdaq insights. Let's grow your skills together, one chart at a time.

Today analysis for Nasdaq, Oil, and GoldNasdaq
The Nasdaq closed lower as market volatility increased due to tariff concerns. Although the index dropped below the 240-day moving average, it formed a lower wick, indicating an attempt to establish a short-term bottom. On continuous futures, the 240-day MA is slightly below 20,000, meaning that the 20,100–20,000 zone is a key support area where a technical rebound is likely following the recent sharp decline. If the market falls into this zone, it could present a swing buying opportunity. Since the daily MACD and signal line are dropping steeply, a sideways consolidation period may be necessary to reduce their angle and separation before further directional movement.
Given that the Nasdaq rebounded strongly after forming a lower wick yesterday, a pullback in pre-market trading could provide a buy-the-dip opportunity. Additionally, potential bullish catalysts include today’s ADP Non-Farm Employment data and Friday’s Non-Farm Payroll report.
On the 240-minute chart, the index is forming a bullish divergence and attempting a golden cross, reinforcing the buy-the-dip strategy at current levels. Therefore, chasing shorts is not advisable, as the Nasdaq has entered a more attractive buying zone. A range-trading approach remains effective, with a preference for buying near support.
Crude Oil
Crude oil closed lower, finding support near previous demand zones. Despite the continued downtrend, the $66–67 range remains a strong support area, making it a potential rebound zone for technical buyers. However, on the daily chart, the MACD and signal line are sloping downward sharply, meaning that selling pressure could intensify further. Long positions should be initiated as close to the lower support zone as possible.
On the 240-minute chart, the MACD has formed another bearish crossover, confirming strong selling momentum. However, when compared to the previous MACD level near $68.50, price has declined further, but the MACD has not dropped as low, suggesting a potential bullish divergence. Since this zone has historically acted as strong support, a buy-the-dip strategy remains preferable, but traders should remain cautious of today’s Crude Oil Inventory report, which could lead to increased volatility.
Gold
Gold closed higher, successfully rebounding from support. Yesterday, gold reached the previously projected target of 2,925, aligning with the 240-day moving average characteristics.
If gold continues higher, the 2,940 level will act as resistance, as this is a previous supply zone on the daily chart. Therefore, further upside should be monitored carefully before making new decisions. Since the daily MACD and signal line remain widely separated, this is not an ideal condition for chasing long positions. Even if gold extends its rally, a pullback is likely, making buying dips a safer approach.
On the 240-minute chart, the MACD formed a golden cross, leading to a sharp rally. As expected, price reached the 60-day MA following the 240-day MA bounce. However, while the MACD has moved above zero, the signal line is still below zero, meaning that another corrective phase could occur before further upside. Additionally, there is a possibility that gold could revisit the 2,850 support zone to form a double-bottom structure, making buying dips a better strategy than chasing breakouts. Overall, a range-trading strategy—buying low and selling high—remains effective, and today’s ADP Non-Farm Employment data could introduce market volatility.
As market conditions shift, risk management remains crucial. Stay disciplined, adapt to volatility, and trade with confidence. Wishing you a successful trading day! 🚀
If you like my analysis, please follow me and give it a boost!
For additional strategies for today, check out my profile. Thank you!
NASDAQ: Madness in the markets THANKS to Trump!! Watch out!!Investors are unwinding their risk positions in the face of the imminent escalation of the global trade war and are seeking refuge in the safest assets. The entry into force of the new US tariffs on Canada and Mexico of 25%, in addition to a doubling of China's taxes to 20%, has triggered falls in the stock markets.
The proposed tariffs represent the highest trade barriers in several decades, and their entry into force distorts supply chains and will increase the prices of capital goods, raw materials, industrial and consumer products, including food that crosses the border. Measures that will push inflation upwards.
---> How far can the price fall?
If we look at the chart above (DAILY timeframe), the price has touched a KEY zone where it could end the retracement phase if it respects it or, on the contrary, start a much deeper bearish phase.
Today it touched it and automatically rebounded, but we have to wait for it to consolidate and for the indicators to start marking a bullish TREND AND STRENGTH (Bull) in H4 and H1 timeframes. This Friday the NFP will be published and therefore it will be a key day in the markets.
If we look at the chart below (H1), the TREND is clearly bearish (Bear), and as long as we do not see a bullish TREND (Bull) in that chart, the end of the retracement cannot be considered finished.
--> What strategy can we follow?
If our PROFILE is AGGRESSIVE, we are in a very good area to enter long, but if our PROFILE is CONSERVATIVE, we should wait for the H1 or H4 timeframe chart to show an upward TREND and STRENGTH (Bull).
Conclusion:
Mr. TRUMP and his CRAZY way of attacking the WORLD, has BROKEN the markets and now we just need to see when he decides to back down and CALM the markets down again... because HE WILL DO IT!!! He is a MARKET MANIPULATOR and that is the problem (FOR EXAMPLE WHAT HE DID 2 DAYS AGO WITH THE CRYPTOCURRENCIES CARDANO, SOLANA AND RIPPLE). He uses his messages to manipulate everything and SOMEONE SHOULD STOP HIM... Warren Buffet might do it at any moment :-).
Greetings and good luck because we are in a difficult time to invest in a stable way.

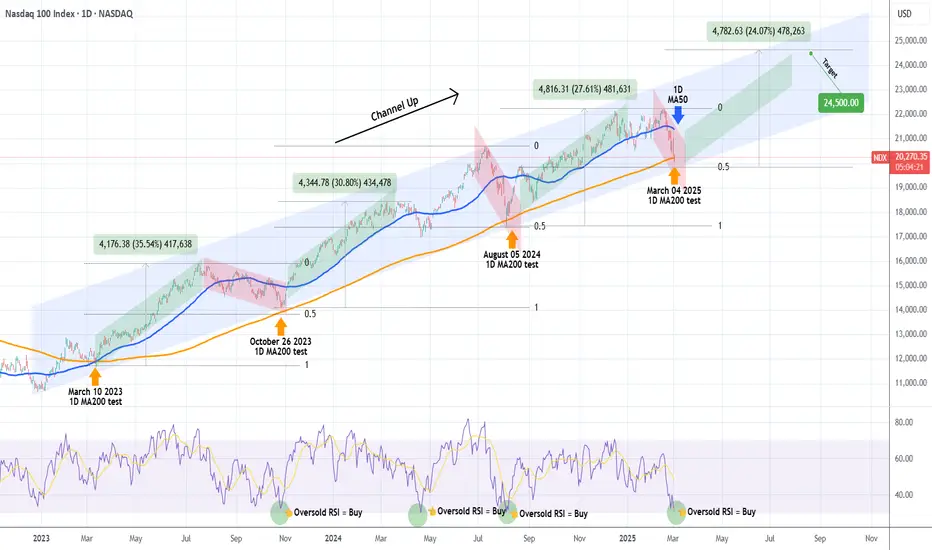
NASDAQ hit its 1D MA200. Strongest buy signal in 2 years!Nasdaq (NDX) hit today its 1D MA200 (orange trend-line) for the first time in 7 months (since the August 05 2024 Low) with its 1D RSI almost oversold (below 30.00). In the past 2 years (since the March 10 2023 test), the 1D MA200 has been tested another 3 times, all of which have been the absolute technical buy entries, kick-starting enormous rallies.
On top of that, the price is close to the bottom (Higher Lows trend-line) of the long-term Channel Up that started on the December 2022 market bottom. Every rally that followed after a 1D MA200 test has been marginally weaker than the previous but all three have been around +30% on average. The last one has been +27.61%, which is -3% weaker than the previous.
As a result, we are expecting a new rally to start now as all buy conditions within a 2-year span have been met (1D MA200, oversold 1D RSI) that can target 24500, which represents a +24.00% rally (-3% shorter rise than the previous).
-------------------------------------------------------------------------------
** Please LIKE 👍, FOLLOW ✅, SHARE 🙌 and COMMENT ✍ if you enjoy this idea! Also share your ideas and charts in the comments section below! This is best way to keep it relevant, support us, keep the content here free and allow the idea to reach as many people as possible. **
-------------------------------------------------------------------------------
💸💸💸💸💸💸
👇 👇 👇 👇 👇 👇
Nasdaq100 - Where could we go?NASDAQ:QQQ
If we lose this Bullish Channel then here are the levels...
Level 1: $445-$450
Level 2: $385-$400
Not financial advice
