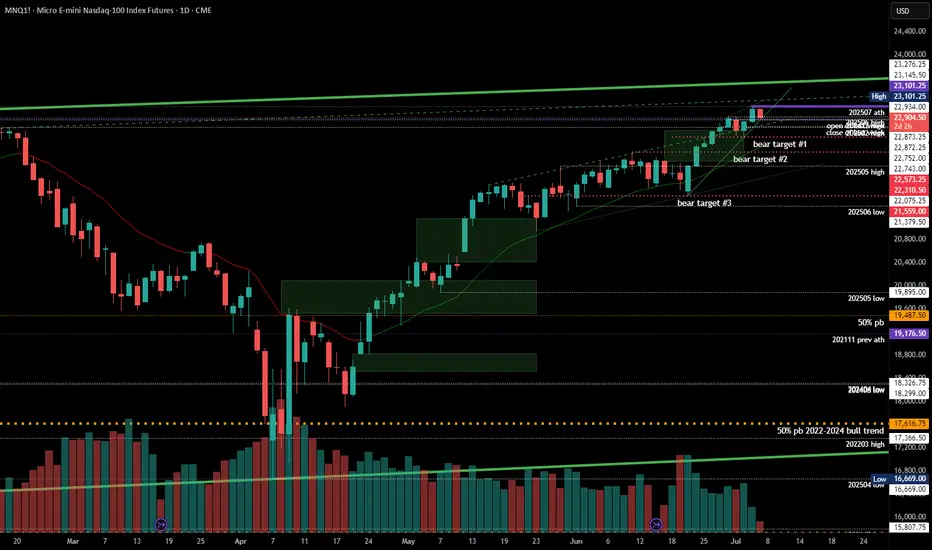
NASDAQ After the Fireworks: Bearish Setup LoadedAfter the classic 4th of July rally, I stepped in on the short side of Nasdaq, targeting 22,000 and 21,400 zones. The market structure shows exhaustion, and with the cloud retest failing to hold new highs, I positioned accordingly.
Technical:
• Price stalled at prior expansion highs with tight compression near 23,000.
• Daily FibCloud offered resistance confirmation.
• Bearish risk-reward skew forms after extended rally and thin retraces.
• Volume divergence spotted.
Fundamentals:
Multiple overlapping uncertainties:
• Trump confirmed tariffs will take effect on August 1, threatening a 10% surcharge on BRICS-aligned nations.
• Treasury Secretary Bessent anticipates several trade deal announcements within 48h—but stresses quality over quantity.
• Bank of America maintains its base case of 0 rate cuts in 2025, citing strong economic data and sticky inflation risks.
The combination of tariff escalation, hawkish monetary expectations, and global trade friction creates a perfect backdrop for volatility and correction—especially in overextended tech indices like the Nasdaq.
Note: Please remember to adjust this trade idea according to your individual trading conditions, including position size, broker-specific price variations, and any relevant external factors. Every trader’s situation is unique, so it’s crucial to tailor your approach to your own risk tolerance and market environment.
Nasdaq

XAU/USD : Get Ready for Another Fall ! (READ THE CAPTION)By analyzing the gold chart on the 4-hour timeframe, we can see that, as expected from our previous analysis, when the price was trading around $3327, it climbed to the supply zone at $3345. After reaching this key level, strong selling pressure emerged, leading to a sharp drop in gold today down to $3296.
This move played out exactly as anticipated, and now, if the price stabilizes below $3330, we could expect further downside pressure on gold.
The Main Analysis :

Bollinger Bands: How to Stop Being a Slave to the Markets.Bollinger Bands are a technical analysis indicator widely used in trading to assess the volatility of a financial asset and anticipate price movements. Created in the 1980s by John Bollinger, they consist of three lines superimposed on the price chart:
The middle band: a simple moving average, generally calculated over 20 periods.
The upper band: the moving average to which two standard deviations are added.
The lower band: the moving average to which two standard deviations are subtracted.
These bands form a dynamic channel around the price, which widens during periods of high volatility and narrows when the market is calm. When a price touches or exceeds a band, it can signal an overbought or oversold situation, or a potential trend reversal or continuation, depending on the market context.
What are Bollinger Bands used for?
Measuring volatility: The wider the bands, the higher the volatility.
Identify dynamic support and resistance zones.
Detect market excesses: A price touching the upper or lower band may indicate a temporary excess.
Anticipate reversals or consolidations: A tightening of the bands often heralds an upcoming burst of volatility.
Why is the 2-hour time frame so widely used and relevant?
The 2-hour (H2) time frame (TU) is particularly popular with many traders for several reasons:
Perfect balance between noise and relevance: The H2 offers a compromise between very short time frames (often too noisy, generating many false signals) and long time frames (slower to react). This allows you to capture significant movements without being overwhelmed by minor fluctuations.
Suitable for swing trading and intraday trading: This TU allows you to hold a position for several hours or days, while maintaining good responsiveness to take advantage of intermediate trends.
Clearer reading of chart patterns: Technical patterns (triangles, double tops, Wolfe waves, etc.) are often clearer and more reliable on H2 than on shorter time frames, making decision-making easier.
Less stress, better time management: On H2, there's no need to constantly monitor screens. Monitoring every two hours is sufficient, which is ideal for active traders who don't want to be slaves to the market.
Statistical relevance: Numerous backtests show that technical signals (such as those from Bollinger Bands) are more robust and less prone to false signals on this intermediate time frame.
In summary, the 2-hour time frame is often considered "amazing" because it combines the precision of intraday trading with the reliability of swing trading, thus providing superior signals for most technical strategies, particularly those using Bollinger Bands.
To summarize
Bollinger Bands measure volatility and help identify overbought/oversold areas or potential reversals.
The 2-hour timeframe is highly valued because it filters out market noise while remaining sufficiently responsive, making it particularly useful for technical analysis and trading decision-making.

Nasdaq 100: Bearish Signals Near the All-Time HighNasdaq 100: Bearish Signals Near the All-Time High
As the 4-hour chart of the Nasdaq 100 (US Tech 100 mini on FXOpen) shows, the index reached a new all-time high last week. However, the price action suggests that the current pace of growth may not last.
Last week’s strong labour market data triggered a significant bullish impulse. However, the upward momentum has been entirely retraced (as indicated by the arrows).
The tax cut bill signed on Friday, 4 July, by Trump — which is expected to lead to a significant increase in US government debt — contributed to a modest bullish gap at today’s market open. Yet, as trading progressed during the Asian session, the index declined.
This suggests that fundamental news, which could have served as bullish catalysts, are failing to generate sustainable upward movement — a bearish sign.
Further grounds for doubt regarding the index's continued growth are provided by technical analysis of the Nasdaq 100 (US Tech 100 mini on FXOpen) chart, specifically:
→ a bearish divergence on the RSI indicator;
→ price proximity to the upper boundary of the ascending channel, which is considered resistance.
It is reasonable to suggest that the market may be overheated and that bullish momentum is waning. Consequently, a correction may be forming — potentially involving a test of the 22,100 level. This level acted as resistance from late 2024 until it was broken by strong bullish momentum in late June.
This article represents the opinion of the Companies operating under the FXOpen brand only. It is not to be construed as an offer, solicitation, or recommendation with respect to products and services provided by the Companies operating under the FXOpen brand, nor is it to be considered financial advice.

NAS100 - Stock market is waiting for tariffs!The index is above the EMA200 and EMA50 on the four-hour timeframe and is trading in its ascending channel. Maintaining the ascending channel will lead to the continuation of the Nasdaq's upward path to higher targets, but if it does not rise and corrects towards the demand limits, you can buy the Nasdaq index with appropriate reward and risk.
Three months ago, Donald Trump postponed the imposition of severe retaliatory tariffs, granting America’s major trading partners more time to reach new agreements that Washington views as “fairer.” Now, as the White House’s July 9 deadline approaches, only two official trade deals have been finalized—one with the United Kingdom and another with Vietnam. As for China, merely a fragile temporary truce has been reached, which has so far prevented any additional tariffs from being enforced.
Although reports suggest promising progress in negotiations with India, Japan, and South Korea, no final agreements have been secured with these countries yet. Interestingly, talks with the European Union—which had previously stalled—have suddenly taken a positive turn, and prospects for a deal with Canada in the coming days have also improved.
However, given the limited time left, it seems unlikely that trade agreements with all of America’s 18 key partners will be reached before the deadline. This situation has raised a critical question for the markets: Will Trump set a new deadline for the remaining countries, or will the suspended tariffs be reinstated?
The prevailing view is that the U.S. president will once again resort to threats before granting any extensions—this time not merely by reviving the “Liberation Day” tariffs, but also by promising even heavier tariffs to extract the last concessions from the remaining trade partners.
U.S. Treasury Secretary Scott Bassett stated that if no agreements are reached by August 1, tariffs will revert to the levels announced in April. He also emphasized that Washington’s core strategy in these trade talks is to apply maximum pressure. According to Bassett, letters will be sent to various countries, outlining the August 1 deadline for reaching deals. This news, which broke during the market’s closing hours, sparked a wave of risk appetite in the financial markets.
In a week when the U.S. economic calendar is notably devoid of major data releases, investors are focusing their attention on the minutes from the Federal Reserve’s June FOMC meeting—a document that could offer fresh insights into the trajectory of interest rates for the second half of the year.
June’s strong employment report, which exceeded market expectations, has effectively dashed hopes for an interest rate cut this month. Now, if the positive economic momentum persists, the likelihood of a rate cut in the September meeting may also gradually be priced out by the markets.
According to data from Challenger, Gray & Christmas, U.S. employers announced 47,999 job cuts in June, marking a sharp decline from 93,816 in the previous month. Compared to June of last year, layoffs have dropped by 2%. However, total job cuts in the second quarter of 2025 reached 247,256—a 39% increase from the same period last year (177,391) and the highest second-quarter layoff figure since 2020.
With no significant economic reports scheduled for the coming days, investors will be closely analyzing Wednesday night’s Fed minutes and the limited remarks from central bank officials—statements where every word has the potential to significantly move the markets.

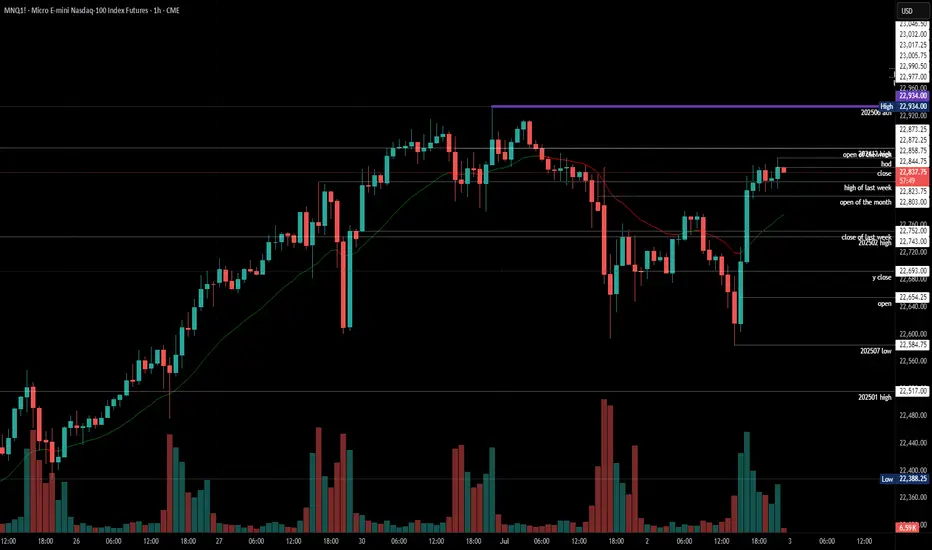
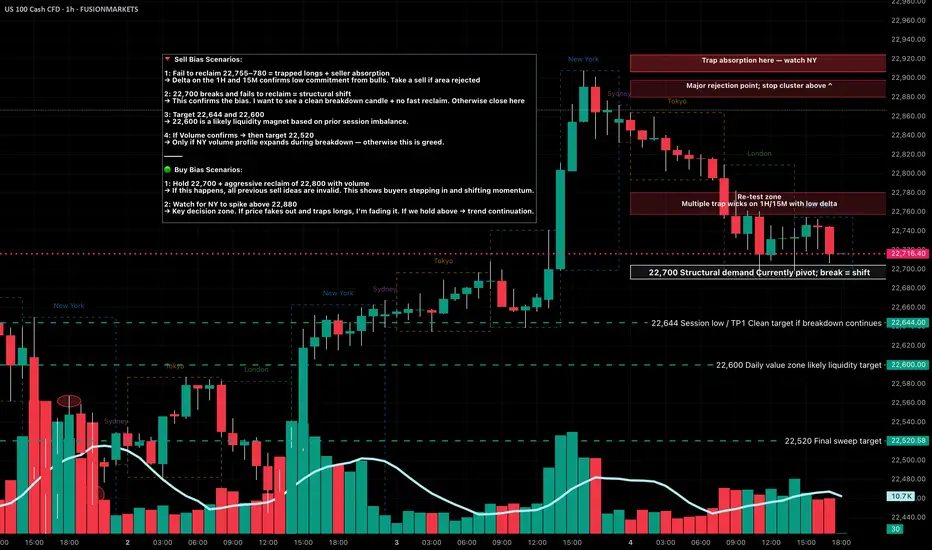
NASDAQ Key Levels July 7 2025If NY fails to reclaim 22,755–780 early in the week, expect a grind back toward 22,644 → 22,600, with 22,520 in play only if volume confirms. Reclaiming and holding above 22,800+ would invalidate this bearish setup.
Watch for trap volume, delta reversals, and volume imbalances at all key zones before entering.
22,880 – 🔻 Weekly wick top
➤ Major rejection zone with a stop cluster sitting above.
22,800–820 – Possible NY trap zone
➤ Trap absorption detected here on footprint — watch New York for rejection or breakout.
22,755–22,780 – Retest zone
➤ Multiple trap wicks with low delta on 1H/15M. Likely to bait breakout traders before fading.
22,700 – Structural demand / pivot point
➤ A clean break + hold below = bearish market shift.
22,644 – ✅ Session low / Take Profit 1
➤ If 22,700 breaks, this is the first clean downside target.
22,600 – Daily value zone
➤ High-probability liquidity target if selling extends below 22,644.
22,520 – Final sweep target
➤ Only likely if New York session sells off hard mid-to-late week.
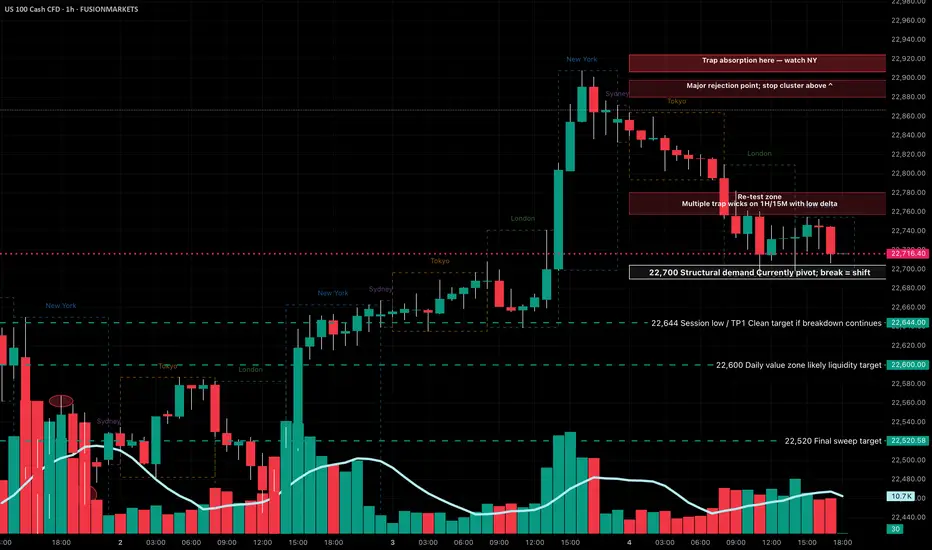
NASDAQ Key Levels July 7 2025If NY fails to reclaim 22,755–780 early in the week, expect a grind back toward 22,644 → 22,600, with 22,520 in play only if volume confirms. Reclaiming and holding above 22,800+ would invalidate this bearish setup.
Watch for trap volume, delta reversals, and volume imbalances at all key zones before entering.
22,880 – 🔻 Weekly wick top
➤ Major rejection zone with a stop cluster sitting above.
22,800–820 – 🧱 Possible NY trap zone
➤ Trap absorption detected here on footprint — watch New York for rejection or breakout.
22,755–22,780 – 🔁 Retest zone
➤ Multiple trap wicks with low delta on 1H/15M. Likely to bait breakout traders before fading.
22,700 – ⚠️ Structural demand / pivot point
➤ A clean break + hold below = bearish market shift.
22,644 – ✅ Session low / Take Profit 1
➤ If 22,700 breaks, this is the first clean downside target.
22,600 – 🎯 Daily value zone
➤ High-probability liquidity target if selling extends below 22,644.
22,520 – 🧨 Final sweep target
➤ Only likely if New York session sells off hard mid-to-late week.
BTC - Bullflag Pattern points to new ATHMarket Context
Bitcoin has been trading within a well-defined descending channel for several weeks now, respecting both upper and lower boundaries with precision (3 touches on the top, 2 on the bottom). This structure suggests an orderly pullback after a strong impulsive leg to the upside in Q2. As price compresses within this flag-like pattern, market participants are watching closely for signs of breakout or breakdown.
Bullish Fair Value Gap Reaction
Recently, price dipped into a Daily Fair Value Gap (FVG) and bounced strongly — a key bullish signal indicating that demand stepped in at the inefficiency. The FVG also aligns with a retest of the channel’s resistance-turned-support, further validating the bounce. This confluence zone acts as a springboard for potential continuation.
Channel Breakout & Liquidity Above ATH
Price has now broken above the channel structure, shifting the market narrative from consolidation to potential expansion. The breakout zone is located just beneath the All-Time High (ATH) — an area that’s likely loaded with stop orders and breakout buys. A sweep or clean break above the ATH would not only invalidate the prior bearish structure but also trigger a fresh wave of bullish momentum.
Bull Flag Continuation Potential
Structurally, this chart presents a classic bull flag breakout. After a strong impulsive leg up and a controlled consolidation phase, we now see bullish continuation potential toward the 112,000–114,000 region. If the ATH gets breached and reclaimed, it could become strong support in the next leg higher.
Final Thoughts
This is the type of setup that blends both technical precision and market psychology — structure, liquidity, and momentum all coming together. Whether you're already long or watching for confirmation, this move could set the tone for Bitcoin’s next major rally.
If you found this analysis helpful or thought-provoking, please give it a like! And let me know in the comments — do you see this as a true breakout or a trap in disguise?

Cup & Handle Formation on Bigger tf.ABT Analysis
CMP 134.44 (06-07-2025)
Cup & Handle Formation on Bigger tf.
Currently Near Resistance Zone.
Crossing & Sustaining 135 - 135.20 may
lead it towards 150 & then around 180.
Should not break 121 now.

July 7 - 11: Buy Stock Indices DIPs! Watch For Gold, Oil FVGs!In this Weekly Market Forecast, we will analyze the S&P 500, NASDAQ, DOW JONES, Gold and Silver futures, for the week of July 7 - 11th.
Stock Indices are strong, so dip opportunities should present themselves next week.
Gold is bullish-neutral. Could see strength enter this market as July 9th approaches.
Silver is bullish. No reason to short it.
Oil is in a Monthly +FVG. If the FVG fails, it will confirm bearishness. Couple that with the fundamentals, I am watching for that confirmations to sell US Oil.
Enjoy!
May profits be upon you.
Leave any questions or comments in the comment section.
I appreciate any feedback from my viewers!
Like and/or subscribe if you want more accurate analysis.
Thank you so much!
Disclaimer:
I do not provide personal investment advice and I am not a qualified licensed investment advisor.
All information found here, including any ideas, opinions, views, predictions, forecasts, commentaries, suggestions, expressed or implied herein, are for informational, entertainment or educational purposes only and should not be construed as personal investment advice. While the information provided is believed to be accurate, it may include errors or inaccuracies.
I will not and cannot be held liable for any actions you take as a result of anything you read here.
Conduct your own due diligence, or consult a licensed financial advisor or broker before making any and all investment decisions. Any investments, trades, speculations, or decisions made on the basis of any information found on this channel, expressed or implied herein, are committed at your own risk, financial or otherwise.

#202527 - priceactiontds - weekly update - nasdaq
Good Day and I hope you are well.
comment: Neutral. Chart is still max bullish but I have no more targets above and I’m fine with this going without me. Below 22600 I will start looking for lower targets. Until then best bears can get is sideways around 23000 but we will get a big move Monday/Tuesday once we have an answer on the US-EU tariff shit show. A good start for the bears is any price below 22584.
current market cycle: resumption of the bull trend but likely the final flag and we most likely will top out here around/under 23000
key levels for next week: 22000 - 23000
bull case: Bulls obviously still in full control. 2 bear bars out of the past 9 is a strong bull trend. Until we see much bigger selling pressure, technically we can only expect higher prices. Bulls broke above the bull channel from 21000 late may and confirmed the breakout now. The issues against the bulls are also the same arguments as for them. It’s overbought, climactic and very very late in the trend. This strong selling this late is something that usually happens before we turn,
Invalidation is below 22600
bear case: Just to make this clear again, bears have nothing right now. This chart is as bullish as it gets, that is why you can not look to short this yet. With that disclaimer, I also think it’s a bad buy. We are beyond overbought on many many economic indicators worsening and this trend is trying to accelerate. This is the time where weak/late bulls come around with the “this time it’s different” and "valuations don’t matter. We will again sell off big time this year but it’s stupid to trying to pick the top here.
Invalidation is above 23200 (any number I write here is stupid because it’s top picking. It could easily go to 23500 given the strength of this move)
short term: Neutral. No interest in buying but too early for shorts. Let’s see what the US-EU trade “talks” bring next week.
medium-long term - Update from 2024-06-29: No change in plans. I expect 20000 to get hit over the next 3 months and maybe 19000 again.
Candlestick Patterns - How to read them like a ProOverview
Candlestick charts serve as a cornerstone in technical analysis, presenting price activity in a visually digestible format. By examining how prices move over a given timeframe, traders gain key insights into potential market direction, sentiment shifts, and trend strength.
Mastering candlestick interpretation is essential for identifying bullish or bearish sentiment, as well as for spotting possible trend reversals or continuations. Still, candlesticks alone don’t paint the full picture—using them without broader context increases the risk of false signals.
---
What You'll Learn
What are candlestick charts?
Common bearish candlestick patterns
Common bullish candlestick patterns
How to apply candlestick analysis in trading
---
What is a Candlestick Chart?
A candlestick provides a snapshot of an asset’s price behavior during a specific time interval, whether it's one minute, one hour, or one day. This format allows traders to quickly assess how the price has moved within that period.
Each candle reveals four price points:
* Open – the price at the beginning of the interval
* Close – the price at the end of the interval
* High – the highest price reached
* Low – the lowest price during that time
Anatomy of a Candlestick:
* Body: The thick section between the open and close. A green (or white) body means the close was higher than the open (bullish), while red (or black) means the opposite (bearish).
* Wicks (or Shadows): Thin lines extending from the body to indicate the high and low.
* Upper wick: Marks the highest traded price
* Lower wick: Marks the lowest traded price
---
Bearish Candlestick Patterns
Understanding bearish candlestick patterns helps traders identify moments when buying momentum might be running out—setting the stage for a potential downward shift.
Evening Star
A three-candle formation that signals a shift from buying pressure to selling dominance. It starts with a strong bullish candle, followed by a small-bodied candle of indecision, and concludes with a large bearish candle that cuts deep into the first. This pattern often appears at the end of an uptrend.
Bearish Engulfing
This setup includes a small bullish candle followed by a large bearish candle that completely swallows the previous one. It indicates that sellers have seized control, potentially marking the beginning of a downward trend.
Shooting Star
With a small real body near the low and a long upper wick, this pattern reflects strong early buying that is ultimately rejected by the close—suggesting fading bullish momentum.
Gravestone Doji
This candle opens, closes, and hits its low all around the same price, leaving a long upper wick. It suggests that bulls pushed higher during the session but were overpowered by bears by the close.
Three Crows
Three consecutive bearish candles, all approximately the same size. These indicate that a sell off is coming soon.
---
Bullish Candlestick Patterns
Bullish patterns can alert traders to possible reversals after a downtrend or strengthen conviction during an uptrend.
Morning Star
This three-candle formation marks a potential turning point from bearish to bullish. It begins with a strong bearish candle, followed by a smaller candle showing indecision, and ends with a large bullish candle breaking upward—signaling buying strength is returning.
Bullish Engulfing
This two-candle pattern begins with a bearish candle, then a larger bullish candle that completely envelops the previous body. It reflects a sharp transition in sentiment, suggesting renewed buying pressure.
Dragonfly Doji
A single candle where the open, close, and high are all very close, with a long lower wick. It shows sellers pushed prices lower but buyers stepped in and brought them back up—an early sign of possible reversal.
Hammer
A classic bullish reversal signal that features a small real body near the top and a long lower shadow. It indicates a battle where sellers initially dominated, but buyers managed to close near the open price.
Three soldiers
Three consecutive bullish candles, all approximately the same size. These indicate that a big buy is coming soon.
---
Trading with Candlestick Patterns
Candlestick patterns become more meaningful when they align with major chart areas—such as previous support or resistance, trendlines, or retracement zones. A bullish signal at a support level can hint that the downward pressure is fading, while a bearish pattern at resistance may warn of an upcoming decline.
To increase the reliability of your trades, combine candlestick patterns with other forms of technical analysis:
* Support & Resistance Zones: These are price levels where the market has historically reacted. Candlestick patterns forming near these zones have stronger potential implications.
* Fibonacci Levels : These help identify likely retracement areas. When a candlestick pattern forms near a key Fibonacci level like 61.8%, it adds strength to a potential reversal setup.
* Liquidity Areas: Clusters of orders (buy or sell) tend to create strong reactions. When patterns appear in these zones, they often precede more decisive moves.
* Technical Indicators : RSI, MACD, Moving Averages, and Stochastic RSI can provide confirmation. For instance, a bullish reversal pattern that appears when RSI is oversold strengthens the signal.
💡 Tip: Don’t rush into trades based on one candlestick alone. Always wait for the next candle or price confirmation (e.g., a break of a previous high/low) to validate your signal.
---
Thanks for Reading!
✨ If you found this helpful, show some love by liking or commenting!
🔔 Don’t forget to follow for more technical breakdowns and trading insights coming soon!

Nasdaq Approaches 23,000 Mark for the First TimeOver the past five trading sessions, the U.S. Nasdaq index has posted a gain of more than 1.5%, supported by a recent rise in market confidence that has pushed the equity index to new all-time highs. The NFP employment data released yesterday surprised markets with 147,000 new jobs, compared to the 111,000 expected, reflecting a recovery in the labor market that could ultimately support domestic consumption in the U.S.. This has helped maintain investor confidence in equities, supporting a bullish bias in the Nasdaq in recent sessions.
Sustained Uptrend
Since the early days of April, the Nasdaq has maintained a solid upward trend, with no relevant signs of selling pressure that would threaten the current bullish structure. As a result, the long-term bias remains clearly bullish within the broader market outlook. However, it's worth noting that a growing sense of indecision has emerged in recent sessions, reflected in the candlestick patterns, which could open the door to short-term bearish corrections.
Technical Indicators
MACD: The MACD histogram continues to hover around the neutral zero line, indicating a balance in moving average strength during recent sessions. If this pattern continues, it may result in a more defined period of price neutrality in the short term.
RSI: The presence of consistent RSI highs, alongside higher price highs in the Nasdaq, has led to the formation of a bearish divergence. This suggests that market equilibrium has been affected by recent bullish momentum, and could lead to price pullbacks in the upcoming sessions.
Key Levels to Watch:
23,000 – Psychological barrier: A tentative resistance level in the short term due to the lack of clear technical references. A breakout above this level could reinforce the current bullish bias and signal a more sustained upward trend.
21,800 – Nearby support: An area aligned with a recent neutral technical zone, which may act as relevant support in the event of a short-term pullback.
21,000 – Key support: A level that coincides with the 50-period simple moving average. A break below this level could put the current bullish structure at risk and pave the way for a more significant downward move.
Written by Julian Pineda, CFA – Market Analyst

US100 — New ATH Trading SetupThe price recently previous ATH at the 22730 level. Current ATH is marked near 22,800, with a POC at 22,640.
Potential support around 22,500, below POC.
Watch for a bounce or further rise beyond 22,920.
Buyers probably will push right through 23,000 level today on Micros and Minis.

USNAS100 Key Level: 22,740 – Will the Trend Continue or Reverse?USNAS100 Update – Bullish Momentum Holds Above 22,740
USNAS100 has continued to push higher, following through as expected from yesterday’s analysis.
The index maintains bullish momentum as long as it trades above the key pivot at 22,740.
However, a 1H close below 22,730 could trigger a bearish correction toward 22,615.
A sustained break below that level may shift the trend to bearish.
Key Levels:
• Resistance: 22,870 / 23,000
• Support: 22,615 / 22,410

BTC - Will the Bearish Channel continue?Market Context
After a strong impulsive rally earlier in the year, BTC has been trading within a descending channel on the daily timeframe. This corrective structure suggests a period of consolidation and redistribution, as price oscillates between the channel's boundaries. The repeated rejection from the upper trendline and the inability to break through key highs reinforce the bearish bias in this structure.
Buy Side Liquidity Sweep Potential
Price is currently positioned just beneath a relatively clean swing high, sitting above the mid-range of the channel. This high represents a clear area of Buy Side Liquidity—stop losses from short positions and pending breakout orders from longs are likely clustered there. An engineered sweep of this high would serve as a strategic move for larger participants to collect liquidity before driving price lower.
Fair Value Gap as a Pivot Point
Beneath current price lies a Fair Value Gap—a visible inefficiency formed during a fast upward move earlier in the structure. This Gap remains unfilled and offers a compelling target for price once the Buy Side Liquidity Sweep occurs. It represents a logical zone for price to rebalance before deciding on continuation or reversal. Should price break below the Gap cleanly, it would confirm the bearish intent and potentially accelerate toward the lower bounds of the channel.
Channel Continuation Structure
The overall geometry of the channel remains intact, and the price respecting both upper and lower boundaries strengthens the likelihood of a continuation toward the downside. If the Buy Side Liquidity Sweep and subsequent rejection occur, the market could be poised for another leg lower—possibly seeking the next structural support closer to 90,000 or even toward the lower extremities of the channel around 80,000–82,000.
Final Thoughts
This chart reflects classic price delivery behavior: corrective structure, engineered liquidity sweeps, and the magnetic pull of inefficiencies like Fair Value Gaps. Whether you’re actively trading or simply observing, this is a clean, educational setup to learn from.
If this breakdown helped you see the market a bit clearer, I’d really appreciate a like. And feel free to share your thoughts or counterviews in the comments—your insights make the analysis even more valuable.

ABCL — Bullish Breakout with Upside PotentialAbCellera Biologics Inc. (ABCL) has recently confirmed a breakout above a long-term descending trendline, followed by a successful retest of both the trendline and previous local highs. This technical development increases the probability of a sustained upward move.
The first target stands around $5.70, with a potential medium-term extension toward $13.20, offering attractive risk-to-reward parameters.
The company operates in the biotechnology and healthcare innovation sector — one of the most promising and rapidly advancing industries. While such stocks often face increased volatility due to news-driven events, the potential for high returns makes them compelling for both swing traders and long-term investors.

US100 Very Strong Uptrend!
HI,Traders !
#US100 is trading in a
Very strong uptrend and
broke a key horizontal
Level around 22688.6 which
Is now a support and we
Are already seeing a rebound
So we are bullish biased
And we will be expecting
A further move up !
Comment and subscribe to help us grow !

USNAS10 Faces Key Test at 22,615 Ahead of NFP VolatilityUSNAS100 – Key Levels Ahead of Major News
Today’s economic data releases (NFP, Unemployment Rate, etc.) are expected to drive volatility in the market. Traders should watch key levels closely.
Technical Outlook (USNAS10):
• Price is attempting to test 22,615.
• If it holds above 22,615, the bullish momentum is likely to continue.
• However, if price stabilizes below 22,615 on the 1H chart, further downside toward 22,420 is expected before a potential bullish reversal begins.
A breakout above 22,740 could trigger further upside toward 23,000
Key Levels:
• Resistance: 23,000 / 23,100
• Support: 22,420 / 22,280

XAUUSD : Bull or Bear ? (READ THE CAPTION)By analyzing the gold chart on the 4-hour timeframe, we can see that the price continued its correction yesterday, dropping to as low as $3327. However, gold rebounded and is currently trading around the $3344 level.
The key condition for further bullish movement is a stable hold above $3338. If this level holds, the next potential upside targets are $3366 and $3399 respectively.
Please support me with your likes and comments to motivate me to share more analysis with you and share your opinion about the possible trend of this chart with me !
Best Regards , Arman Shaban

US100 - Reversal after liquidity sweep to target new highs?The chart presented shows a 1-hour analysis of the US100 (Nasdaq 100), illustrating a clean and structured price action narrative. Initially, we observe that the market swept liquidity at the lows, indicated by a sharp wick that pierced beneath the previous support levels. This type of liquidity sweep is common when smart money looks to grab stop-loss orders before reversing the trend.
Liquidity sweep to the downside
Following this liquidity sweep, price action aggressively moved upwards, breaking a lower high structure that had previously marked the bearish control of the market. This break of structure is a key bullish signal, suggesting a shift in momentum from bearish to bullish, and often signifies the beginning of a new upward leg.
1H FVG
An important element on this chart is the 1-hour Fair Value Gap (FVG), initially acting as a bearish imbalance. However, due to the strong bullish momentum, price not only reclaimed this level but did so decisively. As a result, this bearish FVG is now considered a bullish FVG, indicating that it may serve as a support zone on any short-term pullback.
Liquidity taken from the upside
After reclaiming the FVG and breaking structure, price surged further, taking out upside liquidity just above recent highs. This action typically leads to a short-term pullback, as profit-taking and new supply enter the market. The chart suggests that any retracement may find support at the 1H FVG, providing a potential entry point for bullish continuation.
Conclusion
In conclusion, the US100 demonstrated a textbook liquidity grab at the lows, followed by a break in bearish structure, a shift in momentum, and an inversion of a key FVG zone from bearish to bullish. The short-term upside liquidity has been cleared, and the next logical target is the high marked on the chart. Should the price respect the newly formed bullish FVG on any pullback, we can expect continuation toward that upper high, completing the bullish run.
Disclosure: I am part of Trade Nation's Influencer program and receive a monthly fee for using their TradingView charts in my analysis.
Thanks for your support.
- Make sure to follow me so you don't miss out on the next analysis!
- Drop a like and leave a comment!

US100 Will Go Down!
HI,Traders !
#US100 made a retest
Of the wide horizontal
Resistance around 22688.6
And we are already seeing a
Local bearish reaction so
We will be expecting a
Further bearish move down !
Comment and subscribe to help us grow !

2025-07-02 - priceactiontds - daily update - nasdaqGood Evening and I hope you are well.
comment: Big down, big up. Clear trading range. Play it until broken.
current market cycle: bull trend on higher tf but trading range on the 1h tf
key levels: 22500 - 23000
bull case: Bulls want 23000. Nothing changed. Bulls buy every dip below 22670 and until that stops, we stay at the highs and chances of higher prices are greater than a deeper pullback. I have no targets above 23000 though.
Invalidation is below 22500.
bear case: Bears not doing enough and have to scalp out or their profits disappear. They need a strong 1h close below 22500 for more downside but for now markets are continuing to ignore every bad news and the structure is as bullish as it gets on the daily tf. Bears are barely making money, so try to look for easy longs.
Invalidation is above 23200.
short term: Neutral but I still expect 23000 to get hit and maybe some more squeeze above. Zero interest in shorts and longs only for scalps and small. It’s still overbought and a deeper pullback is expected over the next days.
medium-long term - Update from 2024-06-29: No change in plans. I expect 20000 to get hit over the next 3 months and maybe 19000 again.
trade of the day: Longs below 22670 have been amazing since Friday.