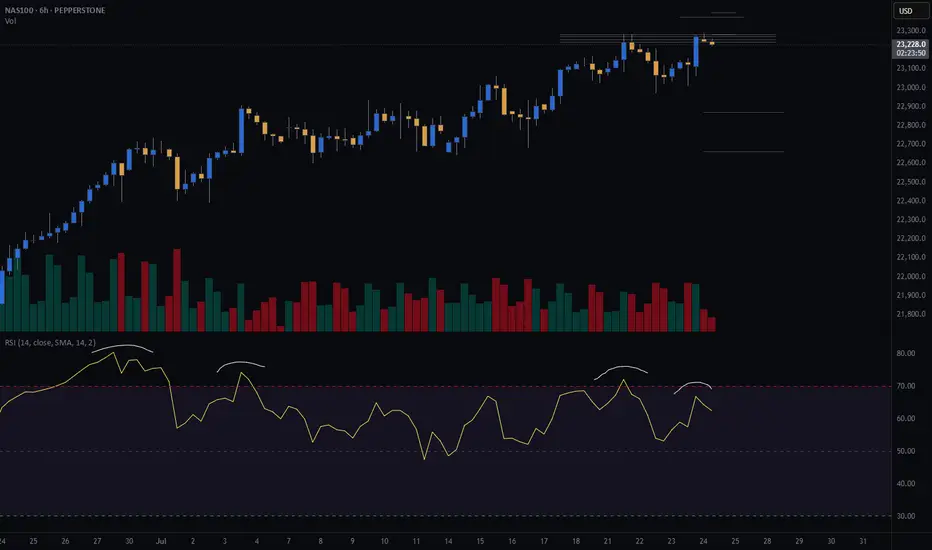
NASDAQ (NQ1!): Bullish! Buy The Pullbacks!Welcome back to the Weekly Forex Forecast for the week of Aug 11 - 15th.
In this video, we will analyze the following FX market:
NASDAQ (NQ1!) NAS100
The NASDAQ is strong and moving higher. No reason to look for sells.
Wall Street advanced on Friday, taking indexes closer to a strong weekly finish, after President Donald Trump's interim pick for a Federal Reserve governor post kept expectations alive for a dovish policy.
The structure is bullish, with supports for higher prices. Wait for a pullback to discount arrays and buy it!
Enjoy!
May profits be upon you.
Leave any questions or comments in the comment section.
I appreciate any feedback from my viewers!
Like and/or subscribe if you want more accurate analysis.
Thank you so much!
Disclaimer:
I do not provide personal investment advice and I am not a qualified licensed investment advisor.
All information found here, including any ideas, opinions, views, predictions, forecasts, commentaries, suggestions, expressed or implied herein, are for informational, entertainment or educational purposes only and should not be construed as personal investment advice. While the information provided is believed to be accurate, it may include errors or inaccuracies.
I will not and cannot be held liable for any actions you take as a result of anything you read here.
Conduct your own due diligence, or consult a licensed financial advisor or broker before making any and all investment decisions. Any investments, trades, speculations, or decisions made on the basis of any information found on this channel, expressed or implied herein, are committed at your own risk, financial or otherwise.
Nasdaq100

NAS100 - Stock market awaits an important week!The index is above the EMA200 and EMA50 on the four-hour timeframe and is trading in its ascending channel. If the index corrects downwards towards the drawn trend line or the specified demand zone, you can buy Nasdaq with better reward for risk.
Many Federal Reserve officials believe that tariffs could weaken the U.S. economy and push inflation higher—a dilemma that forces policymakers to choose between cutting interest rates to support growth or keeping them unchanged to control prices.
However, Miran—the economic adviser President Donald Trump intends to nominate to the Fed’s Board of Governors—rejects this view. He argues that tariffs will ultimately benefit the economy and will not significantly impact prices, allowing the Fed to resume the rate-cutting cycle it halted earlier this year.
The key question now is whether Miran’s arguments will be persuasive enough to sway the broader thinking of the central bank’s policy committee, or whether concerns over labor market weakness might prompt rate cuts regardless, rendering his arguments unnecessary.
According to analysis from The Wall Street Journal, beyond the policy disagreements, Miran has also challenged the institutional legitimacy of the Federal Reserve. He has accused Fed officials of having political motivations and criticized them for what he calls the “tariff disruption syndrome.” In a paper published last year, he argued that all senior Fed officials should be subject to dismissal at the White House’s discretion. If appointed, he would give Trump a loyal ally inside the Fed’s boardroom—someone capable of promoting the president’s views and challenging the institution’s consensus-driven culture and influential research staff.
Meanwhile, JPMorgan has revised its monetary policy forecast for 2025, now expecting the Fed to deliver three 25-basis-point rate cuts starting in September 2025, compared to its earlier projection of just one cut in December.
Miran, who holds a Ph.D. in economics from Harvard University, currently serves as Chairman of the White House Council of Economic Advisers. On Thursday, Trump announced his intention to nominate him for a newly vacant Fed board seat. This position became available unexpectedly after Adriana Kugler’s resignation last week and will expire in January. Trump also revealed plans to nominate another individual to fill this seat, who could potentially replace Jerome Powell as Fed Chair in the spring. Miran’s appointment would give Trump additional time to evaluate how candidates—whether Miran himself or Christopher Waller, whom he appointed during his first term—align with his policy views and vote on interest rates.
This week’s economic calendar is once again crowded, with a series of key inflation reports and consumer-related indicators in the spotlight.
Early Tuesday, the Reserve Bank of Australia will announce its interest rate decision, with markets expecting a 25-basis-point cut from 3.85% to 3.60%. Shortly after, traders’ attention will shift to the U.S. Consumer Price Index (CPI) for July, where core inflation is expected to rise from 0.2% in June to 0.3%.
Wednesday will be relatively quiet, with the main highlight being speeches from Fed officials Austan Goolsbee and Raphael Bostic. On Thursday, focus will return to major data releases, including the U.S. Producer Price Index (PPI), which is projected to see its core measure increase by 0.2% after holding steady in June. Weekly jobless claims figures will also be released that day.
The week will conclude with a broader look at U.S. consumer activity. July retail sales are forecast to slow from 0.6% to 0.5%, while core retail sales are expected to drop from 0.6% to 0.3%. Hours later, the preliminary August reading of the University of Michigan Consumer Sentiment Index will be released, providing insights into consumer expectations and confidence.
According to ISM data, pricing pressures have eased in the manufacturing sector but have jumped sharply in the services sector, which makes up a much larger share of the U.S. economy. This suggests that upcoming CPI and PPI reports carry an upside risk relative to forecasts. Inflation readings above expectations—even before fully factoring in the impact of retaliatory tariffs—could erase part of the market’s anticipated rate-cut outlook.

US100 Local Long!
HI,Traders !
#US100 made a retest
Of the horizontal support
Level of 23266.0 from where
We are already seeing a
Local bullish rebound so
We will be expecting a
Further bullish move up !
Comment and subscribe to help us grow !

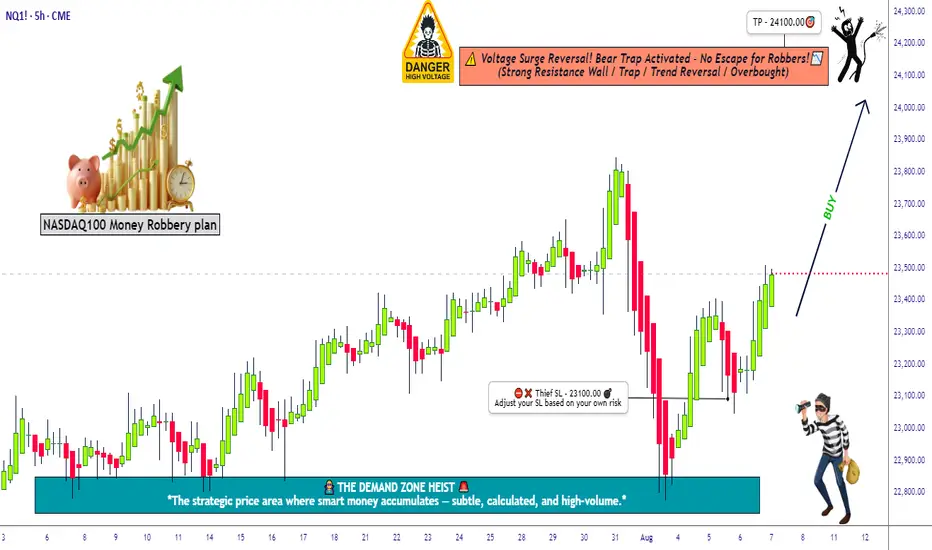
Robbing the Nasdaq Futures | NQ1! Plan with Precise Targets💥🚨NQ1! “E-Mini Nasdaq 100” Heist Alert 🚨💥
🎯Thief Trader Bullish Takeover Plan🕵️♂️📈
🌍 Dear Global Looters & Market Bandits, 💰💸💎
It's time to crack the vaults of the Nasdaq 100 Futures (NQ1!) — Thief-style! No mercy. No fear. Just profits. 🔥
🔓 The digital vault is open — we’re layering multiple limit orders like pros to snatch the tech treasure chest. This isn’t just a trade…
👉 This is an organized robbery of Wall Street’s most elite index. 🏦🕶️
💎 Entry Point = Anywhere on the Grid!
Set your buy limit orders at juicy dips — 15m / 30m / 1H zones, support bounces, or wherever the chart whispers "steal me." 🎧📉
⏰ Stay alert — we don’t chase, we trap. 🐍
🛑 Stop Loss = 23100.00
Set it & forget it below key swing low.
You’re not in this heist to bleed. Risk small. Layer tight. Protect the stash. 🛡️💼
🎯Target = 24100.00
That’s the exit zone before the feds (aka market makers) catch on.
Be smart — take profit early if the heat gets real. 🚓🚨
🧠Strategy Mode: Layering Limit Orders
Thief never enters with one shot. We layer in like ghosts — scaling into value zones, controlling the risk, and building power before liftoff. 🚀📊
This ain’t gambling — it’s structured robbery with exit plans. 🎯💼
🧲 Scalpers & Swingers Welcome!
⚔️ Got big capital? Smash the levels and ride the breakout.
💼 Small cap thief? Ride with the swing crew — safer, smoother, more stealthy.
📍Always use Trailing SL — never let the market take back what you stole. 💰
📰 Market Sentiment: Bullish Bias 😈
AI hype. Earnings season. Rate cuts. You name it — it’s all fueling the Nasdaq rocket.
We’re riding momentum, not hope. This ain’t luck — it’s Thief precision execution.
🔔 Pro Thief Tips:
⚠️ Avoid entries during high-impact news.
🚀 Use alerts. Monitor VIX + QQQ.
💻 Watch for liquidity zones & trap setups.
🚀💣 Smash that 🔥Boost Button🔥 if you love robbing the market like a pro!
Help grow the Thief Trading Crew — one like = one stolen candle from the whales. 💵🦈
We rob institutions, not each other. 💯🤝
Stay locked in — next heist plan coming soon. 📡📈
#NQ1 #Nasdaq100 #EminiFutures #ThiefTrader #RobTheMarket #LayeringStrategy #SmartMoneyMoves #BullishPlan #WallStreetHeist #TradingViewSetup
Double Trap on USTEC: Sell Zones Locked In!Hey Guys,
I’ve prepared a NASDAQ 100 / USTEC 100 analysis for you. I’m planning to open sell positions from two key levels:
🔹 First entry: 23,290 or 23,164
🔹 Second entry: 23,397 – 23,450
🎯 Target levels:
TP1: 22,800
TP2: 22,666
Every single like from you is my biggest source of motivation to keep sharing these analyses. Huge thanks to everyone who supports with a like! 🙏

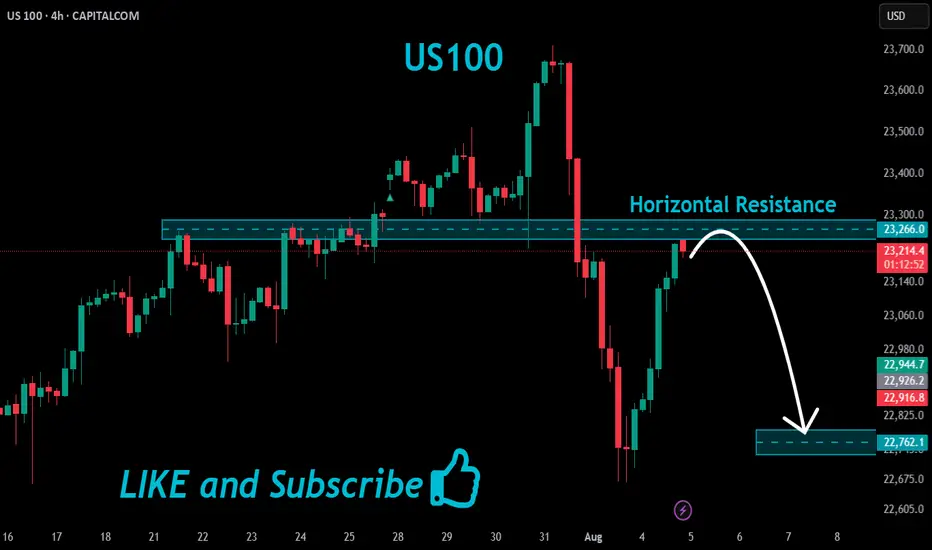
US100 Local Short!
HI,Traders !
#US100 made a retest
Of the horizontal resistance
Of 23266.0 and we are already
Seeing a bearish reaction and
We will be expecting a further
Bearish move down !
Comment and subscribe to help us grow !
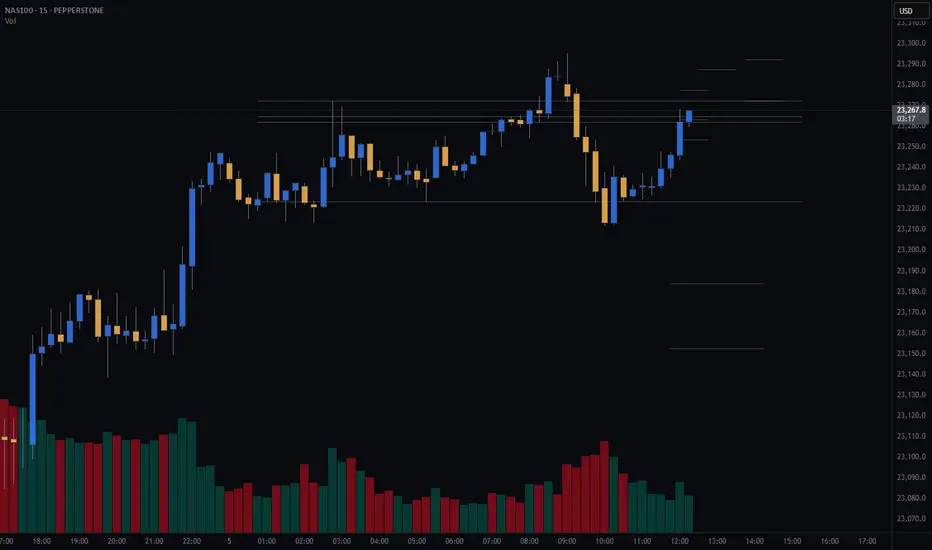
NASDAQ (CASH100) SHORT - head and shoulders 15minPotential short on nas100 (cash100) with head and shoulders on the 15min.
Still waiting for confirmation on some of my variables before I enter.
Risk/reward = 3.3
Entry price = 23 262
Stop loss price = 23 287.3
Take profit level 1 (50%) = 23 184
Take profit level 2 (50%) = 23 153
What do you guys and girls think the nasdaq is going to do?
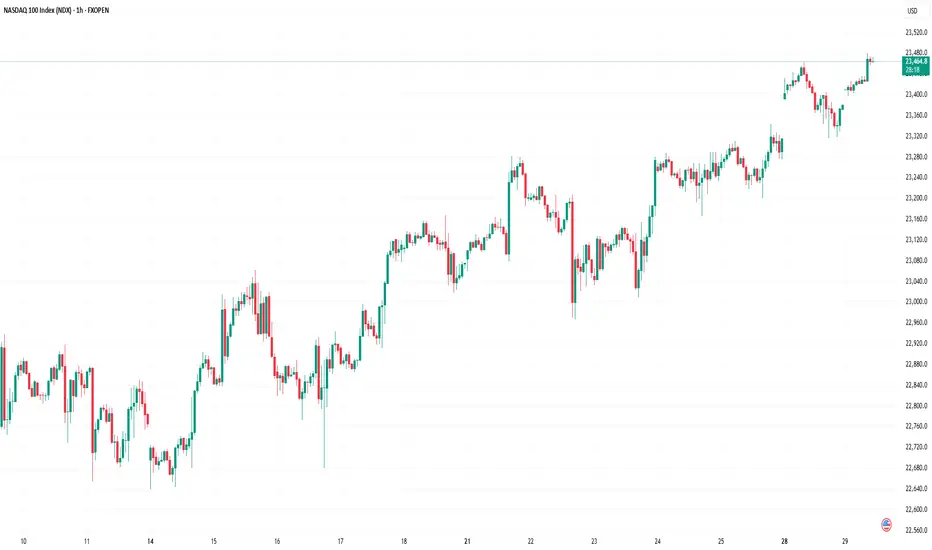
Nasdaq 100 Analysis: Index Rebounds After Friday’s DeclineNasdaq 100 Analysis: Index Rebounds After Friday’s Decline
The release of disappointing US labour market data on Friday unsettled both stock market participants and the President of the United States:
→ Donald Trump promptly dismissed Erica McEntarfer, Commissioner of the Bureau of Labor Statistics, accusing her of falsifying employment data.
→ Stock indices accelerated their decline, with the Nasdaq 100 Index falling below its 16 June low.
However, US stock indices staged a strong recovery on Monday. According to Reuters, yesterday marked the largest daily percentage gain since 27 May.
Why Did Stock Indices Rise?
Possible reasons include:
→ Buyers were attracted by the falling share prices of companies that, for the most part, had delivered strong quarterly earnings;
→ Market participants are betting on a potential rate cut by the Federal Reserve in September (a move strongly advocated by Trump), which could support both the economy and the stock market.
Technical Analysis of the Nasdaq 100 Chart
In our earlier analysis of the Nasdaq 100 Index, we:
→ Identified a primary ascending channel (marked in blue);
→ Highlighted that the price had risen above the upper boundary of the channel (a sign of excessive optimism);
→ Anticipated a potential correction towards the 23,020 level.
However, the correction turned out to be more substantial than initially expected.
As a result of the price movements on Friday and Monday:
→ The blue channel was widened twofold;
→ The price found support at its new lower boundary and reversed upwards;
→ As of today, the Nasdaq 100 index is trading near the median line.
This can be interpreted as the market aggressively digesting recent corporate earnings reports and the prospects of a rate cut in light of a deteriorating labour market. Demand and supply may reach a new equilibrium, potentially leading to a consolidation phase around the median of the widened channel.
It is also possible that the area marked in orange—where the price previously rallied strongly, indicating a buyer-driven imbalance—may now act as support. Resistance levels might include:
→ Former support at 23,320;
→ 23,440 – the level at which bears broke through the purple channel.
This article represents the opinion of the Companies operating under the FXOpen brand only. It is not to be construed as an offer, solicitation, or recommendation with respect to products and services provided by the Companies operating under the FXOpen brand, nor is it to be considered financial advice.

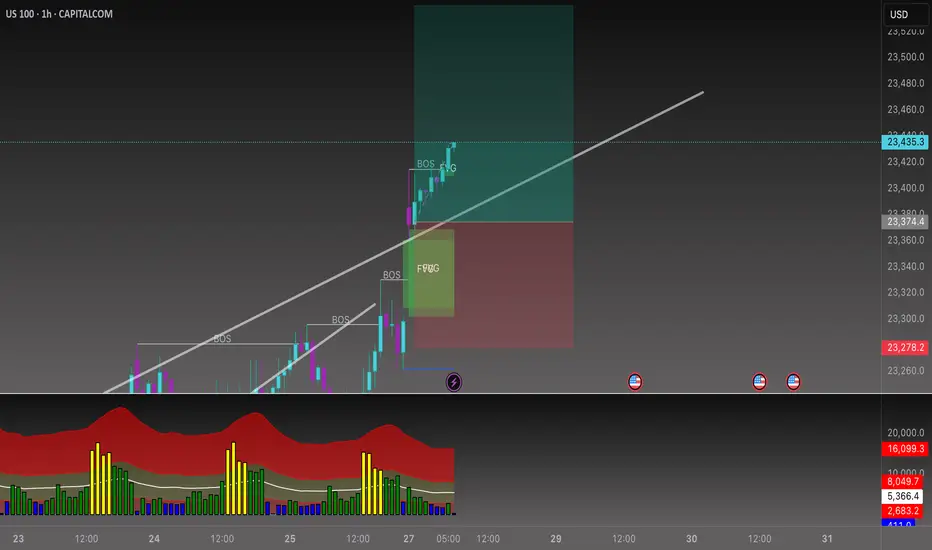
NASDAQ Week 32 OutlookOn the US Nas 100 1-hour chart, a bearish breakout from a symmetrical triangle suggests downward momentum. The Fair Value Gap at 23,500.0 is a pivotal level—watch for a breakout and retest here to confirm sell entries. Aim for the target at 22681.1, with a stop-loss at 23,740.4 to protect against adverse moves.

NAS100 Trade Idea: Liquidity Sweep & Bullish Reversal Potential📊 NASDAQ 100 (NAS100) Trade Outlook 📈
The NASDAQ 100 is holding a strong bullish trend on the higher timeframes 🟢. However, we’re currently seeing a notable pullback into a key support zone ⚠️ — price has dipped beneath previous lows, tapping into what appears to be an institutional accumulation range 🏦.
This move is likely targeting the liquidity resting below those lows 💧, where sell stops are positioned. Price is also reacting off a significant bullish order block 🧱 — a confluence area that could produce a strong reversal.
🎯 What to look for next:
Wait for a bullish break in market structure 🔁 to confirm a potential entry. If that occurs, consider a long setup with your stop loss below the swing low 🛑 and a 1:2 risk-to-reward target 🎯.
🚫 This is for educational purposes only and not financial advice.

Nasdaq Bullish Order FlowNQ was pushing Low, having usual context. Also today we were looking price to continue low. But price respected old swing low.
Price reversed with a sharp turn (ST), hence respecting unusual context.
We have Targets outlined, with success rate for price to reach.

Is the NASDAQ Vault Open for a Full Bullish Heist?🧠 NASDAQ Heist Masterplan: Thieves Eye on 24,500 🎯💰
🚨 Asset: NASDAQ100 / US100 / NDX
📊 Plan: Bullish | 🔁 Layering Strategy
🎯 Target: 24,500
🛑 Stop Loss: 22,600
📍 Entry: Any level – the vault’s wide open!
💼 Thief Trader's NASDAQ High-Stakes Robbery Is LIVE! 🤑📈
Welcome, money bandits & market looters! 💼💰
The time has come to launch a full-scale bullish raid on the NASDAQ fortress. We’re not just taking entries — we’re stacking them like a pro with our layered limit order strategy across swing zones. 🔫📉➡️📈
🔓 Entry:
Pick any price! We break in anytime, anywhere.
🔁 Stack your buy limits on 15m–30m swing lows.
🔔 Set your alerts – don’t let the opportunity slip.
🛑 Stop Loss:
Guard your loot at 22,600.
Risk management is the bulletproof vest in this raid. 🎯
Adjust your SL based on lot size and order volume. 📏🔐
🎯 Profit Target:
Thieves retreat at 24,500.
But hey – smart robbers use trailing SL to squeeze every last drop of gold! 🏆💸
💡 Scalpers & Swingers:
Stick to the long side only.
If your pockets are deep – full-send mode ON.
If not, tag along with swing entries. Patience pays big! 💎⏳
📢 Heads Up, Heist Crew:
News drops = landmines. Step carefully.
🚷 No new entries during major announcements.
🛡️ Use trailing SL to defend your profit bags.
🚨 Daily Reminder:
This market isn’t a playground. It’s a battlefield.
Use COT data, macro reports, sentiment scans, and index-specific triggers to fortify your robbery blueprint. Stay smart, stay updated! 📊🧠
💥 Boost Our Loot Crew 💥
Hit that LIKE ❤️ to support the Thief Army!
Stronger visibility = Bigger Loots = More Victory Runs.
See you at the next robbery – we move in silence, but the market hears us loud! 🐱👤💸🔥🚀

UPDATEFriday we closed on the breakeven after that the price reached our 50% level of the trade, so our TP was raised to the breakeven.
Follow for more trades to catch up the next week!

OUR TRADE TODAY ON NASDAQBeen a while since I last posted here, today I’m sharing with you our trade we took 15min ago with an RR of 3
Follow for more

Fibonacci Retrace Strategy NAS100 Trade Idea📈 NASDAQ 100 (NAS100) is holding a strong bullish trend 🚀. After a weekend gap-up 🕳️➡️📈, price retraced back into the gap zone—exactly what you'd expect in a healthy trending market.
🔍 I'm applying my Fibonacci Expansion + Retrace Strategy 🔢, watching closely for a pullback into equilibrium ⚖️ within the previous price swing. That’s where I’ll be waiting for a bullish market structure break 🔓📊 to confirm my long bias.
🧠 Patience is key here—let the setup come to you.
📌 As always, this is not financial advice!

$NDX 3rd Bearish EngulfingSlowly but surely we are seeing deteriorating conditions in every major indices.
NASDAQ:NDX closed and formed the 3rd BEARISH engulfing in 2 weeks, RARE!
Light volume so it's not definitive, but alarming.
TVC:DJI keeps weakening.
SP:SPX many RED candles & bearish engulfing as well.
Light volume though.

NASDAQ price dropAfter the Nasdaq price reaches around 23642.2, a historic drop will occur and the target is to drop to 16308.
Whatever happens at the highest price, the final destination is towards 16308.
I have identified the price levels in the middle of this expected drop that can cause the price to correct.
IG:NASDAQ

Nasdaq 100 Index Hits New Highs Ahead of Big Tech EarningsNasdaq 100 Index Hits New Highs Ahead of Big Tech Earnings
Earlier, we noted signs of optimism in the Nasdaq 100 index as the market anticipated earnings reports from major tech firms.
Now, companies such as Alphabet (GOOGL) and Tesla (TSLA) have already released their results (we previously covered their charts → here and here). Up next are the most highly anticipated earnings reports: this week, tech giants including Microsoft (MSFT), Amazon (AMZN), Meta Platforms (META), and Apple (AAPL) are set to publish their results. The combined market capitalisation of these four companies exceeds $11 trillion, and their reports could have a significant impact on a stock market that is already showing strong bullish sentiment:
→ The Nasdaq 100 index has climbed to an all-time high, surpassing the 23,400 mark.
→ The signing of trade agreements between the US and Europe (and earlier, Japan) has eased concerns about the negative impact of tariff barriers.
Technical Analysis of Nasdaq 100
The chart supports growing signs of optimism: earlier in July, the price remained within a rising channel (marked in blue). However, towards the end of the month, price action has begun to follow a steeper upward trajectory (marked in purple).
What could happen next? Much will depend on the earnings results and forward guidance from these tech giants.
On the one hand, continued enthusiasm around AI adoption could accelerate further growth. The stronger the optimism, the more fuel it may add to discussions around a potential bubble — with some analysts already drawing parallels to the dot-com era of the early 2000s.
On the other hand, earnings could temper market excitement and prompt a correction. For example, the index may retreat to the support level around 23,020, which is reinforced by the lower boundary of the blue trend channel.
This article represents the opinion of the Companies operating under the FXOpen brand only. It is not to be construed as an offer, solicitation, or recommendation with respect to products and services provided by the Companies operating under the FXOpen brand, nor is it to be considered financial advice.
Beyond the Chart – NAS100 Through Technicals & Fundamentals📊 CAPITALCOM:US100 Analysis
Today, NAS100 opened with a huge gap up following former President Trump’s announcement that the U.S. has officially reached a trade agreement with the European Union.
🕳️ After price rejected the gap zone, and volume gets low low. I’m now looking for a potential test of the 23,540 level.
💼 With Q2 earnings season kicking off, stock-moving news will be hitting fast. While retail traders might scramble to catch up, smart money is already positioning for surprise earnings beats.
Stay sharp, this week could set the tone for the next major move.
US100 Bullish Breakout!
HI,Traders !
#US100 is trading in a strong
Uptrend and the price made a
Bullish breakout of the key
Horizontal level of 23261.4
So we are bullish biased
And we will be expecting a
Further bullish move up !
Comment and subscribe to help us grow !

"NASDAQ 100 Heist – Scalp, Swing, or Hold? (Full Plan)🔥 NASDAQ 100 HEIST PLAN – BULLISH LOOT AWAITS! 🔥
🚨 Attention Market Robbers & Money Makers! 🚨
(Swing/Day Trade Strategy – High-Risk, High-Reward Play)
🎯 Mission Objective: Loot the NDX100/US100 (NASDAQ 100) Like a Pro!
Based on Thief Trading’s ruthless technical & fundamental analysis, we’re executing a bullish heist—targeting the Red Zone (high-risk, high-reward area).
⚠️ WARNING: Overbought market, consolidation zone, potential bear traps—weak bears may get slaughtered! Strong hands only!
🔐 ENTRY: The Vault is OPEN!
"SWIPE THE BULLISH LOOT!" – Any price is a steal, but smart thieves use:
Buy Limit Orders (15m-30m TF) near recent swing lows/highs.
DCA/Layering Strategy – Multiple limit orders for max loot.
Breakout Confirmation – Don’t jump in early; wait for the real move!
🛑 STOP LOSS: Protect Your Stash!
Thief’s SL Rule: Nearest 4H swing low (22,600) – WICK LEVEL ONLY!
DO NOT place SL before breakout! (Patience = Profit.)
Adjust SL based on risk, lot size, and number of orders.
🎯 TARGETS: Escape Before the Cops Arrive!
Main Take-Profit: 24,400 (or exit early if momentum fades).
Scalpers: Longs ONLY! Use trailing SL to lock in profits.
Swing Traders: Ride the wave like a true market pirate!
📰 FUNDAMENTAL BACKUP: Why This Heist Will Work
Bullish momentum in NDX100 driven by:
Macro trends (Fed, inflation, tech earnings).
COT Report & Institutional positioning.
Geopolitical & Sentiment Shifts.
Intermarket correlations (USD, Bonds, Tech Sector).
(Stay updated—markets change FAST!)
⚠️ TRADING ALERT: News = Danger Zone!
Avoid new trades during high-impact news.
Trailing SL = Your best friend.
Lock profits early if volatility spikes!
💥 BOOST THIS HEIST! 💥
👉 Hit LIKE & FOLLOW to strengthen our robbery crew!
🚀 More heists coming soon—stay tuned, thieves! 🚀

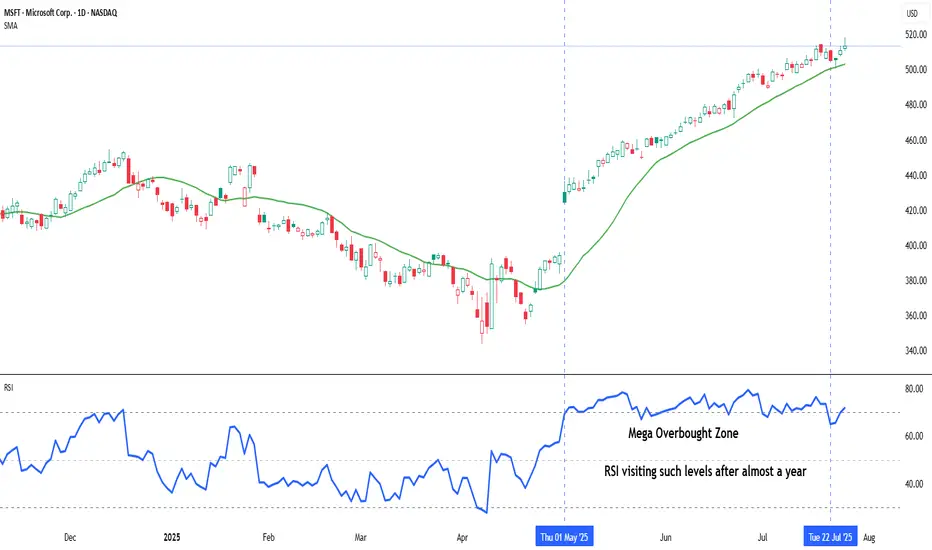
Indicator Decoded: RSI Mega Zones: Signals from the EdgeMost traders are familiar with the textbook RSI levels—70 indicating overbought and 30 indicating oversold. But markets, especially in strong momentum phases, do not always obey these boundaries. That is where the concept of Mega Overbought and Mega Oversold zones becomes vital. These are not fixed thresholds, but adaptive zones often beyond 80 and below 20, where the RSI reflects extreme strength or weakness. Rather than acting as reversal points, these levels often signal trend continuation.
A reading above 80 is typically seen during powerful uptrends or post-breakout rallies. It indicates not just buying, but unhesitating, aggressive demand, especially after key resistance zones have been cleared. Such RSI levels have often not been seen in several months—if not more than a year—making their appearance especially significant. Rather than a signal of exhaustion, this may be the start of a major trend, suggesting that the broader structure of the stock or index has shifted decisively. Traders who misinterpret this as a reversal signal often find themselves fighting momentum. Instead, price tends to grind higher, sometimes pausing briefly before further gains. This is why the chapter suggests using Mega Overbought zones as confirmation of bullish control, not a trigger for counter-trades.
The inverse applies to the Mega Oversold zone—RSI falling below 20. This is usually not a buy-the-dip moment, especially if the broader trend and chart structure are bearish. Such readings typically accompany panic-driven breakdowns, where sellers dominate without any counterforce. These extreme values are often rare and may not have appeared for months or even over a year, marking a moment where the market’s character may be undergoing a structural change. As with Mega Overbought, context is critical. If RSI hits such depths after prolonged distribution or a topping pattern, it does not indicate value—it confirms that the tide has turned, and a strong downtrend may be setting in.
Both Mega zones are best used in conjunction with structure—trendlines, volume shifts, anchored VWAP zones, or price patterns. The RSI alone is not enough. But when it aligns with other technical signals, a Mega Overbought or Oversold status becomes a momentum amplifier, not a contrarian prompt. In fact, your RSI chapter rightly warns that entering against such zones can be fatal unless clear divergences, climax patterns, or volume exhaustion are also present. Think of these extremes not as ceilings or floors, but as accelerators when backed by structure.
A word of caution: These signals are rare and often widely spaced. The real challenge lies in managing risk–reward, as strong momentum and shallow pullbacks can make it difficult to find entries with favourable R:R ratios.
Chart: Microsoft Corp. (MSFT) – Daily Chart with 20-DMA and RSI (as on July 25, 2025)
Microsoft continues its strong upward trajectory, with price action staying well above the rising 20-day simple moving average. The recent surge in RSI into the mega overbought zone marks a significant shift in momentum, as the indicator revisits such elevated levels after nearly a year—an occurrence that often coincides with extended bullish phases.
NASDAQ (CASH100) SHORT - double top H6Risk/reward = 4.3
Entry price = 23 282
Stop loss price = 23 398
Take profit level 1 (50%) = 22 871
Take profit level 2 (50%) = 22 663
If current H6 goes back into range, I will open short position.
All variables on checklist have been met.
I was out last night so I missed my initial entry. Hoping for a second chance.
Hopefully this short works because the last few higher time frame short setups have failed, although because of exit plan I have made very little losses.