Nasdaq: At the Upper EdgeYesterday, the Nasdaq climbed above resistance at 22,475 points. Currently, the index is positioned outside our turquoise Target Zone (coordinates: 21,751 – 22,425 points), which remains active. Stops for short positions 1% above the zone have not yet been triggered. Our primary scenario remains intact for now: technically, there is room for wave B to reach the next resistance at 23,229 points. Following the B-wave peak, a downtrend is expected with the corrective wave C. With a 42% probability, we anticipate that wave alt.(4) is already complete, and the index may break directly higher within the magenta-colored wave alt.(5), surpassing the 23,229-point mark.
📈 Over 190 precise analyses, clear entry points, and defined Target Zones - that's what we do.
Nasdaq100

Nasdaq 100: A New All-Time HighNasdaq 100: A New All-Time High
As shown on the Nasdaq 100 chart (US Tech 100 mini on FXOpen), the value of the technology stock index has risen above its February peak, setting a new historical high.
Bullish sentiment may be supported by:
→ Easing concerns over potential US involvement in a Middle East war, as the ceasefire between Israel and Iran remains in effect.
→ Media reports suggesting that Donald Trump is considering replacing Federal Reserve Chair Jerome Powell by September or October, in an effort to influence a rate cut that could accelerate economic growth (though this also raises the risk of a new inflationary wave).
Technical Analysis of the Nasdaq 100 Chart
Price fluctuations in May and June have formed an ascending channel (highlighted in blue), with the following observations:
→ The decline (marked by red lines) appears to be an interim correction forming a bullish flag pattern;
→ The 22K level, which acted as resistance mid-month, was breached by a strong bullish impulse (indicated by the arrow) from the week's low.
This leaves the market vulnerable to a potential correction, which seems possible given:
→ Proximity to the upper boundary of the ascending channel;
→ Overbought conditions indicated by the RSI.
If the market corrects, a retest of the 22K level may happen.
This article represents the opinion of the Companies operating under the FXOpen brand only. It is not to be construed as an offer, solicitation, or recommendation with respect to products and services provided by the Companies operating under the FXOpen brand, nor is it to be considered financial advice.

In the 2030's The Nasdaq 100 to 2X the Dow Jones.#CupandHandle don't fight the trend.
Technology vs Industrials.
AI
Robotics
Space Economy
Biotech
Artificial Super Intelligence to power GDP to insane levels.

Nasdaq: Bull flag breakout on daily chart, testing ATHsBeen a while since I last posted. So figured I'd share this quick chart. Market undoubtedly have been incredibly volatile this month. However luckily, the Nasdaq has been forming bull flag on the daily chart. This follows a strong prior uptrend. The breakout took place today, sending the index to test ATHs.
Notable stocks making a move are names like NASDAQ:AMZN and NASDAQ:NVDA , mainly due to the broader market strength. Other indices, such as the S&P 500 ( SP:SPX ) also are breaking out as they form a similar bull flag pattern.
At ATHs, this is a deciding factor of where the market goes next. Either it bounces off to near-term support, or the market rallies to a new all-time high until next cooldown.
Note: not financial advice

Can Geopolitics Power Tech's Ascent?The Nasdaq index recently experienced a significant surge, driven largely by an unexpected de-escalation of tensions between Israel and Iran. Following a weekend where U.S. forces reportedly attacked Iranian nuclear sites, investors braced for a volatile Monday. However, Iran's measured response - a missile strike on a U.S. base in Qatar, notably without casualties or significant damage - signaled a clear intent to avoid wider conflict. This pivotal moment culminated in President Trump's announcement of a "Complete and Total CEASEFIRE" on Truth Social, which immediately sent U.S. stock futures, including the Nasdaq, soaring. This rapid shift from geopolitical brinkmanship to a declared truce fundamentally altered risk perceptions, alleviating immediate concerns that had weighed on global markets.
This geopolitical calm proved particularly beneficial for the Nasdaq, an index heavily weighted towards technology and growth stocks. These companies, often characterized by global supply chains and reliance on stable international markets, thrive in environments of reduced uncertainty. Unlike sectors tied to commodity prices, tech firms derive their value from innovation, data, and software assets, which are less susceptible to direct geopolitical disruptions when tensions ease. The perceived de-escalation of conflict not only boosted investor confidence in these growth-oriented companies but also potentially reduced pressure on the Federal Reserve regarding future monetary policy, a factor that profoundly impacts the borrowing costs and valuations of high-growth technology firms.
Beyond the immediate geopolitical relief, other crucial factors are shaping the market's trajectory. Federal Reserve Chair Jerome Powell's upcoming testimony before the House Financial Services Committee, where he will discuss monetary policy, remains a key focus. Investors are closely scrutinizing his remarks for any indications regarding future interest rate adjustments, particularly given current expectations for potential rate cuts in 2025. Additionally, significant corporate earnings reports from major companies like Carnival Corporation (CCL), FedEx (FDX), and BlackBerry (BB) are due. These reports will offer vital insights into various sectors' health, providing a more granular understanding of consumer spending, global logistics, and software security, thereby influencing overall market sentiment and the Nasdaq's continued performance.

Market Structure Breakdown on NASDAQ: What Traders Should Watch📉 NASDAQ (NAS100, US100) Analysis 🧠💼
I’m currently keeping a close eye on the NASDAQ (NAS100) — price action is telling a story worth watching.
📆 Last week, the index came under clear pressure, and now on the 4H timeframe, we’re seeing a defined bearish structure with consistent lower highs and lower lows 📉🔻. This recent expansion to the downside has led to a break in market structure (BOS), and price is now pulling back into equilibrium 🔄.
⏳ For now, it’s a waiting game. I’m watching to see if this pullback finds resistance at a premium level and rotates back to the downside, which would present a potential short setup 🎯📊.
🕒 On the 30-minute chart, I’m monitoring for a clear structural shift — a change in momentum that confirms bearish intent. Should the NASDAQ resume its downward move, it could trigger risk-off sentiment, bringing strength into the JPY pairs 💴🚨 as capital flows out of risk assets.
⚠️ Disclaimer:
This analysis is for educational purposes only and should not be considered financial advice. Always conduct your own research and consult with a licensed financial advisor before making any trading decisions. 📚💼

NASDAQ Bullish Play into Liquidity Before Potential ReversalForecast:
NOTE: At this moment, this is a forecast and trades will be taken dependent on live PA.
Price has reacted strongly off the 21,410–21,430 Daily Order Block, suggesting bullish intent. If bullish structure holds, I expect a move into the 22,060–22,130 liquidity zone, where sell-side setups could form.
This is a classic Buy to Sell model:
Buy from OB at ~21,420
Target liquidity above recent highs (~22,100+)
Look for shorts after sweep into 22,130–22,220 range
Invalidation: Break and close below 21,410 suggests the OB failed — potential deeper drop toward 20,700.

MicroStrategy another pull back before all time high?NASDAQ:MSTR analysis update..
📉 𝙇𝙤𝙣𝙜 𝙩𝙚𝙧𝙢 The weekly R5 pivot target is bold at $1500 but definitely possible as a max greed scenario when the triple tailwind of Bitcoin, SPY and Bitcoin treasury companies trends return.
📉 𝙎𝙝𝙤𝙧𝙩 𝙩𝙚𝙧𝙢 retracement is expected to end around the S1 pivot at $341 and a secondary target of $321.
Irans conflict has investors shaken and not willing to hold assets over the weekend on the fear of worse. However, if the conflict is resolved soon investors could have a great buying opportunity.
𝙏𝙚𝙘𝙝𝙣𝙞𝙘𝙖𝙡 𝘼𝙣𝙖𝙡𝙮𝙨𝙞𝙨
Price appears to have completed wave (B) of an ABC correction in wave 4. Wave C is underway with an expected thrust down (such is the nature of wave C) towards the daily S1 pivot $341. This is also the 0.382 Fibonacci retracement, a high probability area for wave 4 to end. A deeper correction will bring up a triple shield of the High Volume Node, ascending daily 200EMA and 0.5 fibonacci retracement at £321.
Daily DEMA has death crossed.
Safe trading

NASDAQ - UniverseMetta - Signal#NASDAQ - UniverseMetta - Signal
D1 - Formation of a narrowing diagonal + price broke through the lower trend line through a 3-wave structure. It is better not to increase risks. Stop behind the maximum of the 1st wave.
Entry: 21509.0
TP: 20986.3 - 20372.2 - 19784.5 - 18396.7
Stop: 22160.6


NASDAQ Consolidation: Why Sitting Out Is Sometimes the Best PlayI'm currently monitoring the NASDAQ (US100) closely, and on the 4-hour chart, we can clearly see that the market is in a phase of consolidation 🔍
Yesterday, I was anticipating a bullish breakout, which could have signaled the start of a structure with higher highs and higher lows — something that would have presented a clean long opportunity 📈. However, during the U.S. session, the NAS100 momentum shifted and we instead saw a bearish breakdown, invalidating the previous setup 🚫
As things stand now, there's no clear directional bias on the 4H — just a sideways range with neither bulls nor bears in full control 🤝. This type of environment calls for patience and discipline.
It's worth noting that knowing when not to trade is just as important as knowing when to pull the trigger. Sitting on the sidelines and allowing the market to make the next move — whether that’s a break above or below this consolidation range — is a valid and often wise decision 🧘♂️📊
At the moment, my preference is to remain neutral and let price show its hand before committing to a position.
⚠️ Disclaimer:
This analysis is for educational purposes only and does not constitute financial advice. Always do your own research and apply proper risk management when trading.

Missiles in the Middle East, Headwinds on Nasdaq: NAS100 onHey There;
The trend line on the NAS100 has been broken to the downside. My target level after this breakout is 21,299.47. If the price moves towards this level, I think it will reach my target in line with fundamental analysis due to the broken trend line and Iran-Israel war tensions.
I meticulously prepare these analyses for you, and I sincerely appreciate your support through likes. Every like from you is my biggest motivation to continue sharing my analyses.
I’m truly grateful for each of you—love to all my followers💙💙💙

NASDAQ 100 Bullish Breakout Potential: What to Watch NextI'm currently monitoring the NASDAQ 100 (NAS100) very closely. Building on yesterday’s outlook, we've now seen a clear bullish structural shift — price is holding firm above a recent higher high and higher low, suggesting the early stages of a potential trend continuation 📈
Zooming into the 30-minute chart, we can track price action more precisely. I’m watching for a decisive break above the current range high on this timeframe. If we get the break → retest → rejection pattern, this would confirm bullish momentum and provide a long opportunity 🚀
Should this scenario play out, we could also see JPY pairs strengthen to the upside, as a risk-on sentiment flows through the markets 🧭
🔍 This setup is developing — as always, patience and precision are key.

Nasdaq Challenges Record HighsNasdaq continues to trade just below a one-month resistance line, which connects consecutive higher highs formed between May and June 2025. This line has capped the index just shy of the 22,000 mark, as price action navigates the push and pull between summer momentum, geopolitical tensions, and economic uncertainty.
To the upside, a decisive break and hold above 22,200 would be a bullish trigger, potentially opening the path toward the 23,700 resistance zone. This level notably aligns with the 0.618 Fibonacci extension, projected from the 2023 low, 2025 high, and 2025 retracement low.
On the downside, risks remain for a deeper correction if the index retraces toward the 21,000–20,600 region. This zone represents the neckline of the December–January double top, and stands as a critical threshold separating a bullish continuation scenario from the possibility of a deeper bearish pullback.
- Razan Hilal, CMT

E-mini Nasdaq-100 Trading Setup for sellers ^)We have completed cup and handle pattern here...
So after the price is still high!
We may see some price gain additional, something like 13-18% .
So we have two option here for the sellers, wait and sell from marked point 1 or 2 .
P.S. This is very long time range position. ( Something like 200-800 day ).
Have a profit in your day!
Thanks.

NASDAQ Analysis: Navigating Uncertainty in a Shifting LandscapeThe NASDAQ has been on a rollercoaster ride lately 🎢, reflecting both global macro shifts and sector-specific dynamics. After dipping into bear market territory earlier in the year, the index has rebounded strongly, powered by mega-cap tech and the ongoing AI boom 🤖. However, the mood remains cautious as investors weigh political and economic cross-currents. Note how price action is stalling at the current level.
Fundamentals & Earnings 💼
Earnings Resilience: Q1 2025 earnings for NASDAQ heavyweights were robust, with tech giants posting double-digit growth. Yet, forward guidance is more muted, as companies brace for the impact of higher tariffs and global supply chain adjustments.
Valuations: The recent rally has pushed forward P/E ratios well above long-term averages, making the market more sensitive to any negative surprises 📈.
AI & Innovation: Capital expenditure on AI is set to exceed$300 billion this year, keeping the sector in the spotlight and fueling optimism for long-term growth.
Political & Geopolitical Factors 🌍
Trade Policy: The U.S. and China have agreed to a temporary pause on new tariffs, easing some immediate concerns. However, the average effective tariff rate remains much higher than last year, and uncertainty lingers as legal challenges and further negotiations loom.
Fiscal Policy: U.S. deficit worries are back in focus, with new legislation projected to add trillions to the national debt over the next decade. This has contributed to higher Treasury yields and a weaker dollar 💵.
Global Competition: International equities have outperformed U.S. stocks over the past six months, but history suggests this may be stretched, and a reversal could be on the horizon.
Market Sentiment & Technicals 📊
Volatility: While volatility has eased from its spring highs, sentiment remains fragile. Consumer and business confidence indices are at multi-year lows, even as hard economic data (like jobless claims) remains resilient.
Sector Rotation: Growth and cyclical sectors—especially tech, consumer discretionary, and industrials—have led the rebound, but investors are increasingly selective, favoring companies with strong fundamentals and global reach.
Outlook: The NASDAQ is cautiously optimistic for the second half of 2025. The market is pricing in a couple of Fed rate cuts by year-end, but the path forward depends on inflation trends, trade clarity, and corporate earnings.
Key Takeaways 🚦
The NASDAQ is in recovery mode, but faces headwinds from trade policy, fiscal uncertainty, and stretched valuations.
Political developments—especially around tariffs and fiscal policy—will be key drivers of volatility.
Long-term, the AI and tech innovation wave remains a powerful tailwind, but near-term caution is warranted.
Disclaimer:
This analysis is for informational purposes only and does not constitute investment advice. Markets are volatile and subject to rapid change. Always do your own research and consult a financial advisor before making investment decisions.

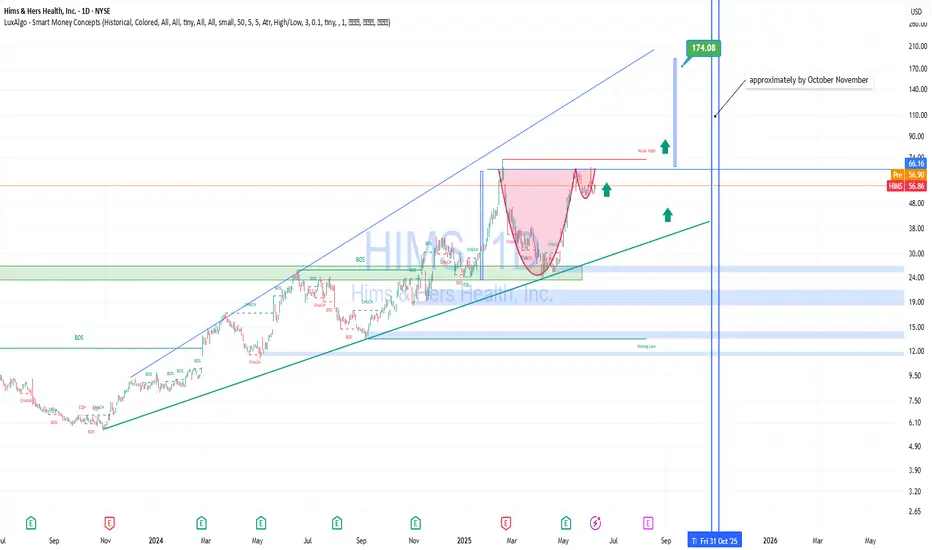
HIMS – Technically and Fundamentally Strong for Mid-to-Long TermTechnical Analysis
HIMS is trading in a clear ascending channel since 2023.
On the daily chart, a “cup and handle” formation has completed, with a confirmed breakout above the neckline ($55–$57 area).
The price is consolidating near the breakout point – classic behavior before a continuation move.
Target projection from the cup pattern is $170+, implying a 200%+ upside potential.
The stock also respects the upper trendline of the long-term channel, reinforcing bullish structure.
Fundamental Strength:
Telemedicine megatrend: Digital health is booming. HIMS is one of the few well-established D2C players in the U.S. market.
Revenue growth: Annual revenue growth exceeds 40% YoY, a sign of operational efficiency and demand.
Sticky subscription model: Over 1.5 million active subscribers — solid base for recurring revenue and LTV.
Valuation upside: Still undervalued relative to sector peers despite recent rally.
Scalable tech stack: Strong backend, customer acquisition systems, and vertically integrated infrastructure support further expansion.
Conclusion: HIMS offers an attractive risk–reward setup for swing traders and long-term investors alike
Nasdaq-100 (NDX) Weekly Chart 2025 Chart Context
This weekly timeframe analysis of the Nasdaq-100 Index (NDX) forms a key pillar in our 2025 macro analysis series. Following the breakout structure seen in TOTAL, TOTAL2, BTC.D, and US10Y, this chart utilizes 2 Fibonacci tools (1 trend-based extensions and 1 retracement) to project potential corrective and expansion scenarios.
Fibonacci Tools Used:
Fibonacci Retracement : Applies to the recent smaller swing to determine micro retracement zones and cluster supports.
0=20674 and 100=10504
Trend-Based Fibonacci Extension: Drawn using a three-leg structure (point A= 3993 to B=16724 to C10504) to forecast upside targets beyond ATH.
All take-profit (TP) levels: TP1 (~23,400), TP2 (~26,700), and TP3 (~30,344.49)—are located at confluence zones where Fibonacci levels from different tools align, reinforcing their validity and strength.
There is a 4TP above all the Visible TPs
Key price references:
0% retracement: ~20,674.71
Next Resistance ~23,400 (confluence of extensions and psychological resistance)
Projected TPs:
1TP=~23,400,
2TP=~26,700,
3TP=~30,344.49,
4TP=44000
Support/Resistance:
Red zone: ~16,700–18,300 (historical S/R and correction target and Fib Confluences)
Resistance zone: ~23,000–23,400 ,
22000(ATH area)
Key Technical Observations:
Fibonacci Retracement from ~20674 to ~15732 marks the initial corrective range.
Trend-Based Extensions forecast:
TP1 (~23,400): First breakout resistance
TP2 (~26,700): Medium-term expansion zone
TP3 (~30,344): Long-term target if macro tailwinds persist
Scenario Pathways:
Bullish Continuation: Breaks above ATH to reach TP2/TP3
Healthy Correction: Pullback to ~20,600 or deeper ~18,300 before resumption
Deep Correction: Revisits ~16,700 zone if macro environment deteriorates
Fundamental Context:
Tech Stocks & Economic Sentiment: NDX is often the first to move during liquidity expansions. Its performance signals risk-on behavior across global equity markets.
Rate Cuts in 2025: With anticipated Fed rate cuts, tech stocks are primed for inflows. Forward earnings valuations rise, justifying extended upside in high-beta tech.
AI Boom & Earnings Growth: Nasdaq is heavily weighted toward AI, cloud, and semiconductors—sectors expected to lead earnings surprises.
NDX Influence on Gold and Crypto
When NDX rallies:
Crypto: Risk appetite improves. Capital rotation flows into altcoins and layer-1 assets.
Bitcoin: Often sees parallel inflows, especially during strong tech rallies (e.g., 2020).
TOTAL & TOTAL3: Begin breakout patterns if NDX continues to surge.
Gold: May stall or correct as investors favor risk assets. However, gold still holds due to macro hedging and real yield pressures.
When NDX corrects:
Crypto: Volatility spikes. Altcoins bleed faster.
Bitcoin: Short-term dip but may decouple if viewed as digital gold.
Gold: Benefits from flight-to-safety behavior.
US10Y: Often reacts inversely to NDX moves—used for confirmation.
Search Highlights (2024–2025):
Institutions view NDX correction as signal to rotate into commodities (incl. gold).
Cross-market correlations show NDX peaks often precede crypto mini-rallies.
De-risking from NDX often triggers gold strength, especially in geopolitical or inflationary backdrops.
Bias & Strategy Implication
Primary Bias: Bullish
Expecting upside continuation to 26,700–30,000 zone
Multiple correction opportunities are present even during rally
Strategic Actions:
Monitor for correction to yellow/red zones for accumulation
Use NDX behavior as leading macro signal for crypto rotations
Watch resistance at 23,400 closely; breakout confirms trend extension
Time Horizon
Short-Term (1–2 months): Watch for breakout or correction to ~20,600–18,300
Mid-Term (3–6 months): Probable test of ~26,700
Long-Term (6–12 months): Potential expansion to ~30,344.49

Digital Turbine, Inc. (APPS)As a Whole formation, it looks to me the nearest Scenario is we Completed Major 1st Wave at 102$ , In my opinion as a technical analyst in charts and technical formations, in addition to the corrective formations I have encountered many times before, we have completed the correction of a leg of a major correction for the second large wave at $1.18. We are entering the early stages of the second leg, which I expect 99% will go to its final target at $141 by 2027. However, the closest level in 2025 is $25, and perhaps with significant news like a partnership and investment with major companies, it might hit the target of $49 by early 2026. The correction as a whole is called the minor or accelerating correction A B C.
Target Prices and Expected Periods: -
1 Month = 25$
6 - 9 Months = 49$
12 - 15 Months = 141$
APPS has a High Technical Rating by Nasdaq Dorsey Wright.
Earnings announcement* for APPS - Jun 16, 2025

NAS100 - Will the stock market reach its previous ATH!?The index is above the EMA200 and EMA50 on the 4-hour timeframe and is trading in the specified pattern. In case of a valid break of this range, I expect a new trend to form. It is better to wait for confirmation on the break in order to control further risk.
U.S. President Donald Trump announced that an American delegation will meet with Chinese representatives in London on June 9 to discuss a potential trade agreement. In a post on Truth Social, Trump stated, “I’m pleased to announce that Treasury Secretary Scott Bessent, Commerce Secretary Howard Lutnick, and U.S. Trade Representative Jamieson Greer will meet with Chinese officials on Monday, June 9, 2025, in London to discuss a trade deal.” He added that he expects the meeting to go “very well.” U.S. stock markets rose on Friday, and Chinese markets are now following suit. The Hang Seng Index has reached its highest level since March.
Meanwhile, Amazon has completely halted its hiring budget for office workers in its core retail business. This decision applies only to white-collar staff and excludes warehouse employees and those in its cloud computing division. According to Business Insider, which cited internal company emails, the hiring freeze affects Amazon’s online marketplace, logistics operations, and grocery business.
Having doubled its workforce between 2019 and 2021 to 1.6 million, Amazon reduced that number to 1.55 million last year. Since late 2022, the e-commerce giant has laid off at least 27,000 employees.
This move comes as the U.S. jobs report released Friday helped ease some concerns, though signs of broader economic challenges remain. Experts suggest that such a hiring freeze could reflect broader economic trends—where mass layoffs are avoided, but hiring slows down significantly.
In May, the U.S. economy added 139,000 jobs, down from 147,000 in April. The unemployment rate remained steady at 4.2%, staying within the narrow range it has held over the past year. The labor market has remained resilient, dismissing fears that tariffs would cause a significant slowdown. So far, tariff-related disruptions have not been severe enough to destabilize the job market—at least not in May.
Data indicates that employers continue to refrain from layoffs, even as hiring has slowed considerably compared to the post-pandemic surge. Labor market analysts expect signs of weakness to emerge in the coming months, as businesses become more cautious about hiring due to uncertainty surrounding tariffs—according to recent surveys. For now, however, the labor market remains strong.
The absence of red flags in employment may give the Federal Reserve more room to maintain its patient stance on interest rate cuts. This year, Fed officials have kept interest rates higher than average to curb inflation by increasing borrowing costs. The Fed’s dual mandate is to keep inflation low and employment high, and it may opt to cut rates to stimulate the economy if the labor market weakens.Fed Chair Jerome Powell and other FOMC members have said they are waiting to see whether President Trump’s trade wars will stoke inflation, trigger job losses, or both. So far, neither scenario has materialized. Strong labor market data may give them further justification to stay in wait-and-see mode. Rosner wrote, “Given the Fed’s sharp focus on inflation risk management, today’s stronger-than-expected jobs report is unlikely to alter its patient approach. We expect the Fed to remain on hold at this month’s meeting and believe further deterioration

NASDAQ Outlook: Waiting for a Catalyst in a Range-Bound Market!The NASDAQ NAS100 has shown impressive gains recently 📈, but overall sentiment remains cautious 😐 as the market consolidates and trades sideways in the short term 🔄. Investors seem to be waiting for a new catalyst—such as major economic data or policy announcements 📰—before committing to a clear direction.
Ongoing political and economic uncertainties, including trade negotiations 🤝, interest rate outlooks 💸, and valuation concerns 💰, are keeping market participants on edge. Given these factors, the near-term environment is likely to remain choppy and range-bound 🌊. As traders, it’s important to approach the markets with caution ⚠️, especially as equities approach key resistance areas 🚧. This uncertainty may also impact currency and other financial markets 💱. While tech stocks could eventually break out of the current range 💻, the direction is still unclear. Prioritize risk management and protect your capital during this period of heightened uncertainty 🛡️.
Political and economic uncertainties—like ongoing trade negotiations, interest rate expectations, and concerns about valuations—are keeping investors on edge.
The near-term outlook for the US100 is for choppy, range-bound trading as the market works through these uncertainties.

The Last Batch of Good DataCME: Micro E-Mini Nasdaq 100 Index Futures ($MNQ) #TheFuturesLeap #Microfutures
Investors have defied the Wall Street adage of “Sell in May and Go Away”.
The S&P 500 rose by 6.2% in May while the Nasdaq climbed 9.6%. Both indices notched their best monthly results since 2023. The Dow Jones gained 3.9% for the month. The S&P stood out as it recorded its best performance for the month of May since 1990.
Several favorable factors propelled May’s impressive stock index gains:
• Early-May employment data pointed to continued strength, raising risk appetite.
• A temporary U.S.-China tariff reduction for 90 days helped calm trade tensions.
• Robust earnings from Nvidia and Super Micro Computer fueled rally momentum.
Meanwhile, these unfavorable events also occurred in May:
• Moody’s downgraded the US sovereignty rating. By now, the US has lost its AAA ratings from all three major credit agencies.
• The 20-year Treasury bond auction received a cold shoulder in the bond market.
• The trade talk between U.S. and China has been stalled apparently.
In any other time, bad news of such significance would send the stock market into a free fall. But investors turned a blind eye to them. This highlighted a bullish market sentiment, a prevailing appetite for risky assets amid uncertainty in geopolitical and trade tensions.
Underpinning the rising stock prices are solid macroeconomic data for the month of April and strong Q1 earnings from major US corporations. Given that stock prices reflect expected future earnings, it is fair to ask: Will the data stay good?
Import dependency is unlikely to change any time soon
On May 30th, US Census Bureau reported that the U.S. trade deficit in goods narrowed sharply in April, with the gap contracted 46.0% to $87.6 billion. Goods imports decreased by $68.4 billion to $276.1 billion. Exports of goods increased by $6.3 billion to $188.5 billion.
What really happened is that there was a boost in imports in Q1 due to the front-running ahead of tariffs. This ended in April as the higher rates kicked in. If we take March out as an outliner, we will find that the April data is 9.7% higher than February. As a matter of fact, U.S. trade deficits in 2025 rose sharply comparing to 2023 and 2024 levels.
With the US-China interim trade deal in effect from May 14th, we could expect large waves of imports to resume from now through August, pushing trade deficits even higher.
The global supply chain is decades in the making. Its undoing will take years. Meanwhile, imports will pour in, only at higher costs due to the new tariffs and higher freight costs.
My conclusion: U.S. trade deficit will grow bigger, at least for the remainder of 2025.
Retail price hikes could cause inflation to rebound
US retailers largely source their products overseas. Could they just “eat the tariffs?”
• Walmart: FY2024 revenues $681 billion (+5.1% YoY). Net income jumped 25.3% to $19.4 billion, lifting its net profit margin to 2.9%.
• Target: Revenue $107.4b (-1.6%). Net income $4.14b (+49%). Profit margin 3.9%.
• Costco: Revenue $254.5b (+5.0%). Net income $7.37b (+17%). Profit margin 2.9%.
• Walgreens: Revenue $147.66 billion (+6.17%). Net Income -$8.64 billion (-5.9%)
• Amazon: Revenue $638.0b (+11%). Net income $59.2b (+95%). Profit margin 9.3%.
Apparently, even the largest and the most efficiently run retail giants are operating with a razor-thin margin. Retailers really have no choice but to pass on the tariffs to consumers, in the form of higher prices.
On May 15th, Walmart announced to raise prices starting in late April. The price hikes would accelerate in May, and a larger sting will start to be felt in June and July when the back-to-school shopping season goes into high gear.
Other retailers are expected to follow suit. Walmart’s action provides air cover for the tens of thousands of retailers to raise their prices freely.
My conclusion: Inflation will go up from May through the holiday season in December.
Higher interest cost will eat into the bottom line
While stock investors brushed off the Moody’s downgrade, the bond market has been in real trouble. As the US treasury bonds lost their “risk-free” status, debts of all kinds and all durations see a big spike in yield. Bond investors are undergoing a complete makeover of repricing bonds and reassigning a new “risk premium”.
On May 21st, the U.S. Treasury held an auction for 20-year bonds that fell significantly short of expectations. The lack of bidders—an alarming indicator of waning confidence in the U.S. economy—resulted in the yield on these bonds skyrocketing to 5.1%.
The bond yields go up even though the Fed holds rates steady. This indicates that central bank monetary policies are not very effective in shaping the long end of the bond market. Even if the Fed lowers the overnight Fed Funds rates, bond investors would still demand higher yield to compensate for the perceived risk increases for the once “risk-free” instruments. Commercial banks could keep interest rates high for mortgages, corporate bonds, auto loans and credit cards.
As of June 2nd, the futures market puts the odds of the Fed holding rates unchanged at 95.4% for its June 18th FOMC meeting, according to CME Group FedWatch tool.
www.cmegroup.com
My conclusion: The Fed may have little appetite for cutting rates if inflation goes up. When they cut the overnight rates, businesses and households may not get any relief from high interest expenses.
Trade tensions and geopolitical risks may stay elevated
Before the ink dries on a temporary agreement, the trade talk between U.S. and China has been stalled. The minister-level negotiation has gone nowhere, and it may take presidential talk to salvage the agreement. At this point, we could not make any assumption about any trade agreement. Its shape and form and timing are uncertain. If the trade talk breaks down, we will see a new round of tariff reescalation and retaliation.
On June 2nd, breaking news report that Ukraine carried out a large drone attack deep into the Russian territory. Russian retaliation is expected. After months of effort, potential ceasefire and peace negotiation could fall apart.
My conclusion: Trade and geopolitical tensions are both escalating, after early signs of calming down. These would hurt economic growth and dent investor appetite for risk.
Trading with Micro E-Mini Nasdaq 100 Index Futures
Based on my analysis above, I hold the opinion that good data may quickly turn bad in the coming weeks, and correction in the US stock market is imminent. Valuation at the current lofty level completely ignores the risk escalation closer on to us. Anyone sharing this view could express it by shorting the CME Micro E-Mini Nasdaq 100 Index Futures.
The Micro Nasdaq contract has a notional value of $2 times the index. At the Friday closing price of 21,578, each September contract is worth $43,156. The minimum margin for shorting one contract is $3,036 at the time of this writing.
The latest CFTC Commitments of Traders report shows that, as of May 27th, the total open interest for Emini Nasdaq and Micro Nasdaq futures are 275,143 and 204,499 contracts, respectively.
• Leverage Fund has 77,467 in long, 251,452 in short, and 10,472 in spreading
• The long-short ratio of 1-to-3.2 (= 77467/251452) show that the “Smart Money” is very bearish on the Nasdaq while the index gained nearly 10% in May
Hypothetically, if Nasdaq 100 were to pull back 5% before September, a short futures position will gain $2,157.8 (= 21578 * 0.05 * 2).
The risk of shorting the Nasdaq is that the stock index continues to rally. To hedge the downside risk, the trader could set a stop-loss at his order. For example, a stop loss at 23,000 for a short order would set the maximum loss to $2,844 (= (23000-21578) x 2).
Happy Trading.
Disclaimers
*Trade ideas cited above are for illustration only, as an integral part of a case study to demonstrate the fundamental concepts in risk management under the market scenarios being discussed. They shall not be construed as investment recommendations or advice. Nor are they used to promote any specific products, or services.
CME Real-time Market Data help identify trading set-ups and express my market views. If you have futures in your trading portfolio, you can check out on CME Group data plans available that suit your trading needs www.tradingview.com

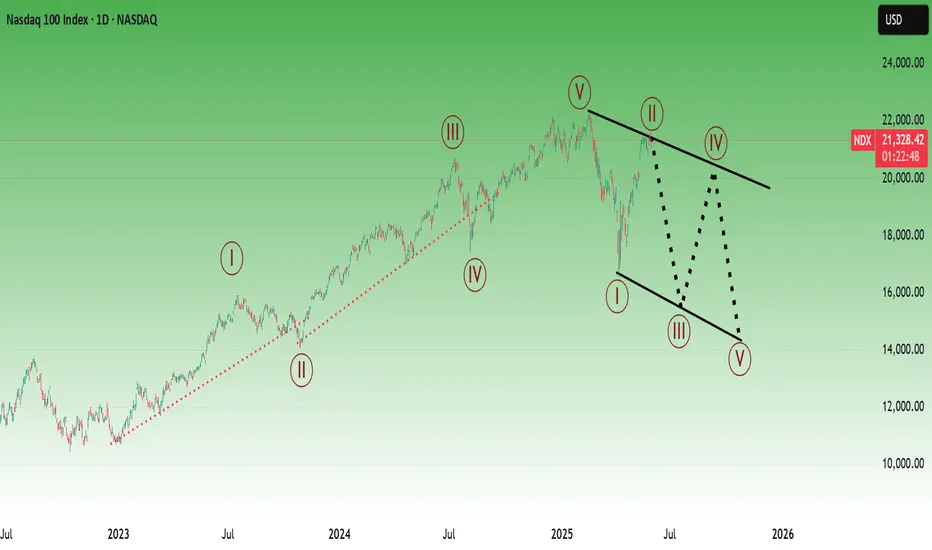
Nasdaq RoadmapTo me the view is pretty clear.
* The purpose of my graphic drawings is purely educational.
* What i write here is not an investment advice. Please do your own research before investing in any asset.
* Never take my personal opinions as investment advice, you may lose your money.