NASDAQ100 UPDATESAre we seeing pullback or we just go higher on this moves?
I have 2 options on buying zone.
Trade at your own decissions.
Some Trades are perform on my public community.
This is not a financial advice.
We hit 15000 target last friday.
Probably my hit zone next is 15200 only if price has momentum.
Nasdaq100

NAS100 H4 | Tech under pressure?The Nasdaq 100 (NAS100) is rising towards a pullback resistance and could potentially reverse from here to drop lower towards our take profit target.
Entry: 14877.90
Why we like it:
There is a pullback resistance that aligns with the 38.2% Fibonacci retracement level
Stop Loss: 15132.35
Why we like it:
There is a pullback resistance that aligns above the 61.8% Fibonacci retracement level
Take Profit: 14496.90
Why we like it:
There is a swing-low support level
Please be advised that the information presented on TradingView is provided to Vantage (‘Vantage Global Limited’, ‘we’) by a third-party provider (‘Everest Fortune Group’). Please be reminded that you are solely responsible for the trading decisions on your account. There is a very high degree of risk involved in trading. Any information and/or content is intended entirely for research, educational and informational purposes only and does not constitute investment or consultation advice or investment strategy. The information is not tailored to the investment needs of any specific person and therefore does not involve a consideration of any of the investment objectives, financial situation or needs of any viewer that may receive it. Kindly also note that past performance is not a reliable indicator of future results. Actual results may differ materially from those anticipated in forward-looking or past performance statements. We assume no liability as to the accuracy or completeness of any of the information and/or content provided herein and the Company cannot be held responsible for any omission, mistake nor for any loss or damage including without limitation to any loss of profit which may arise from reliance on any information supplied by Everest Fortune Group.

US100 Technical Analysis and Trade IdeaI'd like to share my insights on the US100. As the week is coming to a close, it's important to be mindful of potential stop runs by institutional traders, which can be quite aggressive on Fridays. Additionally, we have the Non-Farm Payrolls (NFP) report scheduled later today, so if you're considering trading, exercise extreme caution.
These remarks are more in the context of a potential trading setup should we witness a retracement today, possibly setting the stage for Monday. It's crucial to remember that the information in this video is intended for educational purposes only and should not be considered as financial advice. Please ensure that you apply robust risk management techniques when engaging in trading.
Wishing you a wonderful weekend ahead!

NASDAQ Elliott Wave Analysis for Friday 06/10/2023The primary expectation is that wave X has finished and that we are doing an ABC pattern down as wave Y. We see two equally valid scenarios. Firstly, we might have finished wave Y as an ABC. Secondly, so far we only finished wave ((a)), wave ((b)) is ongoing as a triangle, and wave ((c)) is still coming.


NASDAQ Elliott Wave Analysis for Thursday 05/10/2023The primary expectation is that wave X has finished and that we are doing an ABC pattern down as wave Y. We see two equally valid scenarios. Firstly, we might have finished wave Y as an ABC. Secondly, so far we only finished wave ((a)) and wave ((b)), wave ((c)) is still coming.

NASDAQ 05/10 MovePair : NASDAQ - US100
Description :
Impulse Correction Impulse , Correction in a Corrective Pattern " Bearish Channel " and Completed ( 123 / AB / WX ) Corrective Wave and Bullish Channel in Short Time Frame if it Breaks the Lower Trend Line then Short

Trend reversal to the UPSIDE if Nq! Holds 100 EMA on DailyLooking at today's Bounce with high Volume, the Nasdaq futures have again reclaimed 100 EMA on the daily timeframe. There is a very high probability that Nasdaq Futures will go higher in coming days and test 50 day EMA. If it closes above 14,809 tomorrow, then this is the trend reversal and we are again in the bullish trend. Keep an eye on the 100 EMA, if it looses then there will be a lot of selling to the short side. As of now we are very bullish in coming days till Friday. And then we can analyze the closing of the week.

NASDAQ Elliott Wave Analysis for Wednesday 04/10/2023The primary expectation is that wave X has finished and that we are doing an ABC pattern down as wave Y. We see two equally valid scenarios. Firstly, we might have finished wave Y as an ABC. Secondly, so far we only finished wave ((a)) and wave ((b)), wave ((c)) is still coming.

$NQ1! Nasdaq100 futures on supportNasdaq 100 futures is currently on support
Expecting a little bounce here
If support breaks, then next line of defence is a thousand points lower
Markets look weak

NASDAQ Elliott Wave Analysis for Tuesday 03/10/2023The primary expectation is that wave X has finished and that we are doing an ABC pattern down as wave Y. We see two equally valid scenarios. Firstly, we might have finished wave Y as an ABC. Secondly, so far we only finished wave ((a)) and waves ((b)) and ((c)) are still coming.

Navigating Rocky Oct After a Crushing Sept in US EquitiesSeasonality is pervasive in financial markets. Some are benign while others are not. The “September Effect” refers to a month when equity returns gets crushed. Typically, this is followed by a volatile October.
Other well-established pattern in equity markets is the "Santa Claus Rally" which is known to occur during December. Equities go bullish with increased optimism, holiday spending, and portfolio rebalancing before the end of the year. Then, there is also the "January Effect" where small-caps tend to outperform large-caps in the early part of the year.
Essential to remember that historical trends do not guarantee future performance. This paper delves into the September Effect followed by the volatility which tends to be witnessed during the month of October.
Portfolio managers can prudently position their portfolios to gain from rising volatility and sharp price moves in October and the rest of the final quarter.
WHAT EXPLAINS POOR EQUITY RETURNS IN SEPTEMBER?
There is no exact rationale explaining why September is historically the worst month of the year for equities. Over the last 94 years, September is the only individual month that has declined at least 50% of the time.
Scott Bauer, CEO of Prosper Trading Academy surmises in an opinion note that three drivers plausibly explains this:
1. Post Summer Vacation: In the lead up to summer in Europe, average trading volumes grind lower resulting in lower volatility from June to August. When portfolio managers and investors return in September, their collective rebalancing of portfolios cause panicked exits as they create space for new holdings. This mass-exodus of selling shares pushes prices lower making September the worst month for stocks.
2. Year-end for Mutual Funds: Many mutual funds close their fiscal year in September. These funds purge their portfolios during this ill-fated month.
3. New Bond Issuances: Like equity trading activity, bond issuances ease during summer and return with vengeance and spikes in September. New issuances channel existing money into bonds forcing investors to rotate out of equities and into bonds.
SEPTEMBER US EQUITY MARKET PERFORMANCE IN THIS MILLENNIUM
Does the September effect prevail in the current millennium? Since start of 2000, September indeed is the worst month for S&P 500 stocks with average returns of -1.8%.
Surprisingly, the months with the highest occurrence of negative returns is not September but January. Over the last 23 years, January had 13 months of negative returns. June along with September rank second with 12 occurrences of negative returns during the same period.
The chart below summarises average monthly returns of S&P 500 index. Clearly, on average, September stands out as a poor performer while April is the best .
Interestingly, the S&P 500 shares tend to deliver positive returns with average upside performance of 3.22% in the fourth and final quarter of the year.
Likewise for Nasdaq 100, the September Effect is even more pronounced with index plunging 2.61% on average.
Unlike S&P 500, February (14 of 23) has the highest number of months with occurrence of negative returns. The month with the second highest occurrences of negative returns are September, June, and December with 12 of 23 years marking a negative return.
The chart below summarises average monthly returns on the Nasdaq 100 index. While September crushes Nasdaq stocks, October is the best month thus far this millennium.
October and November deliver positive returns with a pullback in December. On average, Nasdaq 100 upside performance stands at +2.44% in the fourth quarter.
A CRUSHING SEPTEMBER IS FOLLOWED BY A ROCKY OCTOBER
While September is the king of worst month for stock returns, October claims the crown for being the most volatile.
Over the last 23 years, the S&P 500 equity returns show the largest exaggeration in October. Range as used below is defined as the high minus the low of the month and then expressed as a percentage as month’s opening level.
Analysis shows that equity returns move by 9.1% in October compared to 6.9% on average for the rest of the months in the year.
Similarly, observations in Nasdaq-100 also point to exaggerated range of returns during the month of October.
Range in Nasdaq monthly returns stand at 11% in October compared to 9.2% on average for the rest of the months in the year.
Based on expected returns and volatility, investors in S&P 500 can expect large swings in returns in October as evident from the chart below.
Likewise, Nasdaq 100 investors can expect large swings in October returns based on observations over the last 23 years.
OUTLOOK FOR FINAL QUARTER OF 2023
Twenty-three years of historical observations point to a positive upward bias in equity returns for the last three months of the year. This time however, the outlook going into the final quarter is beset with head winds. Not one but five of them approaching in parallel. Risk lurks in many places.
Strong dollar. Oil skirting near $100/barrel. Resumption of student loan repayments. Record high mortgage rates driven by higher for longer policy stance. Automotive workers striking at multiple plants potentially leading to higher labour costs and automotive inflation.
Dollar is trading at 10-month highs. The US 30-year mortgage rates at record high levels unseen in 23-years. The 10-year US yield are at levels last observed during 2007.
Gathering of these dark clouds are starting to show up in the University of Michigan’s US Consumer Confidence index. Since June, American exceptionalism boosted the index to 71.73 clocking a 52-week high. However, with a raft of concerns weighing on the consumers, the index has started to drop the last two months.
HARVESTING VOLATILITY EXPANSION USING CME MICRO OPTIONS ON S&P 500 AND NASDAQ 100 INDEX
In times of uncertainty, where seasonality leans towards a bullish rally but fundamentals signal a bearish grind, portfolio managers can position to gain from volatility expansion and sharp index moves in either direction.
Options can be used to engineer a convex portfolio. Convexity in finance refers to portfolio strategies which enjoy outsized and solid gains while limiting downside risks. Convex strategies deliver non-linear returns with substantially higher gain for every unit of pain.
LONG STRADDLE USING OPTIONS ON CME MICRO E-MINI S&P 500 FUTURES
Long straddles involve holding a simultaneous long call and long put position at the same strike price for the same expiration period.
Let’s look at a hypothetic long straddle using Micro E-Mini S&P 500 Options expiring on 29th December 2023 at a strike price of 4400. The straddle pay-off is visualised in the chart below.
This trade will generate positive returns when (a) index rises above 4655, or (b) index falls below 4145, or (c) volatility expands .
The premium required for this trade (as of 2nd October 2023): (Premium for Call Option + Premium for Put Option) = (USD 631.7 + USD 636.65) = USD 1268.35.
If index rises 10% to 4840: Call option would pay out ~USD 1568 = ((4840 – 4400) x 5 – Premium for Call Option) = (440 x 5 – 126.34) while the put option would expire worthless, so, net profit would be: (Net PnL from Call leg – Net PnL from Put Leg) = (1568 – 636.65) = ~USD 932
By the same measure, the long straddle will suffer losses if the index remains flat or its moves are muted. It also loses money if volatility remains flat or contracts.
If index remains at 4400: Both options would expire worthless, so, the position would lead to a net loss of the premium paid = Loss of USD 1268.35.
LONG STRADDLE USING OPTIONS ON MICRO E-MINI NASDAQ 100 FUTURES
Let’s look at another hypothetic long straddle using Micro E-Mini Nasdaq 100 options expiring on 29th December 2023 at a strike price of 15250. The straddle pay-off is visualised in the chart below.
This trade will generate positive returns when (a) index rises above 16416, or (b) index falls below 14084, or (c) volatility expands.
The long straddle will endure losses if the index remains flat or its moves within a narrow range. It will also lose if volatility remains flat or shrinks.
MARKET DATA
CME Real-time Market Data helps identify trading set-ups and express market views better. If you have futures in your trading portfolio, you can check out on CME Group data plans available that suit your trading needs www.tradingview.com
DISCLAIMER
This case study is for educational purposes only and does not constitute investment recommendations or advice. Nor are they used to promote any specific products, or services.
Trading or investment ideas cited here are for illustration only, as an integral part of a case study to demonstrate the fundamental concepts in risk management or trading under the market scenarios being discussed. Please read the FULL DISCLAIMER the link to which is provided in our profile description.

$NDX Quarter 3 (Q3) AnalysisThe NASDAQ has been performing extremely well for the year, and a special rebalance was put into effect in July to slow down the NASDAQ’s growth. Currently the NASDAQ has support in the EMA ribbon, which also intersects with the white support zone and yellow support line. This yellow support line has been acting as a support level since January 2023. I think the NASDAQ will have a bullish Q4 and will trend towards a new all-time high (green circle). However, I think this new all-time high could get delayed until Q1 and Q2 of next year, but I do expect a strong performance for the NASDAQ in Q4.

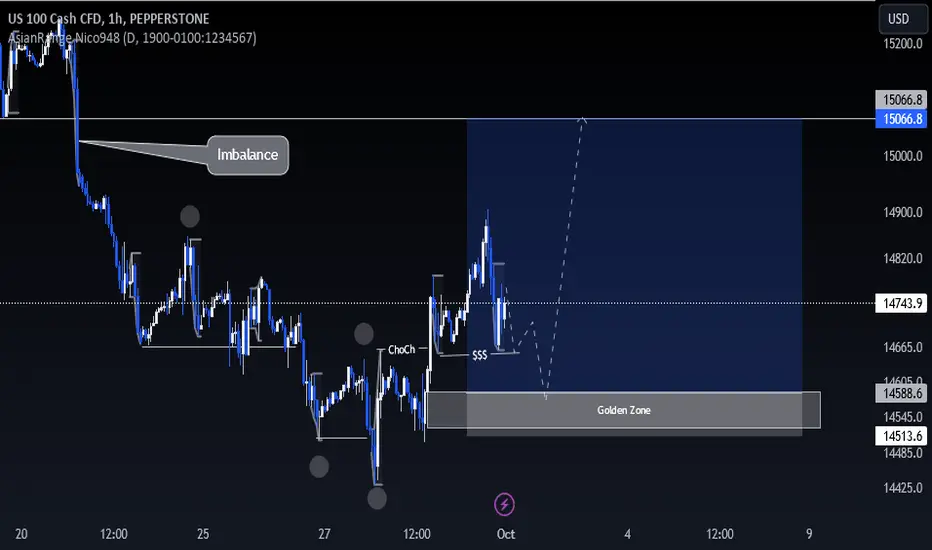
NAS100 possible reversal bounceAfter price broke structure to the upside, it retraced and formed liquidity above a demand zone that was left behind during the expansion. Price could now use this demand and liquidity to fuel its move upwards to fill a massive imbalance that was left behind during the previous bearish expansion.
USTECH What to expect in on 2nd Oct 2023. USTECH has held a special place in my portfolio for quite some time due to its responsiveness to news related to tech giants. Additionally, economic news exerts significant influence on market trends.
I'm of the opinion that there is still potential for the market to gather more liquidity and for orders to be established before any downward movement occurs. Thus, I'm keeping my hopes high for the London/New York trading session.

Lazyluchi Trades Nasdaq EP 30I've been closely eyeing two formidable support zones: 14706 and 14566. These zones have been like battle-tested fortresses, holding their ground against market forces for a considerable duration.
My trading strategy revolves around the idea of potentially buying at these critical levels and holding steadfast, seeking not just profit, but aiming for that coveted 3R (a reward three times the risk).
Yet, as any seasoned trader knows, the market is an ever-changing beast. If these support zones are breached, a new opportunity arises on the other side of the battlefield. In this scenario, I have my sights set on riding the shorts, navigating the market's bearish waves until we reach the next bastion of support at 14235.
I've set my alerts, like sentinels, to notify me of any significant movements in either direction.
Now, here's the twist that has left me utterly astounded: all my recent trades have hit their take-profit marks. I managed to accumulate an astonishing total of 150+400 ticks. It's nothing short of astonishing because, honestly, I never truly believed I had the resilience to hold onto my positions as the market ebbed and flowed.
This week has undoubtedly been one for the record books, a testament to the growth of my trading skills and the power of determination. It's moments like these that remind me of the untapped potential within myself and the boundless opportunities the market presents.
Let’s see what she gives for the coming week..
