Nasdaq market analysis: 14-APRIL-2025Good morning! Happy New Week! Here's your daily Nasdaq market analysis. Learn, grow, and trade wisely.
Nasdaq100

Trade the Structure: NAS100 Possible Retrace & Buy OpportunityThe NAS 100 recently broke its market structure after a twist in trade policy—with Donald Trump delaying tariffs by 90 days—which sparked a robust rally. On the 4‑hour chart, we're looking for a bullish setup where the initial surge might be followed by a pullback into a sideways accumulation zone. This consolidation is expected to form a "spring" pattern—a brief retest that could trap sellers—followed by a clear break of market structure that signals a renewed upward move. The entry is ideally on the breakout, backed by supportive volume, while risk management is maintained with a stop-loss positioned just below the range if/when price retraces into support. 🚀📈💰

Tactical US100 Trading: Converting 1W Trend into 30m Opportunity📈 The US100 index is currently exhibiting a bearish trend pattern on the weekly timeframe. We can observe a notable rally followed by a retracement into equilibrium when analyzed against the previous price wing range.
🔎 Currently, the index is positioned at a premium level, creating an environment where short sellers might be building positions in anticipation of further downward movement. However, market dynamics remain highly sensitive to external influences, particularly unexpected statements and social media announcements from influential figures like Donald Trump.
🌊 With such market unpredictability in play, focusing on shorter timeframes provides more actionable intelligence. Price action signals offer clearer guidance in this volatile environment.
⚡ Trade Opportunity: The 30-minute chart reveals a defined trading range worth monitoring. A definitive break above this range could present an opportunity to enter long positions, while a breakdown below support might signal a favorable short entry point.
🎯 This breakout strategy enables traders to respond to actual market movements rather than attempting to forecast the broader market direction—a particularly valuable approach given the current unpredictable market landscape.
⚠️ DISCLAIMER: This analysis is provided for informational purposes only and does not constitute financial advice. Trading carries significant risk of capital loss and may not be appropriate for all investors. Historical performance does not guarantee future outcomes. Always perform independent research and consider your personal financial circumstances before executing any trades. Market conditions are subject to rapid changes, and no trading methodology ensures profits. The information presented should be used as one of many inputs in your decision-making process.

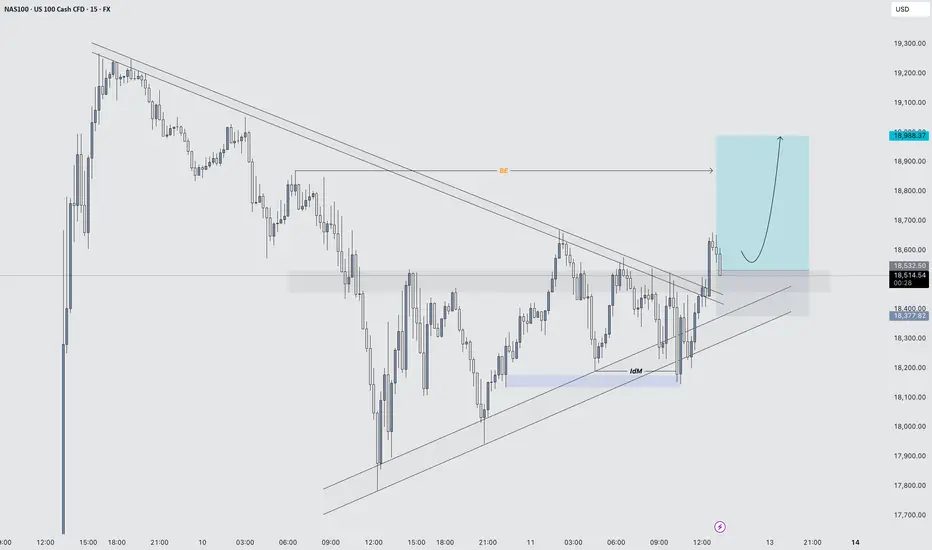
NAS100 (15min) – Bullish Entry Activated1. Symmetrical Triangle Formation
Price was compressing inside a symmetrical triangle, with a series of lower highs and higher lows, indicating indecision and buildup of pressure.
2. Downside Fake-out (False Breakout)
Price briefly broke below the lower trendline, suggesting a potential bearish breakout.
However, there was no strong follow-through; instead, price quickly reclaimed the trendline and pushed back inside the structure.
This is a classic fake-out, often trapping late sellers and providing liquidity for buyers.
The rejection from the lows resulted in a long wick, signalling strong buying interest and failure to break down.
3. Aggressive Bullish Reaction
After reclaiming the triangle support, price moved rapidly back to the top of the triangle.
The next key move was a strong breakout above the upper trendline, confirming bullish intent.
4. Break and Retest
Price action followed through with a clean breakout above resistance, followed by a minor pullback and retest of the broken trendline, which held as support.
This retest offered a textbook entry point based on price action principles.
5. Bullish Structure Confirmation
Post breakout, price formed a higher low and continued to make a higher high, confirming a trend shift.
This structural change strengthens the bullish outlook.
Today analysis for Nasdaq, Oil, and GoldNasdaq
The Nasdaq closed higher on the daily chart. It held above 18,360 at the close, and today’s candle formed a golden cross as the MACD crossed above the Signal line, creating a potential buy signal. However, this signal will only be confirmed if the candle closes as a solid bullish bar, so it's too early to say that a buy confirmation has been established.
On the weekly chart, although the index has not yet reclaimed the 5-week MA, it has gapped above it. Overall, the index appears to be forming a box range between the 3-week and 10-week MAs, and if further upside occurs, we could potentially see a move toward the 60-week MA. However, since the MACD and Signal line on the weekly chart are still sloping downward, there's a high possibility of a medium-term pullback even if the index rallies to the 10-week MA.
On the daily chart, the index is still meeting resistance at the 20-day MA, and the key point now is whether the MACD completes the golden cross or turns downward again. Since the index has managed to hold above 18,360, the potential for a rebound remains open. Buying during pullbacks near the lower wick remains a favorable strategy.
On the 240-minute chart, the MACD is turning upward after finding support at the Signal line, forming a potential third wave of buying. In short-term timeframes, buying on dips remains favorable.
This week, the Retail Sales data is scheduled for Wednesday, and the U.S. markets will be closed on Friday. Please keep that in mind for risk management.
Crude Oil
Crude oil closed higher in a narrow range on the daily chart. On the weekly chart, a long lower wick formed, finishing with a doji candle, suggesting indecision. Last week, oil was rejected at the 3-week MA, forming an upper wick. If it rallies this week, it could target the 5-week MA. The $65 level, near both the 5-week and 240-week MAs, remains a strong resistance zone, making it a potentially favorable area to consider short trades.
On the daily chart, oil has entered a box range between the 5-day and 10-day MAs. Though the MACD and Signal line still point downward, oil is currently holding within a supportive range. There is a possibility the MACD could begin to turn upward, so keeping both bullish and bearish scenarios open is advisable.
On the 240-minute chart, the MACD is still rising after a golden cross but remains below the zero line, suggesting a potential for another pullback. Overall, monitor intraday movements and continue to trade within the range.
Gold
Gold closed higher, setting a new all-time high. The weekly chart formed a strong bullish candle, resuming its upward trend. Buying near the 3-week MA remains favorable. As the price has overshot the previous target of $3,216, we’ve now entered an overshooting zone, making it difficult to define the next resistance. Therefore, caution is advised for short positions, and it’s best to focus on buying the dips.
On the daily chart, the new all-time high generated a bullish signal, and buying near the 3-day MA is recommended. Gold may enter a sideways consolidation phase while aligning its moving averages. In that case, buying near the 5-day MA may also be considered, but avoid chasing the price higher.
The MACD has made another golden cross, and it’s important that the MACD doesn’t create a divergence by failing to surpass its previous peak. Avoid shorts, and stick with buy-the-dip strategies. On the 240-minute chart, buying momentum remains strong. The RSI is in overbought territory, so again, avoid shorting and focus only on buying during pullbacks.
Market Outlook
Compared to the last two weeks of high volatility, this week is expected to be more subdued. After a period of extreme moves, the market is likely to consolidate and seek direction. Rather than swinging for home runs, it's better to focus on small base hits and steadily build profits.
Wishing you a successful trading week!
If you like my analysis, please follow me and give it a boost!
For additional strategies for today, check out my profile. Thank you!

NASDAQ Futures Long Setup: Pullback Entry After Tariff BoostMarket Outlook – April 13, 2025
Quick recap: In my last public analysis, I mentioned watching the 18,350–18,000 zone for signs of support — a level stacked with confluence (50–61.8% Fib, EMA, VWAP, pivot). Price broke down deeper than expected but responded beautifully:
✅ Tagged 18,000 almost to the tick
✅ Rejected hard at the 61.8 Fib
✅ Respected the 50 Fib on the way back up
All solid signs of strength.
Now with tariff exemptions announced today (bullish for tech/Nasdaq), I’m opening the door to more long setups this week.
Here’s What I’m Watching:
🔹 Scenario A: Pullback into the 18,575–18,500 zone (first dotted white line). If price reclaims structure or gives me something clean — EMA bounce, VWAP tag, candle pattern — I’ll look for longs.
🔹 Scenario B: If that level breaks or I miss the first shot, I’ll look for a second chance around 18,000–18,300. Same deal: not jumping in blindly, waiting for a setup to form.
To be clear — these are areas of interest, not automatic trades. I want clean structure and confirmation before entering.
Let’s see how it plays out. Will update if/when I take a position. Stay sharp. 📈

$QQQ Poised for Lift-Off: Flipping Resistance, Eyeing $470-$475!🚀 NASDAQ:QQQ Poised for Lift-Off: Flipping Resistance, Eyeing $470-$475! 🚀
As mentioned in my recent post, we’ve successfully flipped the $443.14 resistance into support—a key technical shift!
🔹 Momentum Building:
- Wr% Indicator: Making higher lows and advancing steadily towards the Red Barrier.
- Volume Gap: Still in play and ready to be filled.
With a higher low now established, I believe we’re set up for a potential move to $470-$475 next week.
📈 Let’s see how this plays out—exciting times ahead!
💡 Have an amazing weekend, friends!
Not financial advice

NAS100 Triangle Apex – Breakout or Breakdown ImminentBullish View:
• Price is forming higher lows and holding above the lower ascending trendline.
• A breakout above the upper descending trendline near 18,500 would confirm bullish
momentum.
• If the breakout is sustained, potential upside targets include 18,650 and 18,800.
Bearish View:
• Price has tested the lower support trendline and shown weakness near the apex of the
triangle.
• A breakdown below 18,100 would indicate bearish momentum and invalidate the ascending
structure.
• If the breakdown is sustained, potential downside targets include 17,950 and 17,700.

Actionable Nasdaq insights: 11-APRIL-2025Rise and shine, traders! Start your day with actionable Nasdaq insights. Let's grow your skills together, one chart at a time.

Today analysis for Nasdaq, Oil, and GoldNasdaq
The Nasdaq closed lower following news of additional tariffs on China. On the daily chart, the index failed to break above the 20-day moving average and pulled back to the 5-day MA, continuing its box-range movement. Since the 5-day MA is still acting as support, the current trend can still be seen as a sideways consolidation, with 18,500 acting as a central pivot level.
The MACD on the daily chart has not yet clearly broken above the Signal line, so it remains uncertain whether it will make a golden cross with additional upward momentum, or turn downward again. Thus, it’s best to adopt a neutral range-bound trading strategy, keeping strict stop-losses on both sides.
On the 240-minute chart, both the MACD and Signal line have moved above the zero line, entering a key area to observe whether the third wave of MACD upside begins after this box-range consolidation. Since the current price is correcting after a rebound from a double bottom, and is maintaining the center of the prior bullish candle, buying remains more favorable. Unless the previous day’s low is broken, it’s better to stay buy-biased.
Please note that today's PPI data release is scheduled, which may lead to increased volatility around the announcement time.
Crude Oil
Crude oil closed lower with a large bearish candle. On the daily chart, it failed to hold the 5-day and 10-day moving averages, breaking below the 5-day MA. The MACD continues its downward slope, and unless oil clearly reclaims the 10-day MA, the market will remain bear-biased.
There is resistance now at the 3-day and 5-day MAs, so it’s important to see whether further downside unfolds. As previously noted, the $59 level is a key support zone — watch closely for any breakdowns.
On the 240-minute chart, the MACD is trending up and pulling the Signal line along, but both remain below the zero line. If oil continues in a box range but the MACD turns downward again and forms a dead cross, there could be another leg lower. For now, continue to focus on buying near the $59 level, and maintain a range-trading approach until further confirmation.
Gold
Gold closed higher with another strong rally. On the daily chart, the MACD has now crossed above the Signal line, generating a buy signal. However, this signal will only be valid if today’s candle closes as a bullish bar, so watching the daily close is critical.
Gold hit new all-time highs during the pre-market session, with the long-awaited 3,216 level, which has been the target since March, now within reach. Beyond this level, we enter the overshooting zone, where it’s difficult to define a precise top. Therefore, it's best to stick to dip-buying strategies, as safe-haven demand continues to surge.
Even though the MACD has crossed bullishly, divergence may form if the current MACD fails to exceed the previous peak. Avoid chasing long positions at the top; instead, look for entries during pullbacks.
On the 240-minute chart, the MACD has climbed above the zero line, showing a strong one-way bullish trend. RSI across intraday charts is now in overbought territory, so it’s best to avoid short positions entirely for today.
Market Sentiment & VIX
Looking at the VIX index, the daily candle has once again broken above the 5-day MA, indicating that volatility could expand further at any time. With Trump’s remarks shaking markets, it’s impossible to predict what new developments might emerge over the weekend.
Avoid holding overnight positions due to heightened headline risk, and make sure to wrap up this trading week with solid risk management.
Wishing you a profitable trading day!
If you like my analysis, please follow me and give it a boost!
For additional strategies for today, check out my profile. Thank you!

Nasdaq: Higher Low or Lower High?NASDAQ:QQQ
Are we making a lower low or a higher low?
This $438-$444 previous resistance needs to hold and be flipped into support to continue this rally.
If not then we are going to break the lows!
Not financial advice

Trade the range until it breaks Nvidia updateThis video is a quick recap on the previous video after the levels I gave produced 30% move to the upside after patiently waiting for the move down to 90$.
So what now is the big question after the unprecedented move we had yesterday .
I outline the next best Short/Long setup and define why I think we stay inside of the range until Earnings Data .

Trump's Second Term Brings Sharpest Market Decline Since 2001It's gone nearly three months or so... (Duh..? WTF.. less than 3 months, really? 🙀) since Donald Trump entered The White House (again).
Those times everyone was on a rush, chatting endless "Blah-Blah-Blah", "I-crypto-czar", "crypto-capital-of-the-world", "we-robot", "mambo-jumbo", "super-duper", AI, VR and so on super hyped bullsh#t.
What's happened next? We all know.. mostly all US stocks and crypto markets turned to 'a Bearish Mode', or to at least to 'a Correction' (that is still actual at this time).
Here's a short educational breakdown for Nasdaq Composite index NASDAQ:IXIC what we think about all of that, at our beloved 💖 @PandorraResearch Team.
Trump's Second Term Brings Sharpest Market Decline Since 2001: Analyzing the recent 15% Stock Market Plunge
President Donald Trump's second term has coincided with a dramatic stock market downturn, with the S&P 500 losing approximately 15% of its value since his January 2025 inauguration. This represents the worst start to a presidential term since George W. Bush in 2001 during the dot-com crash. The decline has erased more than $3 trillion in market value, driven primarily by concerns over trade policies, particularly the implementation of new tariffs.
Market analysts point to growing fears of potential stagflation—a toxic combination of slow economic growth and high inflation—as investor confidence continues to deteriorate despite pre-election expectations of business-friendly policies.
Unprecedented Market Decline Under the New Administration
Historical Context of Presidential Market Performance
The current market downturn stands out in stark relief when compared to previous presidential transitions. The S&P 500 has fallen nearly 10% in the first 10 weeks since Trump's inauguration on January 20, 2025, marking the worst start under a new president since George W. Bush in 2001. This decline is significantly worse than the start of the prior five administrations, with Bush's roughly 18% drop during the dot-com crash being the only steeper decline in recent presidential history. Looking further back, only Richard Nixon experienced a comparable early-term market decline with a 7.2% drop, highlighting the severity of the current situation.
When examining presidential market performance metrics, Trump's second term has already distinguished itself negatively. During the first 50 days, the S&P 500 declined by 6.4%, positioning it among the poorest market starts since 1950. By contrast, the best 50-day starts were achieved by John F. Kennedy (up 9.4%), Barack Obama (up 5.7%), and Bill Clinton (up 4.2%), demonstrating how unusual the current market trajectory is in historical context.
Magnitude of the Current Decline
The scale of market value destruction has been substantial. More than $3 trillion has been erased from the S&P 500's value over approximately 52 trading sessions since Trump's inauguration. By early April 2025, the decline had accelerated to approximately 15% from Inauguration Day, pushing the market dangerously close to bear territory. Market analysts note that if the S&P 500 reaches a 20% decline from its recent peak, it would mark the earliest instance of a bear market during a new administration based on S&P 500 history since 1957.
The tech-heavy Nasdaq Composite has suffered even more severely, with declines exceeding 11% by mid-March. This demonstrates the particular vulnerability of growth stocks that had previously led market gains, now facing the most significant corrections.
Key Factors Driving the Market Downturn
Trade Policy Uncertainty and Tariff Concerns
Trade policy, particularly the implementation and threat of tariffs, has emerged as the primary catalyst for market turmoil. The unpredictable nature of these policies has created significant uncertainty for businesses, investors, and consumers alike. Trump's "on-again, off-again approach to tariffs" has effectively extinguished the optimism that initially buoyed markets following his election victory in November 2024.
The market decline accelerated dramatically after what was termed the "Liberation Day" event, during which Trump announced plans for unprecedented tariff escalation. Two-thirds of the S&P 500's 15% decline occurred after this announcement, prompting Ed Yardeni of Yardeni Research to observe that "Liberation Day has been succeeded by Annihilation Days in the stock market".
Fear of Stagflation and Economic Instability
Many economists have warned that the new tariffs could reaccelerate inflation at a time when economic growth may be slowing, creating conditions for stagflation. This combination is particularly concerning for investors, as it creates a challenging environment for corporate profitability and economic prosperity. The risk that tariffs could trigger this economic condition has effectively neutralized investor optimism regarding other aspects of Trump's agenda, including potential regulatory reforms and tax reductions.
Shift in Market Sentiment
The market has undergone a fundamental transformation in sentiment from the period immediately following Trump's election victory to the current environment. Initially, investors had bid stocks up to record highs, anticipating benefits from tax cuts, deregulation, and business-friendly policies. However, this optimism has been replaced by growing concern about economic direction.
As one market strategist noted, "We have witnessed a significant shift in sentiment. A lot of strategies that previously worked are now failing". The S&P 500 has relinquished all gains made since Trump's November 2024 election victory, representing a striking reversal in market confidence.
Potential Long-Term Implications
Historical Patterns and Future Outlook
Historical analysis suggests that poor market starts during presidential transitions often foreshadow continued challenges. According to SunDial Capital Research strategist Jason Goepfert, rough starts represent a "bad omen" for stocks based on past performance patterns. His analysis indicates that markets typically show a median return of -1.9% six months after such a start, and after a year, they generally remain flat. Among similar historical instances, only four out of ten cases resulted in more gains than losses over the following year.
Administration's Response to Market Decline
Unlike during his first term, when Trump regularly referenced strong stock market performance as evidence of his administration's success, his second-term approach appears markedly different. Some market analysts have noted that "The Trump administration appears to be more accepting of the market's decline, potentially even welcoming a recession to achieve their broader objectives". This shift in attitude has further unsettled investors who previously expected the administration to prioritize market stability.
Technical challenge
The tech-heavy Nasdaq Composite index has recently soared 12% for its best day since January 2001.
But did you know what happened next in 2001? The major upside trend as well as 5-years SMA were shortly broken and market printed extra 40 percent Bearish decline.
Similar with what's happening in 2025..!? Exactly!
Conclusion
Trump's second presidential term has coincided with one of the worst stock market starts in modern American history, comparable only to George W. Bush's entry during the dot-com crash of 2001.
The approximately 15% market decline since inauguration represents a loss of trillions in market value and a complete reversal of the optimism that followed his election. Trade policy uncertainty, particularly regarding tariffs, has emerged as the primary driver of market instability, creating fears of potential stagflation and undermining business confidence.
As historical patterns suggest that poor starts often lead to continued underperformance, investors remain concerned about the market's trajectory through the remainder of 2025 and beyond.
--
Best 'a bad omen' wishes,
Your Beloved @PandorraResearch Team 😎

Nasdaq insights: 10-APRIL-2025Rise and shine, traders! Start your day with actionable Nasdaq insights. Let's grow your skills together, one chart at a time.

Today analysis for Nasdaq, Oil, and GoldNasdaq
The Nasdaq closed with a sharp surge following news of a possible delay in Trump’s tariff implementation. A 12% single-day rally on the daily chart is unprecedented — it was an extraordinary rise. On the daily chart, the 20-day moving average is acting as resistance, and to fully fill the April 3rd gap-down, the index would need to rise to around 19,750. If the Nasdaq continues to climb and fills that gap, a potential pullback should be anticipated.
Although the MACD has turned sharply upward in a V-shape, it hasn't fully broken above the Signal line yet. Given the rapidly changing global conditions, the possibility of a reversal still exists. However, since the 90-day tariff delay has been confirmed, the market may be entering a phase of relative stability. On the weekly chart, we see a sharp rebound that has brought the index up to the 5-week moving average. Both the Nasdaq and the VIX suggest that today could be a range-bound (sideways) session, so it's better to set wider trading ranges and adopt a box-range trading strategy.
On the 240-minute chart, a double bottom pattern has formed, with the MACD bouncing off the Signal line and rising again. The MACD is trending upward, but the Signal line remains below the zero line, which means a short-term pullback could still occur. Overall, it is advisable to use a buy-low, sell-high approach, with more upside potential still open. Also, today’s CPI report is scheduled, so please be mindful of increased volatility around the data release.
Crude Oil
Crude oil rebounded sharply from the $55 level, showing an impressive 12% range between high and low. However, the sell signal remains active. The price has broken above the 5-day moving average and entered a box range between the 5- and 10-day MAs, suggesting that a moving average-based box strategy would be effective.
On the weekly chart, oil has not yet reached the 5-week MA, so there’s still room up to the $65 level, which has historically served as strong resistance. Around that area, it might be more effective to consider short positions. On the 240-minute chart, the MACD showed signs of a third wave down, but failed to make a new low — signaling bullish divergence. A head-and-shoulders inverse pattern may be forming, with the right shoulder potentially developing around the $59–$60 zone. Overall, the strategy should remain range-based, with some more room to the upside.
Gold
Gold also closed sharply higher, benefiting from the tariff delay news. On the daily chart, the price closed higher, giving the illusion of a support bounce off the lower Bollinger Band, as that band is rising. The MACD remains above the zero line, so there’s still room for a retest of the Signal line, but given the current gap between MACD and Signal, the price needs to either rise further or move sideways to bring the MACD closer and potentially break above the Signal line.
If it fails to rise from here, the MACD may turn down again, so avoid chasing the price upward. Like Nasdaq and oil, gold is heavily influenced by global developments, so stay updated on the geopolitical landscape. On the 240-minute chart, gold formed a triple bottom around the 2,980 level and then rebounded strongly. The MACD is trending upward and pulling the Signal line along with it, but resistance around the 3,130 level remains significant. Gold may see increased volatility from today’s CPI report and tomorrow’s PPI release, so stay alert.
Market Summary
The market has been showing signs of irrational behavior. Investor sentiment is extremely volatile and driven more by emotion than logic. In times like this, it’s more important than ever to stick to the basics, shorten trade duration, cut back on risk, and trade with discipline. The more you chase after gains, the more likely your trades will be swept away by market turbulence.
Warren Buffett is considered a legend in the financial markets precisely because he has always stuck to fundamental principles. Likewise, it is crucial to establish and stick to your own trading principles to survive in the markets. If you haven’t yet experienced the kind of volatility we saw during the Trump era or the pandemic, this is a time to be especially cautious and defensive in your approach.
Wishing you another day of successful trading
If you like my analysis, please follow me and give it a boost!
For additional strategies for today, check out my profile. Thank you!

Today analysis for Nasdaq, Oil, and GoldNasdaq
The Nasdaq closed lower after forming an upper wick at the 5-day moving average on the daily chart. If it had closed with a bullish candle, a technical rebound from the oversold condition could have opened the way to the 10-day moving average, but instead, it ended with a bearish candle.
The daily chart still shows a sell signal, but the best-case scenario would be for the market to form a double bottom pattern after confirming a short-term low and attempt another rise toward the 10-day moving average.
On the intraday charts, there's a high probability that the market will show a double bottom during the pre-market session, especially since there's no clear sell reversal on lower timeframes yet. The 240-minute chart shows a golden cross on the MACD, and although a death cross hasn't yet occurred, the large gap between the MACD and the zero line suggests a continued corrective trend.
As long as the death cross doesn't materialize, buying on dips near the bottom remains favorable. The 16,500 level is a strong support zone on the monthly, weekly, and daily charts, so shorting is not recommended — better to lean toward long setups. With the FOMC minutes due out early tomorrow and the CPI report on the horizon, volatility is expected to rise as the market attempts to form a bottom. Stick to buying on dips, manage risk carefully, and reduce leverage in this volatile environment.
Crude Oil
Crude oil closed lower, continuing its recent downtrend on the daily chart. Concerns over a global economic slowdown and increased production from OPEC nations are dampening the upside. Although the sell signal on the daily MACD remains, there's still potential for a short-term rebound toward the 5-day moving average. If trading short, make sure to set a stop-loss, especially near the strong $57 support zone, where shorting is riskier.
On the 240-minute chart, the MACD has re-crossed into a death cross, showing signs of a third wave of selling pressure. However, there's still a chance of bullish divergence, so avoid chasing short positions. The $57–$59 support range remains strong, and unless this level breaks, buying on dips offers a more favorable risk-reward ratio. Note that today's U.S. crude inventory report could introduce more volatility, so trade carefully.
Gold
Gold closed lower with an upper wick on the daily chart. While the price is still above the 0 line on the MACD, if it pulls back to the previous high resistance area, which coincides with the lower Bollinger Band and the 60-day moving average, it may present a good buying opportunity for swing trades. On the weekly chart, gold is still moving within a sideways range, trapped between key moving averages. With the FOMC minutes today and the CPI tomorrow, it's important to monitor whether the price breaks out of this range.
The 240-minute chart shows that the MACD has not yet formed a golden cross, and there's still a large gap from the 0 line. If MACD rebounds and then corrects again, it's crucial to check whether a double bottom around the 2,980 area is forming. Overall, gold remains a buy-the-dip candidate, and if the price falls to around the 60-day moving average, it could present a great swing entry.
Investor sentiment is reaching extreme levels, and we're witnessing unusually fast and wide price swings. It's hard to rely on daily or weekly charts alone, so it's important to focus on short-term price action and use appropriate leverage for your strategy.
The market will always be open. Survival and consistent profitability are what matter most in the long run. Stay disciplined, manage risk carefully, and take a long-term view as a trader.
Wishing you another day of successful trading!
If you like my analysis, please follow me and give it a boost!
For additional strategies for today, check out my profile. Thank you!

Nasdaq market analysis: 09-APRIL-2025Good morning, traders! Welcome to today's Nasdaq market analysis. Compare my price action insights with your own charts and enhance your trading skills.

Island Bottom CONFIRMED on $QQQ IF we GAP up tomorrow!Island Bottom CONFIRMED on NASDAQ:QQQ IF we GAP up tomorrow!
I only believe we GAP up tomorrow IF there is news of China coming to the negotiation table with the U.S after they have raised the Reciprocal Tariffs to 104%.
If this doesn't happen then this isn't confirmed and we see a retest of $400 IMO!
I'm not playing this as a trade until we get confirmation! Too dangerous!
Not financial advice

Nasdaq-100 H1 | Potential bullish bounceNasdaq-100 (NAS100) is falling towards a swing-low support and could potentially bounce off this level to climb higher.
Buy entry is at 17,407.64 which is a swing-low support that aligns close to the 50.0% Fibonacci retracement.
Stop loss is at 17,000.00 which is a level that lies underneath an overlap support and the 61.8% Fibonacci retracement.
Take profit is at 18,238.84 which is a swing-high resistance.
High Risk Investment Warning
Trading Forex/CFDs on margin carries a high level of risk and may not be suitable for all investors. Leverage can work against you.
Stratos Markets Limited (www.fxcm.com):
CFDs are complex instruments and come with a high risk of losing money rapidly due to leverage. 63% of retail investor accounts lose money when trading CFDs with this provider. You should consider whether you understand how CFDs work and whether you can afford to take the high risk of losing your money.
Stratos Europe Ltd (www.fxcm.com):
CFDs are complex instruments and come with a high risk of losing money rapidly due to leverage. 63% of retail investor accounts lose money when trading CFDs with this provider. You should consider whether you understand how CFDs work and whether you can afford to take the high risk of losing your money.
Stratos Trading Pty. Limited (www.fxcm.com):
Trading FX/CFDs carries significant risks. FXCM AU (AFSL 309763), please read the Financial Services Guide, Product Disclosure Statement, Target Market Determination and Terms of Business at www.fxcm.com
Stratos Global LLC (www.fxcm.com):
Losses can exceed deposits.
Please be advised that the information presented on TradingView is provided to FXCM (‘Company’, ‘we’) by a third-party provider (‘TFA Global Pte Ltd’). Please be reminded that you are solely responsible for the trading decisions on your account. There is a very high degree of risk involved in trading. Any information and/or content is intended entirely for research, educational and informational purposes only and does not constitute investment or consultation advice or investment strategy. The information is not tailored to the investment needs of any specific person and therefore does not involve a consideration of any of the investment objectives, financial situation or needs of any viewer that may receive it. Kindly also note that past performance is not a reliable indicator of future results. Actual results may differ materially from those anticipated in forward-looking or past performance statements. We assume no liability as to the accuracy or completeness of any of the information and/or content provided herein and the Company cannot be held responsible for any omission, mistake nor for any loss or damage including without limitation to any loss of profit which may arise from reliance on any information supplied by TFA Global Pte Ltd.
The speaker(s) is neither an employee, agent nor representative of FXCM and is therefore acting independently. The opinions given are their own, constitute general market commentary, and do not constitute the opinion or advice of FXCM or any form of personal or investment advice. FXCM neither endorses nor guarantees offerings of third-party speakers, nor is FXCM responsible for the content, veracity or opinions of third-party speakers, presenters or participants.

Today analysis for Nasdaq, Oil, and GoldNasdaq
The Nasdaq closed lower after experiencing extreme volatility the previous day. Following a gap-down open, the market attempted a bottoming process. However, the spread of fake news related to tariffs triggered a 10% intraday swing, making the Nasdaq trade more like an individual stock than a major index. Massive trading volume occurred due to margin calls from CFDs and hedge funds, and the market showed some signs of recognition around a potential short-term bottom.
On the weekly chart, the index rebounded but was resisted at the 3-week moving average. On the daily chart, a doji bullish candlestick with strong volume formed, suggesting the market may attempt another rebound. However, since volatility from the bottom remains significant, if you’re planning to enter long positions, it's best to buy as close to the bottom as possible. If the market continues to form a base, a rebound toward the 5-day or 10-day moving average on the daily chart is possible.
On the 240-minute chart, the market is still in a death cross and remains oversold. Still, it's showing signs of forming a base around the 16,500 level, so it's better to avoid chasing short positions during any pullbacks that could form a double bottom. In this oversold environment, a buy-on-dip approach near the lows is favorable for a technical rebound. But since volatility remains high, make sure to set clear stop-loss levels for both long and short trades.
Crude Oil
Crude oil experienced a gap-down on the daily chart and closed lower after hitting resistance at the 3-day moving average. On both the daily and weekly charts, the $57–$59 zone appears to be a short-term support level. If the price dips into this zone, it may offer a buying opportunity. Yesterday’s candle was resisted at the 3-day line, so if a bottoming pattern forms today, a rebound toward the 5-day moving average could be anticipated. However, since the MACD has just issued a sell signal near the zero line, it's better to treat any long positions as short-term trades.
On the 240-minute chart, the sell signal is still valid, and the market remains in oversold territory. Watching for a potential double bottom formation before entering long positions is recommended. That said, if market sentiment continues to accept economic recession as a given, oil prices could keep falling. There's also the risk of a one-way downward move, so if you're going long, ensure tight stop-loss levels are in place.
Gold
Gold saw sharp volatility and closed lower after being rejected at the 5-day moving average. Due to the weaker dollar from U.S. tariff announcements, the attractiveness of gold has diminished in the short term. On the weekly chart, gold is still forming a range-bound movement near the 10-week moving average, with support appearing near the $2,975 level. On the daily chart, the lower Bollinger Band and the 60-day moving average are rising and beginning to converge.
These overlapping indicators could form a strong support zone, so if the price drops into this area, it may present a good opportunity to buy the dip. On the 240-minute chart, the MACD and signal lines have both dropped below the zero line, and the RSI has entered oversold territory.
While this could lead to further accelerated selling, it is also a zone where a rebound from oversold conditions could easily occur. It’s best to avoid chasing the downside and instead focus on buying during pullbacks near strong support zones.
Market volatility is increasing, but this is also a zone where technical rebounds are likely due to excessive declines. While confirmation of a bottoming pattern is needed, in this kind of market, it's safer to focus on one direction rather than trying to trade both ways.
Long positions currently offer a better risk-reward ratio, so it’s advisable to enter at the lower end of the range. Reduce leverage as much as possible and always set stop-loss levels to ensure safe trading in these turbulent conditions.
If you like my analysis, please follow me and give it a boost!
For additional strategies for today, check out my profile. Thank you!

Nasdaq trading insights: 08-APRIL-2025Nasdaq trading insights: Not signals, but informative zones to aid your decision-making. Please note: These zones are not trading advice. Use them as a starting point for your own analysis.

Nasdaq 100 drops to its lowest level since January 2024Nasdaq 100 drops to its lowest level since January 2024
According to the chart of the Nasdaq 100 (US Tech 100 mini on FXOpen), the index opened this week around the 16,500 mark – a price level last seen in early 2024.
This suggests that the sharp sell-off in equities seen last Thursday and Friday may well continue today.
Stock indices respond to Trump’s tariffs
Treasury Secretary Scott Bessent said on NBC News’ Meet the Press that there is “no reason” to expect a recession.
However, equity charts reflect market sentiment described by CNN Business’s Fear & Greed Index as “extreme fear”. This wave of negativity followed President Trump’s announcement on 2 April of harsher-than-expected international trade tariffs. In response, China and other nations announced retaliatory measures.
As a result, the Nasdaq 100 (US Tech 100 mini on FXOpen) now trades roughly 25% below its 2025 peak – officially entering bear market territory.
Technical analysis of the Nasdaq 100 (US Tech 100 mini on FXOpen)
Back on 28 February, we drew an ascending trendline (line A). Bulls attempted a rebound from this support (as shown by the arrow), but their efforts were overwhelmed by the White House’s latest policy decisions.
Given the updated price action, we can now treat line A as the median of an ascending channel. From this perspective, the index is currently near the lower boundary of the channel.
Technically, this could indicate potential support. However, as long as the price remains below the bearish gap – which includes the key psychological level of 17,000 – talk of a meaningful recovery may be premature.
This article represents the opinion of the Companies operating under the FXOpen brand only. It is not to be construed as an offer, solicitation, or recommendation with respect to products and services provided by the Companies operating under the FXOpen brand, nor is it to be considered financial advice.

Is This a Bear Market or a Golden Opportunity?The indices have plummeted sharply, and whether you believe this is due to Trump’s tariffs or would have happened anyway, regardless of the trigger, the reality remains the same.
Both the S&P 500 and Nasdaq 100 are officially in bear market territory— defined by a decline of more than 20% from their peaks . Meanwhile, the Dow Jones Industrial Average is down approximately 15%.
Given these facts, the big question is: Are we in a bear market, or is this a fantastic buying opportunity? 📉📈
Now, let's break down the key levels, potential scenarios, and how to approach the current market environment. 🚀
Dow Jones 30 (DJI): Navigating Key Support and Resistance Levels
On the weekly chart, DJI has been in an uptrend since the pandemic lows of 2020. The double top formation from 45k measured target has already been exceeded, and the index is now approaching a critical confluence support zone between 37k and 37,700.
📌 My Outlook:
• I believe this support will hold in the near future, presenting a buying opportunity.
• Resistances: 40k and 41,600 are important technical levels and potential targets for bulls.
💡 Alternative Scenario:
• If DJI starts rising without testing the long-term confluence support, I will focus on selling opportunities, particularly around the 41,500 zone, as we have 2 unfilled gaps from last week.
________________________________________
S&P 500 (SPX): Bear Market Territory, But Still Holding Uptrend (posted main chart)
According to classical theory, SPX is now officially in bear market territory. However, we are still above the ascending trend line established from the 2020 pandemic low, and approaching a confluence support zone around 4,820 - 4,900.
📌 My Outlook:
• I will be looking for buying opportunities if the index continues its decline towards the 4,820 - 4,900 zone next week.
• Target: Filling the first gap at 5,400.
💡 Alternative Scenario:
• If the week begins positively, and SPX doesn’t reach the 4,900 support zone, I will focus on shorting opportunities on gap filling, aiming for a return to 5,000.
________________________________________
Nasdaq 100 (Nas100): Hovering Above Key Support
Unlike DJI and SPX, Nas100 is still well above the ascending trend line from the 2020 pandemic low. However, it is nearing an important horizontal support defined by the 2021 ATH and the 2024 lows.
📌 My Outlook:
• Drops towards 17k or slightly lower could present good buying opportunities, anticipating a potential rise to fill the gaps.
💡 Alternative Scenario:
• If the price rises above 18.500k zone without dipping under 17k I will look for selling opportunities.
Disclosure: I am part of Trade Nation's Influencer program and receive a monthly fee for using their TradingView charts in my analyses and educational articles.
