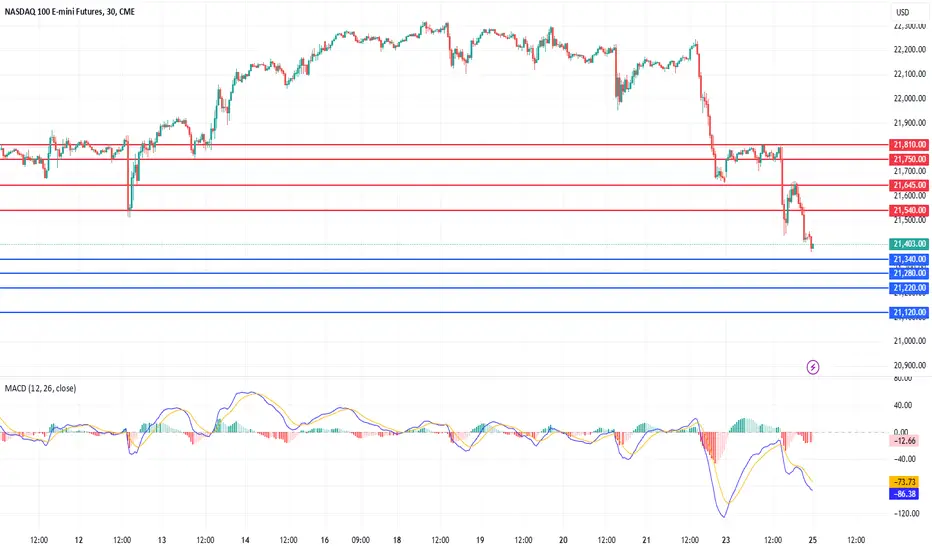
Nas100 Correction: Why a Drop Below 20K is LikelySince reaching its recent all-time high of 22,232, the PEPPERSTONE:NAS100 has dropped 1,000 points. While this might seem like a significant decline, it actually represents less than a 5% correction—hardly a major pullback.
This drop has brought the index into a key confluence support zone, raising the common question: Is the correction over?
In my opinion, it’s not. For a healthy correction, a dip below 20,000 is necessary.
Technical Perspective
🔹 Since the "bullish" event marked by Trump’s election, the index hasn’t made substantial progress. While it has technically risen, the gains have been marginal, suggesting more distribution than true bullish strength.
🔹 The index remains confined within a large rising wedge, as seen on the chart. This type of structure often signals topping and potential reversal rather than sustainable upside momentum.
What’s Next?
In the medium term, I expect a drop below 20,000. For traders looking to speculatively trade the Nas100, potential sell zones would be around 22,000 and 23,000— in the event of a new all-time high.
Nasdaq100

Nasdaq trading insights: 27-Feb-2025Nasdaq trading insights: Not signals, but informative zones to aid your decision-making. Please note: These zones are not trading advice. Use them as a starting point for your own analysis.

OUR SMALL TRADE TODAY ON NASDAQMy students and I earlier took this small trade on NASDAQ which was what we had for the day, as you can see, we entered based on the daily opening range and the FVG to target the LQ.
For any questions, the comment section is all yours!
Follow for more!

TESLA: Tesla sales fall by 50% in Europe! Fear ??
Tesla vehicle sales in the European Union fell by 50.3% in January 2025, compared to the same month last year, according to figures published on Tuesday by the European Automobile Manufacturers Association (ACEA). Specifically, the company sold 7,517 units in the first month of this year, compared to 15,130 vehicles in January 2024, according to EFE.
This drop contrasts, however, with a 34% increase in the purchase of electric vehicles in the EU, up to 124,341 units, so that this type of vehicle represented 15% of the automobile market.
In global terms, new vehicle registrations fell by an average of 2.6% in the community market, with the largest declines recorded in France (-6.2%), Italy (-5.8%) and Germany (-2.8%). Spain, however, was the only one of the four major EU economies in which new vehicle registrations increased, specifically by 5.3%.
--> What is the company's technical aspect?
If we look at the daily graph, the medium-long term trend is still bullish (Bull), but it is in a phase of decline that began on December 17 when it reached highs in the 488 area.
Yesterday, the shares plummeted by -8% due to the news of vehicle sales in Europe, reaching the KEY ZONE of 299 (61.8% Fibonacci + most important dynamic support). From this area, it is MOST LIKELY that there will be an upward rebound, but until this rebound is consolidated and the STRENGTH AND MOMENTUM turn bullish (Bull), the retracement phase will remain active.
--> Which area could be good for entering long positions?
If the price exceeds 383 with the H4 close, we could confirm the end of the retracement and the beginning of a new bullish impulse on the way to highs.
-------------------------------------
Strategy to follow:
ENTRY: We will open 2 long positions if the H4 candle closes above 383
POSITION 1 (TP1): We close the first position in the 429 area (+12%)
--> Stop Loss at 349 (-9%).
POSITION 2 (TP2): We open a Trailing Stop type position.
--> Initial dynamic Stop Loss at (-9%) (coinciding with the 899 of position 1).
--> We change the dynamic Stop Loss to (-1%) when the price reaches TP1 ( 429 ).
-------------------------------------------
SET UP EXPLANATIONS
*** How do we know which 2 long positions to open? Let's take an example: If we want to invest 2,000 euros in the stock, what we do is divide that amount by 2, and instead of opening 1 position of 2,000, we will open 2 positions of 1,000 each.
*** What is a Trailing Stop? A Trailing Stop allows a trade to continue gaining value when the market price moves in a favorable direction, but automatically closes the trade if the market price suddenly moves in an unfavorable direction by a certain distance. That certain distance is the dynamic Stop Loss.
-->Example: IF the dynamic Stop Loss is at -1%, it means that if the price drops by -1%, the position will be closed. If the price rises, the Stop Loss also rises to maintain that -1% on increases, therefore, the risk is increasingly lower until the position becomes profitable. In this way, very solid and stable price trends can be taken advantage of, maximizing profits.

Nasdaq market analysis: 26-Feb-2025Good morning! Here's your daily Nasdaq market analysis. Learn, grow, and trade wisely.

Today analysis for Nasdaq, Oil, and GoldNasdaq
The Nasdaq closed lower, continuing its selling pressure. The index quickly dropped to the lower boundary of a large range, touching the 120-day moving average. The daily MACD has formed a bearish crossover with the signal line, confirming the downtrend, and the index has now reached a potential support zone near previous lows. Yesterday provided a short opportunity at the 5-day moving average, and since there was no meaningful rebound, the gap between price and the 5-day MA has widened significantly. This suggests that a short-term technical bounce could occur based on intraday movements.
However, given the strong selling momentum on the daily chart, even if the market consolidates for a few days, further downside remains likely. If considering long positions, strict stop-loss management is essential. On the 240-minute chart, selling pressure continues to dominate, with both the MACD and signal line dropping sharply below the zero line. Comparing this to past price action near 20,763, the current MACD decline is even steeper, meaning that even if a short-term bounce occurs, the MACD is unlikely to recover back above zero easily. Overall, selling into rallies remains the preferred strategy, but traders should watch for intraday bottoming signals, as a bounce toward the 5-day MA is possible.
Crude Oil
Crude oil closed lower, weighed down by concerns over slowing consumer demand. On the daily chart, the sell signal remained intact, and the break below $70 has now confirmed a potential breakdown. Since $70 had been a key support/resistance level, the break below it suggests further downside risk. Today, a shorting opportunity may arise at the 3-day moving average, in line with technical retracement principles. However, the $66–67 range remains a strong support zone, so traders should monitor whether selling pressure is strong enough to push prices below this area. Since the MACD is turning sharply downward, and price action is forming a large bearish candle, the best strategy remains shorting into rallies near the 3-day MA.
On the 240-minute chart, a third bearish wave has developed, leading to an accelerated decline. Aside from potential buying at key support levels on the daily chart, selling into rallies remains the most favorable approach. Given that inventory data will be released today, traders should be cautious of increased volatility.
Gold
Gold closed sharply lower, forming a large bearish candle as the Consumer Confidence Index fell. Yesterday, gold was at a crossroads between a buy and sell signal, and with this bearish breakout, the sell signal is now confirmed. For now, gold is likely to trade within a broad range, as the daily MACD and signal line remain widely separated from the zero line. This suggests that while further downside is possible, periodic rebounds should also be expected.
Since gold has now fallen below the 10-day moving average and reached the 20-day MA, traders should treat the 3-day, 5-day, and 10-day MAs as key resistance levels, while the 20-day, 30-day, and 60-day MAs serve as support levels. On the 240-minute chart, the MACD has dropped below zero, with the signal line following downward. This reinforces a range-bound trading strategy, focusing on buying at major support levels while keeping in mind potential rebounds.
By analyzing the daily candles, traders can identify potential future scenarios for Nasdaq, oil, and gold. This is why daily and intraday technical analysis is essential. Additionally, NVIDIA’s earnings report will be released tonight, which could introduce further market volatility. Stay disciplined, manage risk carefully, and have a successful trading day!
If you like my analysis, please follow me and give it a boost!
For additional strategies for today, check out my profile. Thank you!

Tesla Stock Goes 'Interesting', Ahead of Earnings CallTesla is preparing to release its fourth-quarter earnings report on January 29, 2025, and analysts are closely watching the stock as it approaches this key event.
Here are some important points regarding Tesla's current stock situation and what to expect:
Current Stock Performance
Tesla shares have seen a 10% increase in 2025, but recently experienced a more than 5% decline, trading at Monday's pre-marker below $400, approximately $395.
The stock's valuation is considered high, with some analysts stating it is "priced for perfection," indicating that any earnings miss could lead to a significant pullback.
Earnings Expectations
Analysts forecast earnings per share (EPS) of 72 cents and revenue of $27.23 billion for the fourth quarter.
Gross profit margins are expected to widen slightly to 18.85%.
Key Factors Influencing Stock Valuation
👉 Delivery Performance. Tesla's deliveries were slightly below expectations in 2024, with 1.79 million units delivered, compared to 1.81 million in 20231. Investors will be keenly interested in guidance for 2025, especially with increasing competition from Chinese manufacturers like BYD and NIO.
👉 New Vehicle Launches/ The anticipated launch of the smaller SUV, referred to as the Model Q, is expected later this year, which could impact Tesla's growth trajectory.
👉 Technological Developments. Progress in autonomous driving software and energy generation will also be focal points during the earnings call.
👉 The company aims to launch its Level 3 Full Self-Driving software in specific U.S. states and expand its energy storage business.
Analyst Sentiment
There is a mix of opinions among analysts; while some maintain a cautious stance due to potential delivery shortfalls and market competition, others see Tesla as a strong buy-and-hold investment for the long term.
The average price target among analysts is around $345.11, suggesting a potential downside from current levels.
Technical Sentiment
Technical graph indicates on epic upside channel breakthrough, as a result of China DeepSeek AI model influence.
Ahead of Tesla Earnings Call our "super-duper" Team is Bearishly calling to $300 per Tesla share, that is correspond to major current support of 125-day SMA.
Conclusion
As Tesla approaches its earnings report, investors should remain vigilant about delivery numbers and guidance for the upcoming year. The stock's high valuation combined with competitive pressures makes it susceptible to volatility based on the forthcoming financial results.

TP FILLED ON NASDAQMinutes ago, I posted to sell NASDAQ targeting the 4H LQ, and the market filled our target.
Follow for more!

SELL NASDAQToday we entered in a bearish position on NASDAQ in which we're trgeting the 4H LQ
I don't post at the same time we enter since I share it to my students.
Follow for more!

NKE, Long, 1D✅ NKE has clearly broken the key resistance with strong volume and a positive delta, confirming bullish momentum. The price is now heading toward the next key resistance at 84.00
LONG 🚀
✅ Like and subscribe to never miss a new analysis! ✅

Today analysis for Nasdaq, Oil, and GoldNasdaq
The Nasdaq closed lower following news that Microsoft is reducing its data center leasing. This week, the weekly chart suggests strong selling pressure, meaning long positions should be approached with caution.
On the daily chart, yesterday’s bearish candle confirmed the MACD sell signal, though the signal line remains above the zero line. In a broader context, a potential bounce could occur near key technical levels, including the lower Bollinger Band, 120-day moving average, and previous resistance zones.
Two days ago, a large bearish candle formed, and yesterday’s price action provided an opportunity to sell at the 3-day moving average. However, the market failed to test the 3-day MA during pre-market, leading to a false impression that the daily close was rejected at resistance. This illustrates how a daily close can sometimes be misleading, reinforcing the need to plan for alternative scenarios.
Since selling was executed at the 3-day MA yesterday, today’s key resistance level shifts to the 5-day moving average. Given the wide gap between price and the 5-day MA, a short-term rebound toward this level is possible.
On the 240-minute chart, both the MACD and signal line have moved below the zero line, confirming continued selling pressure. However, since the Nasdaq has now entered a key support zone from a previous range, a short-term bounce toward the 5-day MA is possible. Traders should be cautious with short positions and focus on range-bound strategies rather than chasing downside momentum.
Crude Oil
Crude oil gapped down but managed to close higher. Despite the ongoing MACD sell signal on the daily chart, oil held above the key $70 support level.
This week’s weekly close is critical—if oil can end the week with a bullish candle, it could set the stage for a potential reversal. Holding above $70 remains the key technical factor, as a breakdown below this level would signal further downside.
On the daily chart, if the market fails to extend lower and instead rebounds, a MACD double-bottom pattern could develop, reinforcing potential upside momentum. However, since market flows remain mixed, it is best to treat oil as range-bound until a decisive break occurs.
On the 240-minute chart, both the MACD and signal line are below the zero line, but price action is attempting a temporary rebound. While selling into rallies remains the preferred approach, traders should be cautious of event-driven volatility, as news developments could trigger sudden moves.
The $70 level remains the key downside level to monitor—if it breaks, selling pressure could intensify. Risk management is crucial when taking long positions.
Gold
Gold briefly made new highs before closing flat within its range. On the daily chart, the buy signal remains intact, but today’s session will be crucial in determining whether gold can sustain its momentum or enter a consolidation phase.
The key factor to watch is whether gold finds support at the signal line and continues higher or if a bearish crossover forms, leading to a range-bound correction.
On the 240-minute chart, a bullish MACD crossover has occurred, but for the uptrend to be confirmed, a strong breakout candle is needed. Without a significant bullish move, gold risks forming a bearish divergence, meaning that even if price breaks to new highs, the MACD may fail to confirm the move.
Since market flows remain mixed, a range-trading approach remains most effective, with a focus on buying at strong support levels and avoiding breakout trades. Traders should remain flexible and manage risk carefully, as both upside and downside scenarios remain open.
Looking at VIX futures, a strong buy signal has emerged at the zero level. Historically, VIX buy signals near zero tend to generate large price swings, suggesting that Nasdaq volatility may increase significantly. This increases the likelihood of a sharp correction, making risk management a top priority.
Stay disciplined, manage risk carefully, and wishing you a successful trading day! 🚀
If you like my analysis, please follow me and give it a boost!
For additional strategies for today, check out my profile. Thank you!
Nasdaq market analysis: 24-Feb-2025Let’s dive into today's Nasdaq market analysis. Share insights, and potentially spot opportunities for good pips.

Weekly and Monday analysis for Nasdaq, Oil, and GoldNasdaq
The Nasdaq closed lower as the Consumer Sentiment Index declined. Last Thursday, I mentioned that the weekly chart suggested continued downside potential, and with Friday’s sharp decline, the weekly MACD has once again turned strongly bearish. Since the weekly MACD failed to form a bullish crossover and has now resumed its downward trajectory, this move can be seen as a whipsaw pattern followed by renewed selling pressure.
On the daily chart, the Nasdaq has dropped to the 60-day moving average, and the MACD has crossed below the signal line, triggering a sell signal. However, since Friday’s daily candle alone does not fully confirm the sell signal, today’s price action will be key in determining whether the sell signal is fully confirmed. The market decline was primarily driven by concerns over weaker consumer spending, tariff-related inflation expectations, and broader economic uncertainty. Since a large bearish candle has formed on the daily chart, the market should be approached with a sell-biased strategy. Given the strong resistance zones, selling near the 3-day moving average upon any rebound would be an effective approach.
On the 240-minute chart, the MACD has dropped sharply, pushing the signal line below the zero level. However, a short-term bounce may occur due to oversold conditions, making it important to watch for early support levels in the pre-market session. A range-bound approach remains favorable in the short term.
Crude Oil
Crude oil closed lower, pressured by expectations of increased oil supply from Iraq. On the daily chart, a buy signal appeared on Friday, but as mentioned earlier, it was not fully confirmed. Instead, oil closed lower, leading to a failed bullish signal and renewed downward momentum in the MACD. This shift in momentum suggests that selling pressure is increasing, making it more likely that oil will struggle to sustain a bullish breakout.
On the weekly chart, the MACD has not yet crossed below the signal line, meaning that some rebound potential remains. However, if oil closes the week with a bearish candle, a weekly sell signal could be triggered. The $70 level remains a key support zone. Until $70 is broken, oil should be treated as range-bound. However, if $70 is breached, downside momentum could accelerate, making a sell-biased strategy more favorable.
On the 240-minute chart, the MACD has dropped below the zero line, while the signal line remains above it. This suggests that some support may still exist near $70, but if the signal line also drops below zero, selling pressure could intensify further. Risk management is crucial for long positions in this environment.
Gold
Gold closed flat, remaining within a range-bound market structure. On the weekly chart, the bullish trend remains intact, but the market is now in a potential correction zone. On the daily chart, the MACD and signal line are nearly converging, making today’s price action critical in determining whether gold will break higher or enter a consolidation phase.
On the 240-minute chart, gold is trading sideways at recent highs, reinforcing the range-bound nature of the market. The MACD failed to maintain bullish momentum and has started turning downward, but since it remains above the zero line, even if gold declines, it is likely to bounce back within the range. However, if the 240-minute MACD falls below zero and the signal line follows, this could trigger a sharp correction following the recent rally. Traders should watch this development closely.
This week, key events include NVIDIA earnings(Wednesday), U.S. GDP report(Thursday), PCE inflation data(Friday). As the week progresses, market volatility is expected to increase, making risk management a top priority.
Wishing you a successful trading week!
If you like detailed this analysis and today's strategy, please follow me and give it a boost!

OUR TRADE TODAY ON NASDAQToday again we caught another good trade on NASDAQ which was based on the DOR and FVG, and our target was the Liquidity.
PS: THE ENTRY SCREENSHOT WAS TAKEN ON THE 1 MIN CHART!!
Follow for more!

SHORT ON NASToday Im selling nas.
I made good money on the drop from yesterday.
Price has since pulled back into discount and tapped into supply.
News for PMI is coming out which is (expected) to be positive.
I will be selling nas this morning looking to catch at least 1000 points.

Today analysis for Nasdaq, Oil, and GoldNasdaq
The Nasdaq closed lower as Walmart’s earnings report raised concerns about slowing consumer demand. Today marks the weekly close, and since the weekly chart has not yet confirmed a buy signal, any downward movement in the MACD could increase the likelihood of further declines.
On the daily chart, the 10-day moving average is acting as support, aligning with the upper boundary of the February range. The MACD remains in a buy signal, but market flows are mixed, suggesting that choppy price action with alternating bullish and bearish candles could persist.
Until a strong breakout candle decisively clears previous highs, it is safer to treat the current market as range-bound. While the bullish bias remains, traders should monitor whether the daily MACD generates a sell signal, which could shift momentum in favor of sellers.
On the 240-minute chart, the MACD is declining sharply, indicating that buying pressure is weak. However, since the signal line is still above the zero line, a rebound attempt could emerge between 21,800 and 21,900. If the gap between the MACD and the signal line continues to widen, traders should avoid chasing long positions, even if a short-term bounce occurs.
Crude Oil
Crude oil closed higher, finding support near the $71 level. A buy signal has appeared on the daily chart, though it is not yet confirmed. The MACD and signal line have formed a golden cross, but today’s daily close will likely determine whether the buy signal holds.
If the buy signal remains valid, oil could be forming a double-bottom pattern, confirming a base before moving higher. However, given weekend geopolitical risks, holding positions over the weekend (overweekend exposure) should be approached with caution.
On the 240-minute chart, the MACD has pulled back toward the signal line before resuming an upward move, forming a wave 3 buying pattern. Since further upside momentum is possible, traders should focus on buying dips rather than chasing breakouts.
Gold
Gold closed higher after breaking above its previous high. On the daily chart, the MACD and signal line are closely aligned, meaning that if gold prints a bearish candle and breaks below the 10-day moving average, a bearish crossover (death cross) is likely.
Since the MACD and signal line are still at elevated levels above the zero line, any selloff is likely to be met with buying interest, keeping the market range-bound. However, if gold breaks below the lower boundary of the current range, a sharp sell-off could occur, making stop-loss management crucial for long positions.
On the 240-minute chart, gold has briefly broken above a triple-top formation before pulling back, forming a whipsaw pattern. This suggests that a further drop is likely.
If the MACD on the 240-minute chart crosses below the signal line, it could mark the start of a trend reversal, making this a key technical level to watch.
Overall, gold remains in a range-bound environment, but selling at highs is currently more favorable. If buying at support, stop-loss management is essential.
As we close out the weekly session, traders should focus on risk management and ensure safe trading strategies. Take the weekend to rest, recharge, and maintain a healthy balance between trading and personal life. Wishing you a successful trading day and a great weekend!
If you like my analysis, please follow me and give it a boost!
For additional strategies for today, check out my profile. Thank you!

MICROSOFT: On the way to the top of the channel!! We're in!!On Wednesday, January 29, Microsoft presented its results. Its results were better than expected in Sales, EBIT and BNA, however, the growth of Azure (cloud) disappointed and the value began to fall towards the bottom of the LATERAL channel in which it has been moving for months.
Main figures compared to the Bloomberg consensus:
Sales: 69,632 million dollars (+12%) vs. 68,903 million dollars expected.
EBIT: 31,653 million dollars (+17.1%) vs. 30,258M$ expected.
BNA: 24,108 million dollars (+10.2%) vs. 23,443M$ expected.
Within the three major segments of the company, the cloud business is slightly disappointing (growth of +31% vs. +32% expected by consensus). In addition, the management team at the earnings conference pointed out that Azure (cloud business) growth will be somewhat more moderate than expected (range +31%/+32% vs. +33% in this quarter).
--> What do we do with Microsoft?
Despite the cloud disappointment, if we have a long-term view, Microsoft is a very attractive stock to have in our portfolio.
--> What does it look like technically?
The technical aspect is BULLISH/SIDEWAYS, therefore, if we want to enter the stock, we should wait for the price to touch the bottom of the channel and give us a signal of the start of bullish momentum. AND THAT IS JUST WHAT IS HAPPENING NOW!!.
In H1 timeframe we already have bullish STRENGTH and MOMENTUM (Bull) and in H4 timeframe the MOMENTUM, therefore, we can now enter LONG in the value.
--------------------------------------
Strategy to follow:
ENTRY: We will open 2 long positions in the current area of 414
POSITION 1 (TP1): We close the first position in the 446 area (+7.5%)
--> Stop Loss at 385 (-7.5%).
POSITION 2 (TP2): We open a Trailing Stop type position.
--> Initial dynamic Stop Loss at (-7.5%) (coinciding with 385 of position 1).
--> We modify the dynamic Stop Loss to (-1%) when the price reaches TP1 (446).
-------------------------------------------
SET UP EXPLANATIONS
*** How do you know which 2 long positions to open? Let's take an example: If we want to invest 2,000 euros in the stock, what we do is divide that amount by 2, and instead of opening 1 position of 2,000, we will open 2 positions of 1,000 each.
*** What is a Trailing Stop? A Trailing Stop allows a trade to continue gaining value when the market price moves in a favorable direction, but automatically closes the trade if the market price suddenly moves in an unfavorable direction by a certain distance. That certain distance is the dynamic Stop Loss.
-->Example: IF the dynamic Stop Loss is at -1%, it means that if the price drops by -1%, the position will be closed. If the price rises, the Stop Loss also rises to maintain that -1% in the rises, therefore, the risk is increasingly lower until the position becomes profitable. In this way, very strong and stable price trends can be exploited, maximizing profits.

Actionable Nasdaq insights: 20-Feb-2025Rise and shine, traders! Start your day with actionable Nasdaq insights. Let's grow your skills together, one chart at a time.

Today analysis for Nasdaq, Oil, and GoldNasdaq
The Nasdaq closed higher within its range, finding support at the 5-day moving average. While the daily buy signal remains intact, the market showed some corrective movement following yesterday’s doji candle, with selling pressure continuing on the lower time frames.
As the index approaches previous highs, profit-taking is occurring, leading to a temporary consolidation phase. Market flows remain mixed, which could make it difficult for the Nasdaq to break through resistance decisively. However, as long as the index continues to hold the 5-day MA, the potential for a continued rally remains.
On the 240-minute chart, the sell signal remains active, and the market is consolidating within a range. Since the MACD and signal line remain above the zero line, further upside attempts are likely.
For now, a range-trading strategy—buying near support and selling near resistance—remains the most effective approach.
Crude Oil
Crude oil closed higher, breaking above the $72 level. On the daily chart, the MACD has not yet confirmed a bullish crossover, making it too early to fully confirm an uptrend.
Although oil has formed a double-bottom pattern, market flows remain mixed, and since the MACD and signal line are converging near the zero level, a strong breakout or breakdown could occur soon. Given that the weekly MACD remains in an uptrend, buying dips remains the preferred strategy.
On the 240-minute chart, the MACD and signal line have both moved above the zero line, confirming strong buying momentum. If oil breaks above the neckline at $73, a strong bullish move could follow. However, if the market fails to hold above $73, it could settle into a range-bound structure.
For now, buying on dips remains the most favorable strategy, but traders should be cautious, as today’s crude oil inventory report could introduce significant volatility.
Gold
Gold failed to break above its previous high, closing lower. The market remains in a range-bound structure, with the MACD initially turning upward but now shifting back toward the signal line.
If the MACD forms a bearish crossover, gold is likely to remain in a consolidation phase, and the next key question will be whether gold finds support at the 20-day moving average or moves even lower to test previous breakout levels.
On the 240-minute chart, the MACD is pulling back toward the signal line, showing signs of weakening momentum. Additionally, the market appears to be forming a triple-top (head-and-shoulders) pattern, meaning that if the neckline breaks, a further decline could follow.
Given these conditions, the best approach is to trade within the current range, favoring selling near highs while only considering long positions at key support levels.
Stay disciplined, manage risk carefully, and have a successful trading day! 🚀
If you like my analysis, please follow me and give it a boost!
For additional strategies for today, check out my profile. Thank you!

OUR TRADE ON NASDAQThis is our trade for today on nasdaq in which we sold and recovered the loss we made on gold and made more profits on it.
I didn't share it to public since I gave it to my students, now after the TP reached here you are watching it!
Follow us for more!

Arista Networks Dips 4% Premarket Despite Strong Q4 FinancialsArista Networks (NASDAQ: NYSE:ANET ) saw a 4% dip in premarket trading despite delivering better-than-expected revenue and earnings in its latest quarterly report. The stock's recent movement raises questions about market sentiment and potential buying opportunities.
Strong Revenue and Earnings Growth
Arista Networks, a leader in cloud networking, reported a fourth-quarter revenue of $1.93 billion, reflecting a 7% year-over-year increase. This beat analyst estimates and demonstrated the company’s ability to sustain growth even amid economic uncertainty.
Net earnings surged to $830.1 million (65 cents per share), compared to $664.3 million (52 cents per share) in the prior year. These strong financials reflect Arista’s continued dominance in the cloud networking industry, particularly as it pushes further into AI-driven initiatives.
Additionally, Arista Networks provided an optimistic forecast for the first quarter of 2024, expecting revenue between $1.93 billion and $1.97 billion, surpassing analysts' expectations. This suggests that despite short-term price volatility, the company’s long-term growth remains intact.
Market Sentiment and Analyst Ratings
Despite the positive earnings report, NYSE:ANET faced early selling pressure. However, analysts remain bullish on the stock, with an average "Buy" rating from 15 analysts. The 12-month price forecast stands at $108.38, representing a slight downside of -3.12% from the latest price, indicating that the market might already be factoring in Arista’s growth potential.
Technical Analysis
From a technical perspective, NYSE:ANET ’s premarket drop of 4.11% has placed its Relative Strength Index (RSI) at 47, signaling that the stock is approaching oversold territory but not yet at extreme levels.
Currently, the stock is trading above key moving averages (MA), suggesting that the broader uptrend remains intact. However, the dip brings NYSE:ANET close to its one-month low, a temporary support level that traders should watch closely. If selling pressure continues, a break below this level could lead to further downside.
That said, this retracement could also be a strategic move to sweep liquidity and attract demand for a potential rebound. Investors should watch for price stabilization and confirmation of renewed buying interest before making any decisive moves.
Conclusion
Despite the early sell-off, Arista Networks’ strong fundamentals, growing revenue, and positive long-term outlook position it as a solid investment choice. The recent dip may be an opportunity for traders to capitalize on a short-term pullback before the stock resumes its upward trajectory. As always, monitoring key technical levels and broader market trends will be crucial in assessing NYSE:ANET ’s next move.

Today analysis for Nasdaq, Oil, and GoldNasdaq
The Nasdaq closed flat with a doji candle, facing resistance at previous highs. As mentioned yesterday, there was a possibility of a pullback to the 5-day moving average, and while the market did not fully correct to that level, it did consolidate and pull the 5-day MA higher, suggesting a preparatory phase for further upside.
On the daily chart, the MACD and signal line remain upward-facing, indicating that buying dips remains the preferred strategy. However, since trading volume remains relatively low and market flows appear mixed, it is advisable to take profits quickly when buying dips rather than holding for extended gains.
On the 240-minute chart, a sell signal has appeared at the highs, meaning that a pullback toward the upper boundary of the previous range is possible. Given the doji candle on the daily chart, traders should be cautious about chasing longs in the pre-market session. If the MACD turns downward, selling pressure could intensify.
That said, the MACD and signal line remain well above the zero line, suggesting that rebound attempts are likely. While the sell signal remains active, short positions should be managed with strict stop-loss levels.
Tonight, the FOMC meeting minutes will be released, so be mindful of potential volatility during the regular session and after-hours trading.
Crude Oil
Crude oil closed higher, testing $72 as resistance while forming a potential double-bottom pattern. The MACD on the daily chart is approaching a key decision point, where it will either bullishly cross above the signal line or turn lower again, determining the next directional move.
Since the signal line is near the zero level, the next buy or sell signal is likely to trigger a significant price move. Additionally, the ongoing Ukraine-Russia peace negotiations remain a key geopolitical risk factor, as any developments could lead to increased oil price volatility.
From a technical perspective, oil remains within a range-bound structure, making buying dips the most effective approach. A break below $70 would be a bearish signal, while sustained movement above $72 could confirm a breakout.
On the 240-minute chart, the MACD has moved above the zero line, lifting the signal line upward. While a short-term pullback is possible, as long as the MACD does not form a bearish crossover, buying pressure could strengthen further.
Gold
Gold closed higher, rebounding from previous levels. Yesterday’s price action confirmed that the MACD used the signal line as support and turned higher, reinforcing the bullish trend.
Since the MACD has not yet crossed below the signal line, the daily chart remains in a buy-biased structure, meaning that until a confirmed bearish crossover occurs, the market should still be approached with a buy-on-dip mindset.
However, if gold moves above its previous high but the MACD fails to exceed its previous peak, a bearish divergence could form, increasing the risk of a sharp correction. Traders should remain aware of this scenario and avoid chasing long positions at elevated levels.
On the 240-minute chart, the MACD has crossed above the signal line near the zero level, generating a strong upward wave. However, the market is approaching key resistance zones, and if another rally occurs, a bearish divergence could develop, reinforcing the need for cautious positioning.
Buying at major support levels remains the safest strategy, while avoiding breakout trades is advisable.
With the FOMC meeting minutes set for release tonight, overnight positions in gold should be managed carefully due to the potential for increased volatility.
Despite high market volatility, trends remain clear across different asset classes, making trading conditions manageable. Instead of attempting countertrend trades, focus on following the prevailing trend and capitalizing on structured setups.Wishing you a successful trading day!
If you like my analysis, please follow me and give it a boost!
For additional strategies for today, check out my profile. Thank you!

NASDAQ Bullish Breakout!HI,Traders !
NASDAQ is trading in a
Local uptrend and
Made a bullish breakout of
The key horizontal level
Of 22062.4 and the breakout
Is confirmed so we will
Be expecting a further
Bullish continuation !
Comment and subscribe to help us grow !
