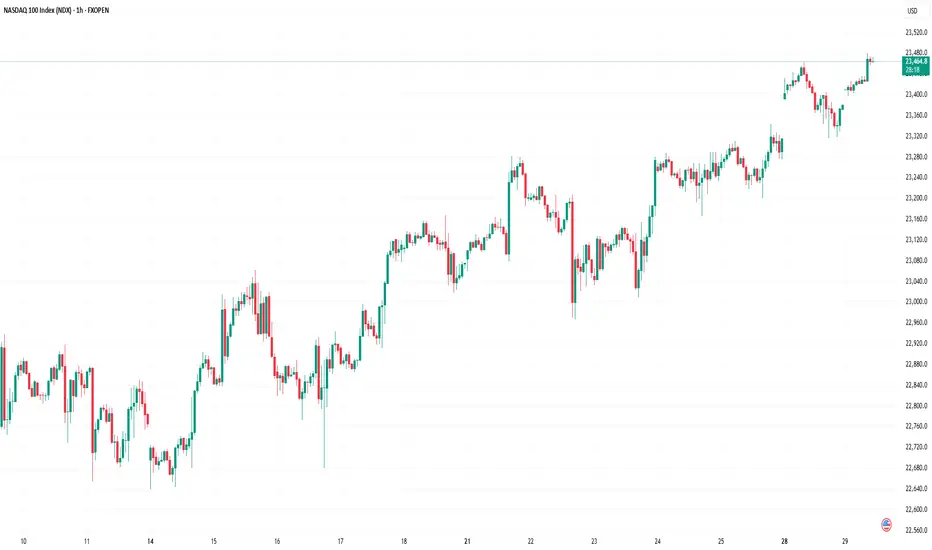
Nasdaq 100 Index Hits New Highs Ahead of Big Tech EarningsNasdaq 100 Index Hits New Highs Ahead of Big Tech Earnings
Earlier, we noted signs of optimism in the Nasdaq 100 index as the market anticipated earnings reports from major tech firms.
Now, companies such as Alphabet (GOOGL) and Tesla (TSLA) have already released their results (we previously covered their charts → here and here). Up next are the most highly anticipated earnings reports: this week, tech giants including Microsoft (MSFT), Amazon (AMZN), Meta Platforms (META), and Apple (AAPL) are set to publish their results. The combined market capitalisation of these four companies exceeds $11 trillion, and their reports could have a significant impact on a stock market that is already showing strong bullish sentiment:
→ The Nasdaq 100 index has climbed to an all-time high, surpassing the 23,400 mark.
→ The signing of trade agreements between the US and Europe (and earlier, Japan) has eased concerns about the negative impact of tariff barriers.
Technical Analysis of Nasdaq 100
The chart supports growing signs of optimism: earlier in July, the price remained within a rising channel (marked in blue). However, towards the end of the month, price action has begun to follow a steeper upward trajectory (marked in purple).
What could happen next? Much will depend on the earnings results and forward guidance from these tech giants.
On the one hand, continued enthusiasm around AI adoption could accelerate further growth. The stronger the optimism, the more fuel it may add to discussions around a potential bubble — with some analysts already drawing parallels to the dot-com era of the early 2000s.
On the other hand, earnings could temper market excitement and prompt a correction. For example, the index may retreat to the support level around 23,020, which is reinforced by the lower boundary of the blue trend channel.
This article represents the opinion of the Companies operating under the FXOpen brand only. It is not to be construed as an offer, solicitation, or recommendation with respect to products and services provided by the Companies operating under the FXOpen brand, nor is it to be considered financial advice.
Nasdaq100analysis
"NASDAQ 100 Heist – Scalp, Swing, or Hold? (Full Plan)🔥 NASDAQ 100 HEIST PLAN – BULLISH LOOT AWAITS! 🔥
🚨 Attention Market Robbers & Money Makers! 🚨
(Swing/Day Trade Strategy – High-Risk, High-Reward Play)
🎯 Mission Objective: Loot the NDX100/US100 (NASDAQ 100) Like a Pro!
Based on Thief Trading’s ruthless technical & fundamental analysis, we’re executing a bullish heist—targeting the Red Zone (high-risk, high-reward area).
⚠️ WARNING: Overbought market, consolidation zone, potential bear traps—weak bears may get slaughtered! Strong hands only!
🔐 ENTRY: The Vault is OPEN!
"SWIPE THE BULLISH LOOT!" – Any price is a steal, but smart thieves use:
Buy Limit Orders (15m-30m TF) near recent swing lows/highs.
DCA/Layering Strategy – Multiple limit orders for max loot.
Breakout Confirmation – Don’t jump in early; wait for the real move!
🛑 STOP LOSS: Protect Your Stash!
Thief’s SL Rule: Nearest 4H swing low (22,600) – WICK LEVEL ONLY!
DO NOT place SL before breakout! (Patience = Profit.)
Adjust SL based on risk, lot size, and number of orders.
🎯 TARGETS: Escape Before the Cops Arrive!
Main Take-Profit: 24,400 (or exit early if momentum fades).
Scalpers: Longs ONLY! Use trailing SL to lock in profits.
Swing Traders: Ride the wave like a true market pirate!
📰 FUNDAMENTAL BACKUP: Why This Heist Will Work
Bullish momentum in NDX100 driven by:
Macro trends (Fed, inflation, tech earnings).
COT Report & Institutional positioning.
Geopolitical & Sentiment Shifts.
Intermarket correlations (USD, Bonds, Tech Sector).
(Stay updated—markets change FAST!)
⚠️ TRADING ALERT: News = Danger Zone!
Avoid new trades during high-impact news.
Trailing SL = Your best friend.
Lock profits early if volatility spikes!
💥 BOOST THIS HEIST! 💥
👉 Hit LIKE & FOLLOW to strengthen our robbery crew!
🚀 More heists coming soon—stay tuned, thieves! 🚀

NASDAQ 100 TECH HEIST: Bullish Loot Before the Bear Trap!🚨 E-MINI NASDAQ 100 HEIST: Tech Rally or Bear Trap? (Thief Trading Blueprint) 🚨
🌟 Hola! Oi! Bonjour! Hallo! Salam! 🌟
Attention all Market Bandits & Tech Raiders! 🏴☠️💻💰
🔥 Thief Trading Intel: We're targeting the E-MINI NASDAQ 100 for a bullish loot grab! Long entry only—high-risk Red Zone ahead: overbought, consolidating, and primed for a reversal. Don’t let the bears ambush your profits!
"Claim your tech treasure and run—you’ve earned this steal!" 💰🚀
🚪 ENTRY: The Tech Vault is Open!
📈 "Swipe bullish loot at any price—the heist is LIVE!"
Buy Limit orders at recent swing lows/highs (15-30 min TF).
📌 Pro Thief Move: SET ALERTS! Don’t miss the breakout.
🛑 STOP LOSS: Escape Plan
📍 Thief SL (Smart Crew): Recent swing low (20,700.00, 4H TF).
📍 Adjust based on your risk, lot size, and orders.
🎯 TARGET: Loot & Exit!
🎯 22,600.00 (or bail early if the market flips!)
⚡ SCALPERS’ QUICK HIT
👀 Long scalps ONLY!
Deep pockets? Raid now.
Light wallet? Join swing traders.
Trailing SL = Your Profit Shield! 🛡️
📢 WHY THIS HEIST? (NASDAQ Bullish Momentum)
Tech rally brewing! Key drivers:
Fundamentals (COT, Macro, Geopolitics)
Sentiment & Intermarket Trends
Index-Specific Analysis & Positioning
🔗 Full intel? Bio linkss checkk! 👉🏻👉🏻👉🏻
⚠️ WARNING: News = Danger Zone! 📡🚨
Tech news moves FAST! Protect your loot:
❌ Avoid new trades during news.
🔒 Trailing SL = Lock profits.
💖 SUPPORT THE TECH HEIST CREW!
💥 SMASH THAT BOOST BUTTON! 💥
More boosts = bigger future heists!
Stronger crew = more $$$ for all!
Profit daily with Thief Trading Style! 📈🏆
Next tech raid coming soon—stay tuned! 🖥️🤑

Nasdaq100OANDA:NAS100USD
3. And Then price will begin to push down strong. This will happen only if there will be a very strong spike meaning an incredible amount of sells pushing the price down.

Nasdaq 100: A New All-Time HighNasdaq 100: A New All-Time High
As shown on the Nasdaq 100 chart (US Tech 100 mini on FXOpen), the value of the technology stock index has risen above its February peak, setting a new historical high.
Bullish sentiment may be supported by:
→ Easing concerns over potential US involvement in a Middle East war, as the ceasefire between Israel and Iran remains in effect.
→ Media reports suggesting that Donald Trump is considering replacing Federal Reserve Chair Jerome Powell by September or October, in an effort to influence a rate cut that could accelerate economic growth (though this also raises the risk of a new inflationary wave).
Technical Analysis of the Nasdaq 100 Chart
Price fluctuations in May and June have formed an ascending channel (highlighted in blue), with the following observations:
→ The decline (marked by red lines) appears to be an interim correction forming a bullish flag pattern;
→ The 22K level, which acted as resistance mid-month, was breached by a strong bullish impulse (indicated by the arrow) from the week's low.
This leaves the market vulnerable to a potential correction, which seems possible given:
→ Proximity to the upper boundary of the ascending channel;
→ Overbought conditions indicated by the RSI.
If the market corrects, a retest of the 22K level may happen.
This article represents the opinion of the Companies operating under the FXOpen brand only. It is not to be construed as an offer, solicitation, or recommendation with respect to products and services provided by the Companies operating under the FXOpen brand, nor is it to be considered financial advice.

Stock Markets Rise Amid US–China Trade Deal ProgressStock Markets Rise Amid US–China Trade Deal Progress
As the chart shows, the Nasdaq 100 index (US Tech 100 mini on FXOpen) formed a bullish gap at Monday’s market open and, as of this morning, is trading at its highest level since early March.
This is driven by the announcement from the Trump administration of progress in securing a trade deal with China, following weekend negotiations held in Switzerland. Treasury Secretary Scott Bessent described the two-day talks with Chinese officials in Geneva as “productive”, adding that more detailed information would be shared on Monday.
As a reminder, the US imposed tariffs of 145% on Chinese goods, to which Beijing responded with a 125% levy on American imports.
Technical Analysis of the E-mini Nasdaq 100 Chart
The chart is showing bullish signals:
→ The downward trendline (shown in orange) was broken around the 19,666 level, which has since acted as support (indicated by the blue arrow).
→ Today, the Nasdaq 100 has moved above last week’s resistance near the 20,175 level.
→ Market fluctuations are forming an upward channel (shown in blue) from the April lows, with the price currently sitting in the upper half of the channel—typically a sign of strong buying pressure.
Further updates on the US–China trade deal may reveal key details, potentially reinforcing the current bullish sentiment in the equity markets.
This article represents the opinion of the Companies operating under the FXOpen brand only. It is not to be construed as an offer, solicitation, or recommendation with respect to products and services provided by the Companies operating under the FXOpen brand, nor is it to be considered financial advice.

NQ1! "E-Mini Nasdaq 100" Index Market Bullish Robbery Plan🌟Hi! Hola! Ola! Bonjour! Hallo! Marhaba!🌟
Dear Money Makers & Robbers, 🤑 💰💸✈️
Based on 🔥Thief Trading style technical and fundamental analysis🔥, here is our master plan to heist the NQ1! "E-Mini Nasdaq 100" Index Market. Please adhere to the strategy I've outlined in the chart, which emphasizes long entry. Our aim is to escape near the high-risk Red Zone Level. Risky level, overbought market, consolidation, trend reversal, trap at the level where traders and bearish robbers are stronger. 🏆💸"Take profit and treat yourself, traders. You deserve it!💪🏆🎉
Entry 📈 : "The heist is on! Wait for the MA line breakout (20500.00) then make your move - Bullish profits await!"
however I advise to Place Buy stop orders above the Moving average (or) Place buy limit orders within a 15 or 30 minute timeframe most recent or swing, low or high level for Pullback entries.
📌I strongly advise you to set an "alert (Alarm)" on your chart so you can see when the breakout entry occurs.
Stop Loss 🛑: "🔊 Yo, listen up! 🗣️ If you're lookin' to get in on a buy stop order, don't even think about settin' that stop loss till after the breakout 🚀. You feel me? Now, if you're smart, you'll place that stop loss where I told you to 📍, but if you're a rebel, you can put it wherever you like 🤪 - just don't say I didn't warn you ⚠️. You're playin' with fire 🔥, and it's your risk, not mine 👊."
📍 Thief SL placed at the recent/swing low level Using the 4H timeframe (19600.00) Day/Swing trade basis.
📍 SL is based on your risk of the trade, lot size and how many multiple orders you have to take.
🏴☠️Target 🎯: 21500.00 (or) Escape Before the Target.
🧲Scalpers, take note 👀 : only scalp on the Long side. If you have a lot of money, you can go straight away; if not, you can join swing traders and carry out the robbery plan. Use trailing SL to safeguard your money 💰.
💰💵💸NQ1! "E-Mini Nasdaq 100" Index Market Heist (Swing Trade Plan) is currently experiencing a neutral trend there is high chance for bullishness,., driven by several key factors. .☝☝☝
📰🗞️Get & Read the Fundamental, Macro economics, COT Report, Geopolitical and News Analysis, Sentimental Outlook, Intermarket Analysis, Index-Specific Analysis, Positioning and future trend targets with Overall Score..... go ahead to check👉👉👉🔗🔗🌎🌏🗺
⚠️Trading Alert : News Releases and Position Management 📰 🗞️ 🚫🚏
As a reminder, news releases can have a significant impact on market prices and volatility. To minimize potential losses and protect your running positions,
we recommend the following:
Avoid taking new trades during news releases
Use trailing stop-loss orders to protect your running positions and lock in profits
💖Supporting our robbery plan 💥Hit the Boost Button💥 will enable us to effortlessly make and steal money 💰💵. Boost the strength of our robbery team. Every day in this market make money with ease by using the Thief Trading Style.🏆💪🤝❤️🎉🚀
I'll see you soon with another heist plan, so stay tuned 🤑🐱👤🤗🤩

Bullish Breakout on NAS100 – Momentum ShiftingNASDAQ 100 (US100) – Bullish Setup Developing
1. Falling Wedge Breakout:
Price has broken out of the falling wedge (purple trendlines), signaling a potential reversal to the upside.
2. Retesting Breakout Zone:
Current price action is retesting the breakout level near the 18,000 zone, indicating potential support forming.
3. Trendline Confluence:
The breakout aligns with the lower boundary of the broader ascending channel (blue), acting as dynamic support.
4. Strong Bullish Rejection at Lows:
Price showed strong buying interest near 17,700, forming a bullish rejection wick and bounce.
5. Clean Target Ahead:
Next key resistance zone lies around 18,540, where price may face selling pressure again – this matches previous structure and descending channel resistance.
6.Momentum Shift Noted:
Lower highs and lower lows structure has been invalidated, hinting at a possible trend shift.
Thanks for your Time..

Nasdaq 100 Opens with Bullish GapTrump Exempts Electronics from Tariffs; Nasdaq 100 Opens with Bullish Gap
Despite the weekend, the news flow remained intense amid the escalating trade war. According to media reports:
→ Certain tech products, including those made by Apple, have been exempted from Trump’s tariffs.
→ Trump announced he would make a significant statement regarding semiconductor tariffs on Monday, 14 April.
Stock Indices React to Trump’s Tariff Moves
These announcements were taken positively by the markets. As shown on the chart of the Nasdaq 100 index (US Tech 100 mini on FXOpen), the new week opened with a bullish gap exceeding 1.5% – a stronger performance than the S&P 500 (US SPX 500 mini on FXOpen), which also saw a bullish gap.
This may suggest that market participants are cautiously optimistic that the sweeping tariff measures might be eased through exemptions, delays, or negotiation concessions. Nevertheless, the CNN Business Fear & Greed Index remains in "extreme fear" territory, despite inching higher compared to last week.
As of this morning, the Nasdaq 100 (US Tech 100 mini on FXOpen) has recovered approximately 15% from its 2025 low.
Technical Analysis: Nasdaq 100 (US Tech 100 mini on FXOpen)
Seven days ago, we plotted an ascending blue channel and suggested that its lower boundary could act as support – which has indeed played out.
With the latest data in hand, there is reason to believe that bulls may now be aiming to push the price up toward the channel’s median line. However, as indicated by the arrows on the chart, this median appears to have shifted from acting as support to acting as resistance.
Bulls may also face headwinds from the wide bearish candle to the left, which was formed in reaction to Trump's tariff announcements. According to Smart Money Concept methodology, this area – marked by a bearish Fair Value Gap (highlighted with a rectangle) – may now serve as resistance.
This article represents the opinion of the Companies operating under the FXOpen brand only. It is not to be construed as an offer, solicitation, or recommendation with respect to products and services provided by the Companies operating under the FXOpen brand, nor is it to be considered financial advice.

NAS100 Triangle Apex – Breakout or Breakdown ImminentBullish View:
• Price is forming higher lows and holding above the lower ascending trendline.
• A breakout above the upper descending trendline near 18,500 would confirm bullish
momentum.
• If the breakout is sustained, potential upside targets include 18,650 and 18,800.
Bearish View:
• Price has tested the lower support trendline and shown weakness near the apex of the
triangle.
• A breakdown below 18,100 would indicate bearish momentum and invalidate the ascending
structure.
• If the breakdown is sustained, potential downside targets include 17,950 and 17,700.

Nasdaq 100 drops to its lowest level since January 2024Nasdaq 100 drops to its lowest level since January 2024
According to the chart of the Nasdaq 100 (US Tech 100 mini on FXOpen), the index opened this week around the 16,500 mark – a price level last seen in early 2024.
This suggests that the sharp sell-off in equities seen last Thursday and Friday may well continue today.
Stock indices respond to Trump’s tariffs
Treasury Secretary Scott Bessent said on NBC News’ Meet the Press that there is “no reason” to expect a recession.
However, equity charts reflect market sentiment described by CNN Business’s Fear & Greed Index as “extreme fear”. This wave of negativity followed President Trump’s announcement on 2 April of harsher-than-expected international trade tariffs. In response, China and other nations announced retaliatory measures.
As a result, the Nasdaq 100 (US Tech 100 mini on FXOpen) now trades roughly 25% below its 2025 peak – officially entering bear market territory.
Technical analysis of the Nasdaq 100 (US Tech 100 mini on FXOpen)
Back on 28 February, we drew an ascending trendline (line A). Bulls attempted a rebound from this support (as shown by the arrow), but their efforts were overwhelmed by the White House’s latest policy decisions.
Given the updated price action, we can now treat line A as the median of an ascending channel. From this perspective, the index is currently near the lower boundary of the channel.
Technically, this could indicate potential support. However, as long as the price remains below the bearish gap – which includes the key psychological level of 17,000 – talk of a meaningful recovery may be premature.
This article represents the opinion of the Companies operating under the FXOpen brand only. It is not to be construed as an offer, solicitation, or recommendation with respect to products and services provided by the Companies operating under the FXOpen brand, nor is it to be considered financial advice.

Nasdaq market analysis: 04-APRIL-2025Good morning. Welcome to today's Nasdaq market analysis and educational insights for price action traders.

Nasdaq's Drop: A Temporary Rebound Before More Downside?I've been calling for a strong correction in the Nasdaq (and all major U.S. indices) since the start of the year—long before the tax war even began. I warned that a break below 20,000 was likely, with my final target set around 17,500.
And indeed, the index has fallen—regardless of what the so-called "cause" might be. Right now, Nasdaq is trading at 18,400, sitting right at a minor horizontal support zone.
________________________________________
A Short-Term Rebound Before More Downside?
📉 Overall Bias Remains Bearish – The broader trend still points lower.
📈 Rebound Likely – A push above 19,000 in the coming days wouldn’t be surprising.
⚠️ High-Risk Setup – Going long here is risky, given the current macroeconomic backdrop.
________________________________________
Trading Strategy: Short-Term vs. Long-Term
✅ For Short-Term Traders & Speculators – A temporary upside correction could offer a buying opportunity.
❌ For Swing & Long-Term Traders – It's better to wait for this rebound to fade and position short for the next leg down.
While a bounce could be on the cards, the bigger picture still points lower—I remain bearish in the long run. 🚀
Disclosure: I am part of Trade Nation's Influencer program and receive a monthly fee for using their TradingView charts in my analyses and educational articles.

Nasdaq 100 key levels to watch as index tries to extend recoveryMarkets have been grappling to establish a definitive bottom in recent sessions, before finally the bulls showed up on Friday to stage a strong rebound from oversold levels. Could the Nasdaq 100 now be poised for a more substantial recovery?
After Friday’s recovery, the big question now is whether we are witnessing the early stages of another rally or just a pause before deeper losses.
Last week, the Nasdaq 100 found some footing in the 19,115-19,240 zone, which coincides with a prior support/resistance region and the 61.8% Fibonacci retracement of the August rally. With the daily RSI firmly entrenched in oversold territory, the index was able to find dip buyers yet again.
The key technical factor to watch today is to see whether the index will show follow-through after Friday’s sharp recovery. A positive close would further erode the bears’ control, while a negative close would suggest there is more selling to come.
A few nearby resistance barriers are in focus now. The first of these hurdles is at 19,735—the low from Friday that was breached in Monday’s sharp sell-off. This level also marks the underside of a broken trendline stretching back to January 2023. A decisive break above this area could open the door to additional upside, targeting psychological resistance at 20,000, followed by the 200-day moving average near 20,340. Should dip buyers regain control, these levels could soon come into focus.
On the flip side, if renewed selling pressure emerges, downside targets include 18,800 and potentially the 78.6% Fibonacci retracement near 18,310.
Taking everything into account, my Nasdaq 100 forecast has shifted. Where I previously leaned towards further correction—now largely realised—I am now inclined to anticipate a recovery.
By Fawad Razaqzada, market analyst with FOREX.com

Nasdaq 100 Enters CorrectionNasdaq 100 Enters Correction
As shown on the Nasdaq 100 (US Tech 100 mini on FXOpen) index chart today:
→ The index has fallen below the psychological 20,000-point level, reaching its lowest in approximately six months.
→ The decline from the December peak now exceeds 10%, officially marking the start of a correction.
Why the Nasdaq 100 Is Falling Today
Bearish sentiment stems from a combination of factors, including (according to Zacks analysts):
→ The Trump administration’s tariff policies and their potential economic impact. Concerns increased after the latest jobs report showed unemployment rising from 4.0% to 4.1%.
→ Worries about AI investment costs and their long-term profitability.
→ Market anticipation of tomorrow’s Consumer Price Index (CPI) release at 15:30 GMT+3.
Technical Analysis of the Nasdaq 100 Chart
Price movements indicate that the steeper growth channel (marked in black), which had been in place since last August, has lost relevance. A broader view of the chart reveals that the index has now approached the lower boundary of a long-term channel (marked in blue), which has been forming since early 2024. Key price formations that helped define this channel are highlighted in orange.
Given that the index is at the lower boundary of the blue channel and the RSI indicator on the daily chart has dropped to multi-year lows, a short-term recovery may be likely. However, the fundamental backdrop will play a decisive role—clear signs of U.S. economic stability could support a rebound, while extreme fear (as reflected in CNN’s Fear & Greed Index) may continue to weigh on sentiment.
This article represents the opinion of the Companies operating under the FXOpen brand only. It is not to be construed as an offer, solicitation, or recommendation with respect to products and services provided by the Companies operating under the FXOpen brand, nor is it to be considered financial advice.

Nasdaq 100 Analysis: February Pushes Index Below January’s OpenNasdaq 100 Analysis: February Pushes Index Below January’s Opening Price
The Nasdaq 100 (US Tech 100 mini on FXOpen) chart shows:
→ January’s opening price was around 21,085.
→ February’s closing price was around 20,867.
This marks a 1% decline since the start of the year.
A report from Goldman Sachs, published on Friday, reinforces bearish sentiment, stating that global hedge funds sold more stocks than they bought at the end of February—the largest net selling in a year, according to Reuters.
Possible reasons for market pessimism:
→ AI-related stocks may be highly overbought. For instance, the "Magnificent Seven" tech stocks have underperformed the broader market in 2025.
→ Trump’s tariff policies on global trade could have negative economic consequences.
Technical Analysis of Nasdaq 100 (US Tech 100 mini on FXOpen)
Bullish perspective: Breaking January’s low did not trigger a strong downward trend.
Bearish perspective: The price has fallen below the support line (lower blue line), which had held since autumn last year.
The market’s next move could depend on how Nasdaq 100 (US Tech 100 mini on FXOpen) behaves around the 21,030 level. Previous rebounds from this support line were weak, and bears managed to break through with effort. This suggests they may still control this zone.
Trade on TradingView with FXOpen. Consider opening an account and access over 700 markets with tight spreads from 0.0 pips and low commissions from $1.50 per lot.
This article represents the opinion of the Companies operating under the FXOpen brand only. It is not to be construed as an offer, solicitation, or recommendation with respect to products and services provided by the Companies operating under the FXOpen brand, nor is it to be considered financial advice.

Nasdaq 100 Hits Yearly Low, Led by NVDA DeclineNasdaq 100 Hits Yearly Low, Led by NVDA Decline
The Nasdaq 100 (US Tech 100 mini on FXOpen) has fallen below 20,500 for the first time since November 2024.
Bearish sentiment driven by:
→ The latest US jobless claims report, which showed the highest figures of 2025.
→ Concerns over the destabilising and economically damaging potential of Donald Trump’s trade policies.
Nvidia (NVDA) Among the Biggest Losers
While the Nasdaq 100 lost over 2.5% in yesterday’s session, Nvidia (NVDA) shares plunged nearly 8% despite a stronger-than-expected quarterly report, as we noted yesterday.
Technical Analysis of the Nasdaq 100 (US Tech 100 mini on FXOpen)
The ongoing decline has resulted in a bearish breakout of the trendline (marked in blue) that originated in 2024. Based on key reversals (highlighted with red circles), the chart now outlines a descending channel. An attempted breakout (indicated by an arrow) failed, forming a bearish Rounding Top pattern.
If bearish sentiment prevails—especially with focus on inflation data, as the Core PCE Price Index is set to be released today at 16:30 GMT+3—Nasdaq 100 (US Tech 100 mini on FXOpen) may drop further towards the lower boundary of the descending channel.
Trade on TradingView with FXOpen. Consider opening an account and access over 700 markets with tight spreads from 0.0 pips and low commissions from $1.50 per lot.
This article represents the opinion of the Companies operating under the FXOpen brand only. It is not to be construed as an offer, solicitation, or recommendation with respect to products and services provided by the Companies operating under the FXOpen brand, nor is it to be considered financial advice.

NASDAQ is potentially OVER pricedSeeing that Nas has been getting weaker against the market makes me think its been propped up a bit and we are open to seeing a decent sized correction to the downside. This will likely shock the media and news but I belive it'll just help the asset reach new highs with a re evaluation of its components at a lower price. Trade Safe, Trade Smart, Trade Drippy!

Nasdaq 100 Hovering Near Weekly Highs in a Volatile WeekNasdaq 100 Hovering Near Weekly Highs in a Volatile Week
As shown on the 4-hour chart of the Nasdaq 100 (US Tech 100 mini on FXOpen), the index stood around the 21,600 level this morning, near the weekly high that formed at Monday’s open.
This suggests that the tech-stock index has almost fully recovered from the decline triggered by the launch of AI from the Chinese startup DeepSeek. According to media reports:
→ Experts have pointed to signs that the Chinese startup used a technique known as “distillation” – in simple terms, this means that DeepSeek’s model extracted knowledge from more advanced models such as ChatGPT. In other words, this is not about innovation but rather an unfair practice.
→ Nassim Taleb believes that the sharp drop in NVDA shares is only the beginning of a potential market downturn inflated by AI-driven expectations. Further declines could be more significant than what we witnessed on Monday.
Apart from news surrounding DeepSeek, traders were also focused on earnings reports from major corporations (which we will cover in detail in separate articles):
→ Tesla (TSLA) is holding above $400 in pre-market trading today, despite earnings per share falling short of expectations. Meanwhile, company executives believe that Trump’s policies could negatively impact Tesla’s operations.
→ Microsoft (MSFT) shares fell by more than 4%, Meta Platforms (META) surpassed $700 per share in post-market trading for the first time, and IBM surged by approximately 9%.
Additionally, the fundamental backdrop became even more eventful following yesterday’s Fed updates, which, however, contained no surprises:
→ As expected, interest rates remained unchanged.
→ According to The Wall Street Journal, the Fed has entered a “Wait-and-See” phase, showing less confidence that inflation will continue to decline.
The Nasdaq 100 (US Tech 100 mini on FXOpen) chart reveals that the price:
→ Tested a key support line (marked in blue) at the weekly low.
→ Remains within the red descending channel.
From a bullish perspective, the red channel can be seen as a large-scale correction within the broader uptrend on higher timeframes.
From a bearish perspective, the bearish gap that formed at Monday’s open may act as resistance. Whether bulls will be able to overcome this barrier in the near term will depend, among other factors, on the next batch of earnings reports from major tech companies.
Trade on TradingView with FXOpen. Consider opening an account and access over 700 markets with tight spreads from 0.0 pips and low commissions from $1.50 per lot.
This article represents the opinion of the Companies operating under the FXOpen brand only. It is not to be construed as an offer, solicitation, or recommendation with respect to products and services provided by the Companies operating under the FXOpen brand, nor is it to be considered financial advice.

The NASDAQ is Approaching a Selling OpportunityCurrently, the NASDAQ is showing a strong uptrend on the daily chart, but the gap between the 3-day and 5-day moving averages has significantly widened. Even if the market opens with a gap up today, a pullback is likely due to this divergence, so chasing buys is not recommended.
For selling at the top, consider these levels: 21940, 22040, and 22110. Especially near 22040, the resistance zone aligns with the upper Bollinger Band, making it a favorable level for selling.
Following President Trump’s announcement of expanded AI infrastructure investments, AI-related stocks like NVIDIA have surged. However, it’s unlikely that the rally will continue significantly from this point. Additionally, the NASDAQ has already triggered a sell signal on the 30-minute chart, and this could cascade into sell signals on the 60-minute, 120-minute, and 240-minute charts. Be cautious about chasing long positions.
For dip-buying opportunities, 21770, a previous resistance level, may serve as a good entry point if the market pulls back. Should the price drop to the 5-day moving average, 21630 would offer an even better buying opportunity.
I post daily analysis on the NASDAQ, Crude Oil, and Gold. Follow me to receive these updates and stay informed! 😊

Nasdaq 100: Bearish Signals Amid Increased VolatilityNasdaq 100: Bearish Signals Amid Increased Volatility
As revealed by the technical analysis of the 4-hour Nasdaq 100 chart (US Tech 100 mini on FXOpen), the ATR indicator has been above 125 since the start of 2025, in contrast to late 2024 when it was mostly below this level. This reflects heightened volatility in the US stock market due to:
→ Trump’s inauguration: The president has already signed an executive order withdrawing the US from the World Health Organization. Market participants anticipate further decisions in the near future that could significantly impact the nation’s economy.
→ Earnings season: Companies are releasing reports, prompting analysts to revise forecasts. For instance, a Jefferies analyst downgraded Apple’s (AAPL) stock rating and lowered the price target from $211 to $200, citing potentially weak revenue figures. Apple’s quarterly report is due on 30 January.
On the Nasdaq 100 chart (US Tech 100 mini on FXOpen), a bearish move (indicated by the arrow) is notable for:
→ Indicating that the median line of the ascending channel has turned into resistance;
→ Suggesting that the apparent bullish breakout above the upper red line now seems to be a false breakout.
The long lower wick on the far-right bearish candle points to strong demand around the 21,300 level. However, will buyers remain active if Trump’s actions and corporate earnings reports increase risks for them?
This article represents the opinion of the Companies operating under the FXOpen brand only. It is not to be construed as an offer, solicitation, or recommendation with respect to products and services provided by the Companies operating under the FXOpen brand, nor is it to be considered financial advice.

Market Analysis And Market Outlook of the Week of 01/06/25Saturday: End of the Week Analysis
The Week ended Red;
with a range of 735 +- points.
Monday's Open continued to bring price down through Thursday; Friday being the only Green day.
___________
Overall Weekly bias:
- Price reached a major level of support at 20,800 +- and is currently moving up.
- With enough momentum the next area being targeted is 21,800 +- .
Daily Bias:
- Further confirms Weekly bias and support zone along with price targeting 21,800 +- .
- A higher low has been created which indicated a reversing market or the beginning of consolidation.
- Directional confirmation is needed by taking out has High or making a Lower Low.
1 Hour Bias:
- The 1 hour shows a trend change from short to longs.
- Taking out last lower high, a retracement is anticipated at this level to last support.
5 Minute Bias:
- Looks bullish with price currently retracing to last support.
____________
Considerations:
- Presidential inauguration, 01/20
- Earnings Reports, 01/20
- Red Folder News, 01/07 till *ongoing.
_____________
Market Anticipated Performance:
- The Markets will Range till after the Inauguration and after earnings report.
- My bias is a range of 1,300 +- points , from 20,800 +- to 22,100.
How to Trade for Week of 01/06:
- I am looking for price to retrace on the 1hour, 100 - 200 point +-
- Then Looking to enter long as price targets 21,800
- Zone to Zone and pattern trading till 01/20

"US100 / NASDAQ 100 / US TECH" Indices Market Bullish Heist Plan🌟Hi! Hola! Ola! Bonjour! Hallo!🌟
Dear Money Makers & Robbers, 🤑 💰
Based on 🔥Thief Trading style technical analysis🔥, here is our master plan to heist the "US100 / NASDAQ 500 / US TECH" Indices Market market. Please adhere to the strategy I've outlined in the chart, which emphasizes long entry. Our aim is the high-risk Red Zone. Risky level, overbought market, consolidation, trend reversal, trap at the level where traders and bearish robbers are stronger. 👀 So Be Careful, wealthy and safe trade.💪🏆🎉
Entry 📈 : You can enter a Bull trade at anypoint,
however I advise placing Buy limit orders within a 15 or 30 minute timeframe. Entry from the most recent or closest low or high level should be in retest.
Stop Loss 🛑: Using the 4H period, the recent / nearest low or high level.
Goal 🎯: 22,800.0
Scalpers, take note : only scalp on the Long side. If you have a lot of money, you can go straight away; if not, you can join swing traders and carry out the robbery plan. Use trailing SL to safeguard your money 💰.
Warning⚠️ : Our heist strategy is incompatible with Fundamental Analysis news 📰 🗞️. We'll wreck our plan by smashing the Stop Loss 🚫🚏. Avoid entering the market right after the news release.
Take advantage of the target and get away 🎯 Swing Traders Please reserve the half amount of money and watch for the next dynamic level or order block breakout. Once it is resolved, we can go on to the next new target in our heist plan.
💖Supporting our robbery plan will enable us to effortlessly make and steal money 💰💵 Tell your friends, Colleagues and family to follow, like, and share. Boost the strength of our robbery team. Every day in this market make money with ease by using the Thief Trading Style.🏆💪🤝❤️🎉🚀
I'll see you soon with another heist plan, so stay tuned 🫂
