Nasdaq 100 Analysis: Index Rebounds After Friday’s DeclineNasdaq 100 Analysis: Index Rebounds After Friday’s Decline
The release of disappointing US labour market data on Friday unsettled both stock market participants and the President of the United States:
→ Donald Trump promptly dismissed Erica McEntarfer, Commissioner of the Bureau of Labor Statistics, accusing her of falsifying employment data.
→ Stock indices accelerated their decline, with the Nasdaq 100 Index falling below its 16 June low.
However, US stock indices staged a strong recovery on Monday. According to Reuters, yesterday marked the largest daily percentage gain since 27 May.
Why Did Stock Indices Rise?
Possible reasons include:
→ Buyers were attracted by the falling share prices of companies that, for the most part, had delivered strong quarterly earnings;
→ Market participants are betting on a potential rate cut by the Federal Reserve in September (a move strongly advocated by Trump), which could support both the economy and the stock market.
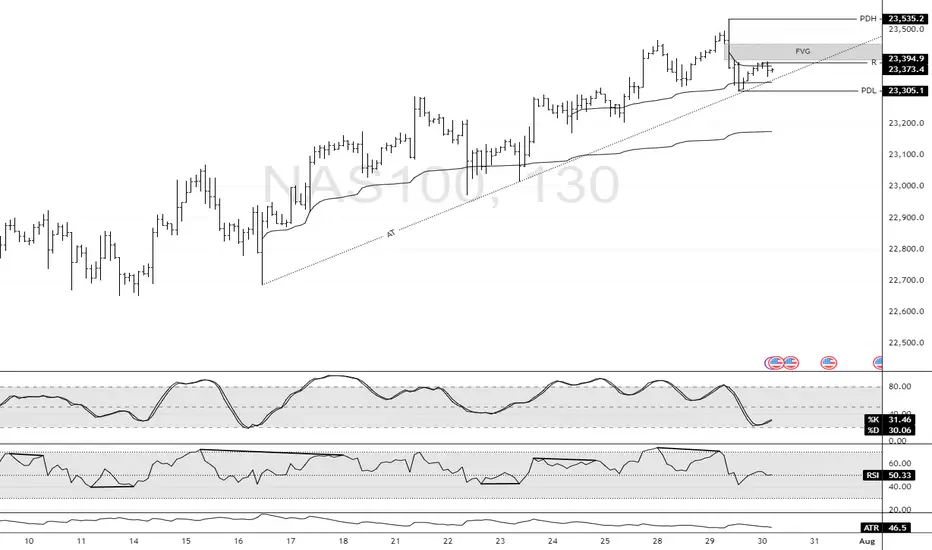
Technical Analysis of the Nasdaq 100 Chart
In our earlier analysis of the Nasdaq 100 Index, we:
→ Identified a primary ascending channel (marked in blue);
→ Highlighted that the price had risen above the upper boundary of the channel (a sign of excessive optimism);
→ Anticipated a potential correction towards the 23,020 level.
However, the correction turned out to be more substantial than initially expected.
As a result of the price movements on Friday and Monday:
→ The blue channel was widened twofold;
→ The price found support at its new lower boundary and reversed upwards;
→ As of today, the Nasdaq 100 index is trading near the median line.
This can be interpreted as the market aggressively digesting recent corporate earnings reports and the prospects of a rate cut in light of a deteriorating labour market. Demand and supply may reach a new equilibrium, potentially leading to a consolidation phase around the median of the widened channel.
It is also possible that the area marked in orange—where the price previously rallied strongly, indicating a buyer-driven imbalance—may now act as support. Resistance levels might include:
→ Former support at 23,320;
→ 23,440 – the level at which bears broke through the purple channel.
This article represents the opinion of the Companies operating under the FXOpen brand only. It is not to be construed as an offer, solicitation, or recommendation with respect to products and services provided by the Companies operating under the FXOpen brand, nor is it to be considered financial advice.
Nasdaqanalysis

Is the NASDAQ Vault Open for a Full Bullish Heist?🧠 NASDAQ Heist Masterplan: Thieves Eye on 24,500 🎯💰
🚨 Asset: NASDAQ100 / US100 / NDX
📊 Plan: Bullish | 🔁 Layering Strategy
🎯 Target: 24,500
🛑 Stop Loss: 22,600
📍 Entry: Any level – the vault’s wide open!
💼 Thief Trader's NASDAQ High-Stakes Robbery Is LIVE! 🤑📈
Welcome, money bandits & market looters! 💼💰
The time has come to launch a full-scale bullish raid on the NASDAQ fortress. We’re not just taking entries — we’re stacking them like a pro with our layered limit order strategy across swing zones. 🔫📉➡️📈
🔓 Entry:
Pick any price! We break in anytime, anywhere.
🔁 Stack your buy limits on 15m–30m swing lows.
🔔 Set your alerts – don’t let the opportunity slip.
🛑 Stop Loss:
Guard your loot at 22,600.
Risk management is the bulletproof vest in this raid. 🎯
Adjust your SL based on lot size and order volume. 📏🔐
🎯 Profit Target:
Thieves retreat at 24,500.
But hey – smart robbers use trailing SL to squeeze every last drop of gold! 🏆💸
💡 Scalpers & Swingers:
Stick to the long side only.
If your pockets are deep – full-send mode ON.
If not, tag along with swing entries. Patience pays big! 💎⏳
📢 Heads Up, Heist Crew:
News drops = landmines. Step carefully.
🚷 No new entries during major announcements.
🛡️ Use trailing SL to defend your profit bags.
🚨 Daily Reminder:
This market isn’t a playground. It’s a battlefield.
Use COT data, macro reports, sentiment scans, and index-specific triggers to fortify your robbery blueprint. Stay smart, stay updated! 📊🧠
💥 Boost Our Loot Crew 💥
Hit that LIKE ❤️ to support the Thief Army!
Stronger visibility = Bigger Loots = More Victory Runs.
See you at the next robbery – we move in silence, but the market hears us loud! 🐱👤💸🔥🚀

NASDAQ: Bears In Control! Sell it!Welcome back to the Weekly Forex Forecast for the week of Aug 4 - 8th.
In this video, we will analyze the following FX market:
NASDAQ (NQ1!) NAS100
The NAS 100 was weakened by bad job numbers, mixed earnings reports, and tariff wars. In the short term, it is bearish. Sell it down to the Weekly/daily +FVG for high probability buys from those levels.
Buying at current levels is not advised. Wait for a valid market structure shift to the upside before going long.
Enjoy!
May profits be upon you.
Leave any questions or comments in the comment section.
I appreciate any feedback from my viewers!
Like and/or subscribe if you want more accurate analysis.
Thank you so much!
Disclaimer:
I do not provide personal investment advice and I am not a qualified licensed investment advisor.
All information found here, including any ideas, opinions, views, predictions, forecasts, commentaries, suggestions, expressed or implied herein, are for informational, entertainment or educational purposes only and should not be construed as personal investment advice. While the information provided is believed to be accurate, it may include errors or inaccuracies.
I will not and cannot be held liable for any actions you take as a result of anything you read here.
Conduct your own due diligence, or consult a licensed financial advisor or broker before making any and all investment decisions. Any investments, trades, speculations, or decisions made on the basis of any information found on this channel, expressed or implied herein, are committed at your own risk, financial or otherwise.

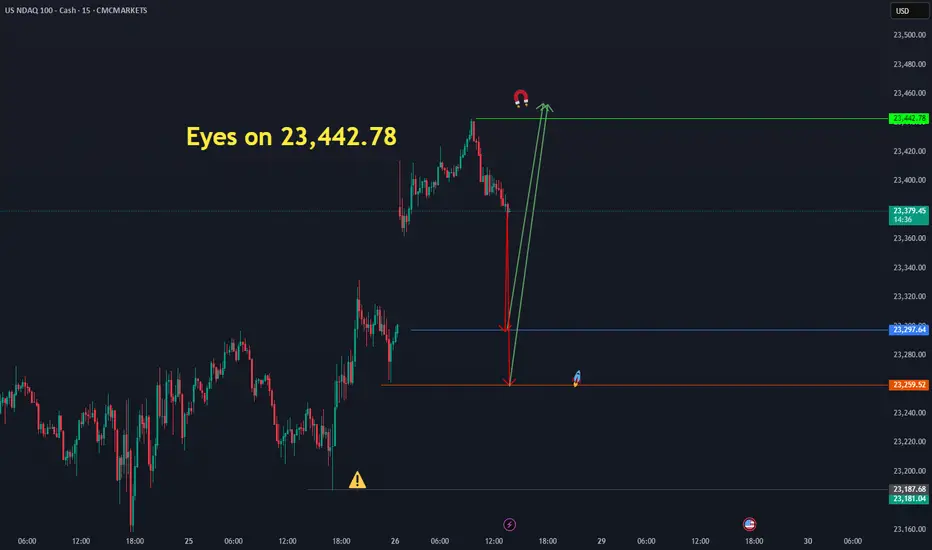
Nasdaq Finds Support at $23,305.0FenzoFx—Nasdaq dipped yesterday and formed a bearish FVG. However, the selling pressure eased as soon as the price tested the ascending trendline.
The last day's low at $23,305.0 is the immediate support. That said, a close above the immediate resistance at $23,375.0 can trigger the uptrend, targeting the highs at $23,535.0.
Eyes on 23,442.78 ( us 100 )The Nasdaq has the potential to move upward from the identified price levels of 23,297.64 and 23,259.52, targeting 23,442.78." CMCMARKETS:NDAQ100
US100 Bullish Breakout!
HI,Traders !
#US100 is trading in a strong
Uptrend and the price made a
Bullish breakout of the key
Horizontal level of 23261.4
So we are bullish biased
And we will be expecting a
Further bullish move up !
Comment and subscribe to help us grow !

"NASDAQ 100 Heist – Scalp, Swing, or Hold? (Full Plan)🔥 NASDAQ 100 HEIST PLAN – BULLISH LOOT AWAITS! 🔥
🚨 Attention Market Robbers & Money Makers! 🚨
(Swing/Day Trade Strategy – High-Risk, High-Reward Play)
🎯 Mission Objective: Loot the NDX100/US100 (NASDAQ 100) Like a Pro!
Based on Thief Trading’s ruthless technical & fundamental analysis, we’re executing a bullish heist—targeting the Red Zone (high-risk, high-reward area).
⚠️ WARNING: Overbought market, consolidation zone, potential bear traps—weak bears may get slaughtered! Strong hands only!
🔐 ENTRY: The Vault is OPEN!
"SWIPE THE BULLISH LOOT!" – Any price is a steal, but smart thieves use:
Buy Limit Orders (15m-30m TF) near recent swing lows/highs.
DCA/Layering Strategy – Multiple limit orders for max loot.
Breakout Confirmation – Don’t jump in early; wait for the real move!
🛑 STOP LOSS: Protect Your Stash!
Thief’s SL Rule: Nearest 4H swing low (22,600) – WICK LEVEL ONLY!
DO NOT place SL before breakout! (Patience = Profit.)
Adjust SL based on risk, lot size, and number of orders.
🎯 TARGETS: Escape Before the Cops Arrive!
Main Take-Profit: 24,400 (or exit early if momentum fades).
Scalpers: Longs ONLY! Use trailing SL to lock in profits.
Swing Traders: Ride the wave like a true market pirate!
📰 FUNDAMENTAL BACKUP: Why This Heist Will Work
Bullish momentum in NDX100 driven by:
Macro trends (Fed, inflation, tech earnings).
COT Report & Institutional positioning.
Geopolitical & Sentiment Shifts.
Intermarket correlations (USD, Bonds, Tech Sector).
(Stay updated—markets change FAST!)
⚠️ TRADING ALERT: News = Danger Zone!
Avoid new trades during high-impact news.
Trailing SL = Your best friend.
Lock profits early if volatility spikes!
💥 BOOST THIS HEIST! 💥
👉 Hit LIKE & FOLLOW to strengthen our robbery crew!
🚀 More heists coming soon—stay tuned, thieves! 🚀

Nasdaq 100: Market Optimism Builds Ahead of Big Tech EarningsNasdaq 100: Market Optimism Builds Ahead of Big Tech Earnings
The earnings season is gaining momentum. This week, major technology companies such as Alphabet (GOOGL) and Tesla (TSLA) are scheduled to release their quarterly results.
Given that 85% of the 53 S&P 500 companies that have already reported have exceeded analysts’ expectations, it is reasonable to assume that market participants are also anticipating strong results from the big tech names. The Nasdaq 100 index (US Tech 100 mini on FXOpen) set an all-time high last week — a level that may be surpassed (potentially more than once) before the end of August.
Technical Analysis of the Nasdaq 100 Chart
Price movements have formed an upward channel (marked in blue), with the following dynamics observed:
→ The bearish signals we highlighted on 7 July did not result in any significant correction. This may be interpreted as a sign of a strong market, as bearish momentum failed to materialise despite favourable technical conditions.
→ Buyers have shown initiative by gaining control at higher price levels (as indicated by the arrows): the resistance at 22,900 has been invalidated, while the 23,050 level has flipped to become support.
→ A long lower shadow near the bottom boundary of the channel (circled on the chart) underscores aggressive buying activity.
Should the earnings and forward guidance from major tech firms also come in strong, this could further reinforce the sustainable bullish trend in the US equity market.
This article represents the opinion of the Companies operating under the FXOpen brand only. It is not to be construed as an offer, solicitation, or recommendation with respect to products and services provided by the Companies operating under the FXOpen brand, nor is it to be considered financial advice.
NASDAQ At Good Res , Is It A Chance To Sell To Get 200 Pips ?Here is my 4H Nasdaq Chart and my opinion is the price at very interesting selling area for me , this Res Area forced the prices to go down 2 times and i think this third time will be the best one , so i`m waiting the price to go up a little to retest the res one more time and then we can enter a sell trade and targeting from 100 to 200 pips . the only reason to cancel this idea if we have a clear daily closure above my res area .

Nasdaq 100: Bearish Signals Near the All-Time HighNasdaq 100: Bearish Signals Near the All-Time High
As the 4-hour chart of the Nasdaq 100 (US Tech 100 mini on FXOpen) shows, the index reached a new all-time high last week. However, the price action suggests that the current pace of growth may not last.
Last week’s strong labour market data triggered a significant bullish impulse. However, the upward momentum has been entirely retraced (as indicated by the arrows).
The tax cut bill signed on Friday, 4 July, by Trump — which is expected to lead to a significant increase in US government debt — contributed to a modest bullish gap at today’s market open. Yet, as trading progressed during the Asian session, the index declined.
This suggests that fundamental news, which could have served as bullish catalysts, are failing to generate sustainable upward movement — a bearish sign.
Further grounds for doubt regarding the index's continued growth are provided by technical analysis of the Nasdaq 100 (US Tech 100 mini on FXOpen) chart, specifically:
→ a bearish divergence on the RSI indicator;
→ price proximity to the upper boundary of the ascending channel, which is considered resistance.
It is reasonable to suggest that the market may be overheated and that bullish momentum is waning. Consequently, a correction may be forming — potentially involving a test of the 22,100 level. This level acted as resistance from late 2024 until it was broken by strong bullish momentum in late June.
This article represents the opinion of the Companies operating under the FXOpen brand only. It is not to be construed as an offer, solicitation, or recommendation with respect to products and services provided by the Companies operating under the FXOpen brand, nor is it to be considered financial advice.

Nasdaq: At the Upper EdgeYesterday, the Nasdaq climbed above resistance at 22,475 points. Currently, the index is positioned outside our turquoise Target Zone (coordinates: 21,751 – 22,425 points), which remains active. Stops for short positions 1% above the zone have not yet been triggered. Our primary scenario remains intact for now: technically, there is room for wave B to reach the next resistance at 23,229 points. Following the B-wave peak, a downtrend is expected with the corrective wave C. With a 42% probability, we anticipate that wave alt.(4) is already complete, and the index may break directly higher within the magenta-colored wave alt.(5), surpassing the 23,229-point mark.
📈 Over 190 precise analyses, clear entry points, and defined Target Zones - that's what we do.

USTECH H4 AnalysisUSTECH Showing a bullish Flag. If it breaks this zone above, Most probably can fly up to 22,106.35 and higher TO 23,200. If no, Can rally between 20,800, 20,400 or even lower. Trading Analysis from 23-06-25 to 27-06-25. Take your risk under control and wait for market to break support or resistance on smaller time frame. Best of luck everyone and happy trading.🤗

NASDAQ 2 Expected Scenarios Very Clear , Which One You Prefer ?Here is my opinion on Nasdaq on 4H T.F , The price still below my res so we can sell it if the price touch the res level again , and if we have a daily closure above my res then we can buy it with retest for the broken res , so it`s very easy if we still below the res we can sell and if we going up it we can buy it . but we need a daily closure above first .

update TP for NASDAQ i see more ups for NASDAQ .The Nasdaq index touched strong support, so I think it will rise further, as shown.


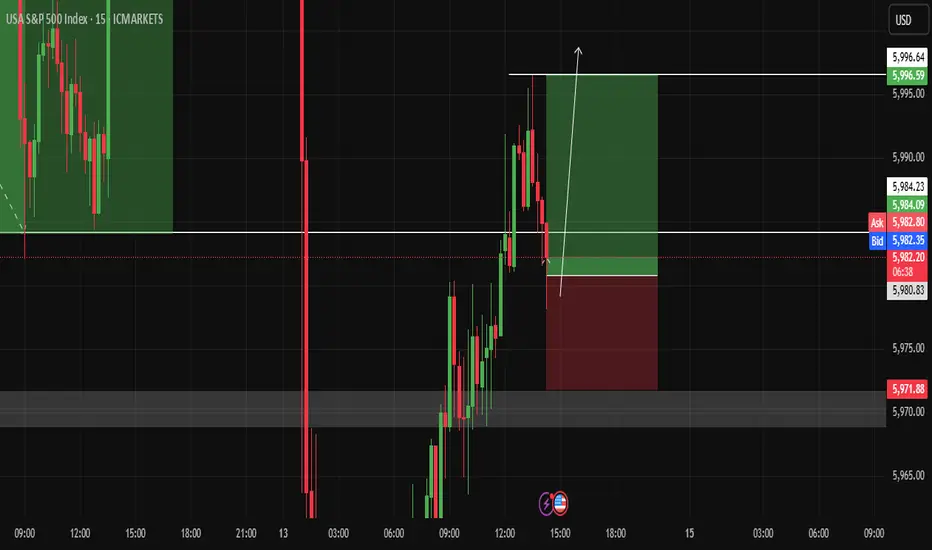
Opportunity to buy NASDAQBy combining support and resistance, I see NASDAQ rising to 5996 before reaching to 5971
Volume Power System Signal to Buy Nasdaq We have a good signal from ouer System VPS to buy the NASDAQ and hold the position until a new reversal signal appears.

Nasdaq: The Rally Continues!The Nasdaq ended last week with strong upward momentum, moving swiftly toward the resistance at 20,694 points. Now it's getting interesting: once the index breaks above this mark, it should quickly enter our upper turquoise Target Zone (coordinates: 21,751 – 22,425 points), where we expect the peak of wave X in turquoise. Afterward, we anticipate a pullback during wave Y, which should aim for our lower turquoise Target Zone (coordinates: 17,074 – 15,867 points). The corrective magenta wave (4) should be completed there. However, if the Nasdaq directly surpasses the significant resistance at 23,229 points, our alternative scenario will take effect. In this 35% likely case, we would consider wave alt.(4) as already complete and locate the index in the impulsive wave alt.(5) .

Are You Ready For Nasdaq Next Flight ? 500 Pips Waiting For Us !Here is my opinion on Nasdaq , i think we have a very good closure and we can say we will go up for sometime in the next few days , so i`m waiting the price to go back to my support area ( Lower One ) that already broken , and then we can enter a buy trade and targeting 500 pips . also if the price touch the higher place and give me a good bullish price action , we can enter a buy trade with small lot size and if the price go to the lower one we can add one more contract .

NASDAQ Breakout Done , 5oo Pips Waiting For Us , Are You Ready ?Here is my opinion on Nasdaq , we have a stop hunt very clear and then we have a very good breakout with amazing bearish candle , so i`m waiting for the price to go up a little to retest the broken support and new Res , and then we can enter with good bearish P.A And Targeting from 300 to 500 pips .

Nas100 Buyside Rally Towards target is Pending.Nasdaq is looking to target the buyside and it will rally soon within a 2 days and it will target it faster than anything

Trade the Structure: NAS100 Possible Retrace & Buy OpportunityThe NAS 100 recently broke its market structure after a twist in trade policy—with Donald Trump delaying tariffs by 90 days—which sparked a robust rally. On the 4‑hour chart, we're looking for a bullish setup where the initial surge might be followed by a pullback into a sideways accumulation zone. This consolidation is expected to form a "spring" pattern—a brief retest that could trap sellers—followed by a clear break of market structure that signals a renewed upward move. The entry is ideally on the breakout, backed by supportive volume, while risk management is maintained with a stop-loss positioned just below the range if/when price retraces into support. 🚀📈💰

Tactical US100 Trading: Converting 1W Trend into 30m Opportunity📈 The US100 index is currently exhibiting a bearish trend pattern on the weekly timeframe. We can observe a notable rally followed by a retracement into equilibrium when analyzed against the previous price wing range.
🔎 Currently, the index is positioned at a premium level, creating an environment where short sellers might be building positions in anticipation of further downward movement. However, market dynamics remain highly sensitive to external influences, particularly unexpected statements and social media announcements from influential figures like Donald Trump.
🌊 With such market unpredictability in play, focusing on shorter timeframes provides more actionable intelligence. Price action signals offer clearer guidance in this volatile environment.
⚡ Trade Opportunity: The 30-minute chart reveals a defined trading range worth monitoring. A definitive break above this range could present an opportunity to enter long positions, while a breakdown below support might signal a favorable short entry point.
🎯 This breakout strategy enables traders to respond to actual market movements rather than attempting to forecast the broader market direction—a particularly valuable approach given the current unpredictable market landscape.
⚠️ DISCLAIMER: This analysis is provided for informational purposes only and does not constitute financial advice. Trading carries significant risk of capital loss and may not be appropriate for all investors. Historical performance does not guarantee future outcomes. Always perform independent research and consider your personal financial circumstances before executing any trades. Market conditions are subject to rapid changes, and no trading methodology ensures profits. The information presented should be used as one of many inputs in your decision-making process.
