NASDAQPatiently waiting for NAS to touch that Resistance level so we sell hard..trade safe and be blessed
Nasdaqanalysis

NAS100 Daily - Potential LongsLong-term longs are inline with HTF momentum.
16000 is the HTF target with 15500 as the next area of interest at the break of 15150.
About $800 of price action on the cards.

NQ1!, Trading the Market one Swing at a TimeThe market remains massively unchanged. The sell side made an attempt to go lower but the buy side had entered aggressively at the 61.8% extension of the most recent swing, a confluence with 50 DMA, and pushed back. A strong rejection suggests higher prices to come. The monthly R1 retest is not ruled out. I've been mentioned that level in the previous posts. The buyers success is easy to gauge through Fib levels. Holding 23.6% put them on the path to a new all time high. Breaching it would lead to a retest of the 61.8% and potentially monthly S1.
I continue to emphasize that the market is very technical. This is the result of the Algos being involved more and more in the trading. Without hard "stop and turn" they move the price from a level to level.
It makes sense to trade one swing at a time. Applying Fibs and watching the reaction on a smaller timeframe is a proven strategy. It is also very mechanical and objective helping to overcome the overthinking syndrome.
The Fib levels are more accurate for the most recent swing.
08/21/2021

NASDAQ100 could move UP!Hey tradomaniacs,
NASDA100 could move u after a breakout of the contraction.
Fundamentals are still yet a bit chaotic, but we can expect to see some more pullbacks instead of a straight move down in stocks. (re-positionings)
Technically a good chance, but keep in mind that we have a small expiration today and so possible volatility!
LEAVE A LIKE AND A COMMENT - I appreciate every support! =)
Peace and good trades
Irasor
Wanna see more? Don`t forget to follow me

NASDAQ in a minute frameThe Nasdaq 100 index is one of the most heavily traded exchanges in the world, and is favored by traders who want to trade the big swings of some of the biggest companies by market capitalization.
Trading the Nasdaq is unique from trading other exchanges and stocks, as it can be very volatile and operates under strict regulations. The Nasdaq 100 is made up of the largest 100 companies on the Nasdaq composite by market cap, which is home to over 3000 stocks.
0

Nasdaq ShortThis is how we expect for Nasdaq to move down, with some reactions to our supports and resistances,
Lets see how goes ...
@FxShzd

Nasdaq Short Setup Avialbe To Catch 300 Pips After ConfirmationThis is an educational + analytic content that will teach why and how to enter a trade
Make sure you watch the price action closely in each analysis as this is a very important part of our method
Disclaimer : this analysis can change at anytime without notice and it is only for the purpose of assisting traders to make independent investments decisions


NAS100 Daily - Potential Longs- Clear bullish momentum on the HTF.
- Expect a continuation for the rest of Q3.
- 15000 is a round, psychological level that's been broken.
- Key levels of sensitivity are:
- 15250 and 16000 based on Fibonacci extensions

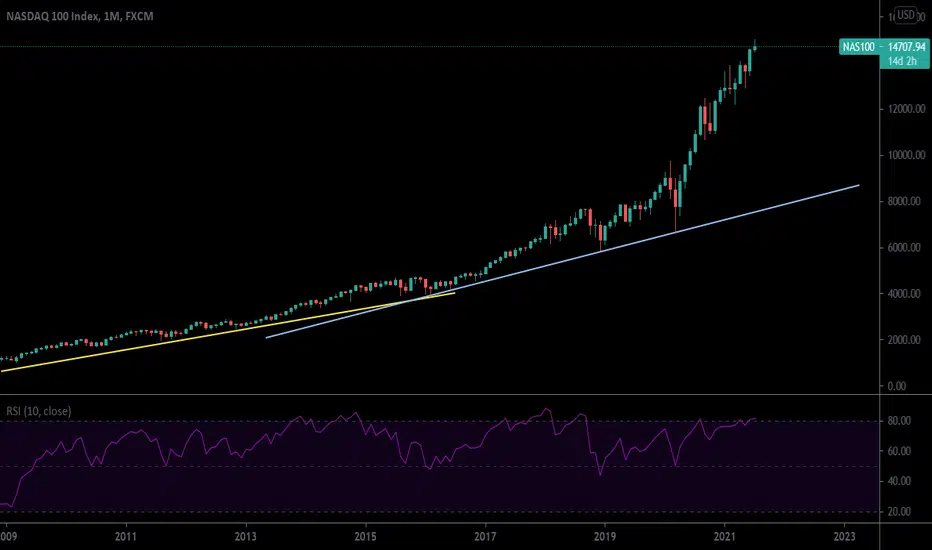
NASDAQ The Golden Age Cycles can be identified by a curved rise, then a large pullback back to the average, dipping below the average, reclaiming the average, then dipping below again, and then reclaiming, then the next cycle begins
Cycle 3 in progress
Jump on the train while its hot "roaring 20s"
Looking for the 11000% increase before the fall occurs
Purgatory possibility is there due to the presence of large Fib circles (price loves to crash vertically along these lines)
Regardless, Cycle 3 has begun! (price lifted off the mean)
The roaring 20's has been done before...

Nasdaq analysis New York market will be opening very soon and it will be very interesting to see where this market goes. We are in a very crutial point on nasdaq where this retest on the bullish structure can be the sign for a big fall as analysed last analysis. However if we do see the price creep back inside the structure then we can see more bulls coming back in pushing prices high again and most likely even creating new highs.
For now I will still strongly side with the bears as the bullish structure has been broken. Things can easily change so always have good risk management in place.

US100 / NASDAQ: SIGNAL TRADINGHere is my idea, to take benefit from reversal
Use your money management wisely

Nasdaq cycle support14640 now major cycle support
if suppose close below or break with volume then we can see further fall till 14150
as per my previous view 1000 points rally made, so any profit booking in inevitable
till august end buy on dip is good.
16/07/2021 astro wise pressure date.

NASDAQ 100 - How far we can goA 10 years long rally and pandemic accelerate it more almost going vertical, with inflation we are running in bad economy. If there bubble then tech will see big dent.
We still need correction or deep correction time will tell but it's almost a turning point.
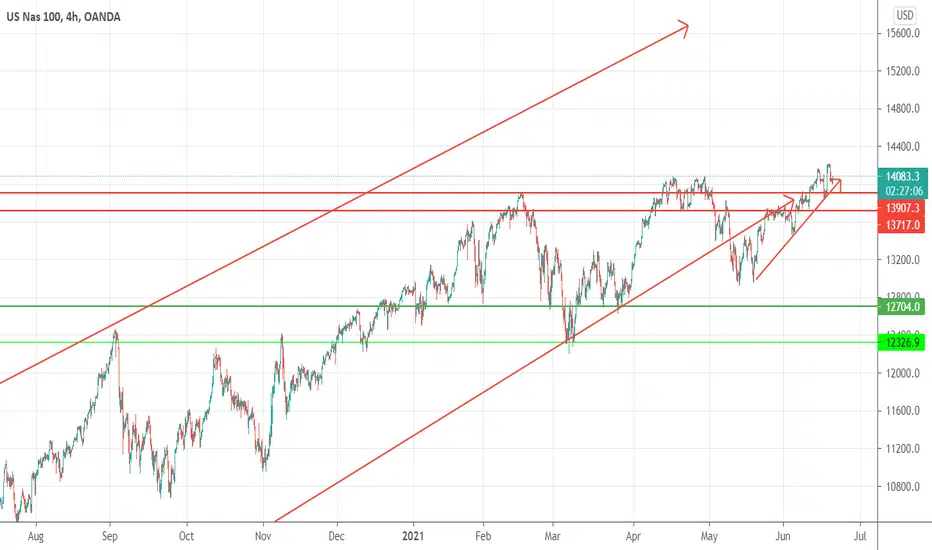
Nasdaq: Crossing! 🤩🤩🤩The Nasdaq is about to cross the resistance line at 14883 points, which means that new all-time highs are coming! We expect the index to further rise until at least 15001 points, before new corrections come our way.
Keep trading!

NQ Power Range Report with FIB Ext - 7/6/2021 SessionContract - CME_MINI:NQU2021
- PR High: 14713.25
- PR Low: 14692.75
Evening Stats
- Gap: = N/A
- Session Open ATR: 166.72
- Volume: 64k
- Open Int: 225k
- Trend Grade: Bullish
- From ATH: 0% (Rounded)
Key Levels (Rounded - Think of these as a range)
- Long: 15247
- Mid: 14676
- Short: 14104
Keep in mind this is not speculation or a prediction. Only a report of the Power Range with Fib extensions for target hunting. Do your DD! You determine your risk tolerance. You are fully capable of making your own decisions.

Nasdaq heading towards 14640...Nasdaq is looking for new cycle,
if break 14100 zone immediately we can see 14640 Target...
it valid only if break 14100
(14/06/2021 analyzed )
Thanks & Regards
K Sureshkumar

Nasdaq100- Big drop is unavoidableNas100 is putting in Ath after Aths, but, if we look closely, we can see that they are marginal and slightly exceeding the previous.
In my opinion, we are in a huge distribution faze and a big drop is unavoidable
A drop under 14k would confirm my bearish outlook and open the door for 12500.
Sell the break is my strategy
NAS100USD ( Nasdaq ) Hit All Targets +330 Pips, New Entry AddedThis is an educational + analytic content that will teach why and how to enter a trade
Make sure you watch the price action closely in each analysis as this is a very important part of our method
Disclaimer : this analysis can change at anytime without notice and it is only for the purpose of assisting traders to make independent investments decisions

NAS100USD ( Nasdaq ) Running In 200 Pips Profits , What Next ?This is an educational + analytic content that will teach why and how to enter a trade
Make sure you watch the price action closely in each analysis as this is a very important part of our method
Disclaimer : this analysis can change at anytime without notice and it is only for the purpose of assisting traders to make independent investments decisions

NAS100USD ( Nasdaq )Running In 130 Pips Profits ,Did U Catch It?This is an educational + analytic content that will teach why and how to enter a trade
Make sure you watch the price action closely in each analysis as this is a very important part of our method
Disclaimer : this analysis can change at anytime without notice and it is only for the purpose of assisting traders to make independent investments decisions

NASDAQ - Bearish Opportunities !Welcome to our Trade Setups - June 06th ( NASDAQ ) !
SELL NASDAQ
ENTRY LEVEL @ 13763.25
SL @ 13814.00
TP @ 13509.25
Max Risk: 1% - 3%!
Risk/Reward Ratio: 5
Leave us a comment or like to keep our content for free and alive.
Have a great week everyone!

