NAS100USD 2021 Feb 08 Week
OANDA:NAS100USD
NAS100USD 2021 Feb 08 Week
Very low market participation as price revisited high.
Keep stops tight if long.
Resistance2 = 13786
Resistance1 = 13567 - 13649
Support1 = 13358 - 13382
Support2 = 13077 - 13120
Support3 = 12845 - 12903
Remember to like and follow if you find this useful.
Have a safe and profitable trading week.
Nasdaqanalysis

NAS100 AnalysisNas has made a new high again and we may see a continuation of this bullish momentum taking price to 13700-13800. However we may get some bearish pullback before continuing, if the bears do pull it down it will come down to somewhere between 13410-13300.

DOW JONES\NASDAQ - Tracking Minor Waves - Mania\FOMO Edition.Although I mainly use the waves for my analysis I do often look at other indicators such as how people behave.
Lately I have seen some peculiar behavior.
So far my analysis appears to be heading in the right direction so let's discuss what is happening.
See related ideas below to see how we got here.
If you don't know the long term pattern shouldn't you be doing your research instead of just following the crowd?

DOW JONES\NASDAQ - Tracking Minor Waves - Wave E In ProgressIn this video I make sense of the latest moves in these markets using AriasWave.
I am still bearish these markets and in this video I explain why these moves aren't bullish.
If these markets were going to go higher I would be seeing the evidence but there are no signs of this happening.
I do play devils advocate all the time which is why I am confident in my analysis.
See related ideas linked below.
Remember to use Disciplined Money Management Principles to ensure longevity as a trader.

NASDAQ - Tracking Minor Waves - Short Trade OpportunityFurther to my previous idea on the NASDAQ it's looking like a top is in place.
Similar to the DOW I am expecting lower prices.
Having the confirmation of 2 charts is also important.
You should always be care when trying to use one chart to confirm another because this leads to confirmation bias.
Just make sure you understand the waves because it will be the best evidence.
See related ideas below.
Remember to use Disciplined Money Management Principles to ensure longevity as a trader.

NAS100USD 2021 FEB 01 Week
OANDA:NAS100USD
NAS100USD 2021 Feb 01 Week
Supply came in per last week's analysis
We haven't see buyers coming in to defend their price yet.
Resistance3 = 13567 - 13617
Resistance2 = 13411 - 13450
Resistance1 = 13120 - 13181
Support1 = 12845 - 12903
Support2 = 12461 - 12497
Support3 = 12220 - 12236

Nas Burial 3Bear sentiment still remains the same on nasdaq. Target of 12k remains as well. i also suspect further bearishness will take course later, with time in my opinion as well.

NASDAQ - The best trade in the world / 14k is callingOur favorite trade , buy Nasdaq.
For reasons we have explained many time before . Just look at our previous ideas


NAS100USD 2021 Jan 18 Week
OANDA:NAS100USD
NAS100USD 2021 Jan 18 Week
Green/Red zones = preferred entry area
We are back into Bar A ruling.
Will it test the bottom of Bar A or Support1?
Let's see how it goes when market returns next week.
Intermediate Resistant = 12940 - 12968
Intermediate Support = 12757 - 12781.5
Resistant3 = 13360
Resistant2 = 13236 - 13277
Resistant1 = 13118 - 13150
Support = 12461 - 12497
Support2 = 12220 - 12236
Support3 = 11785 - 11812
Trade management = 30% / 50% / till next zone
Remember to Like and Follow if you find this helpful

NASDAQ - Wave Revision - Mapping Out The Last WavesThe purpose of this wave revision is to give you an understanding that the Dow Jones will outperform in the last waves.
We can also see how the markets are practically tracing out the same waves whilst also noting how one is more complex than the other.
Using these latest wave revisions can also help us plan ahead for when the market finally does top out in terms of which will be the easiest to short.
Please LIKE and FOLLOW to get notification of updates and future posts.

NASDAQ - Wave Revision - Another Update On The WavesIn this video I make a correction to yesterdays video post.
There was a wave which was incorrectly labelled which indicates that the larger Wave B is still in progress.
It is important to get this count right for future trading ideas.
Previous idea is linked below.
Please LIKE and FOLLOW to get notification of updates and future posts.

NASDAQ - Wave Revision - Welcome To Fractal HeavenIn this Wave Revision I talk about how EXPANDED Wave B Was.
I lay it all out so you can see exactly what is left in the tank of this market.
It will probably need a little more juicing up to get it across the finish line, so fire up the printing press... Not like I have to ask.
I think we all know what is going to happen when they start weening the markets off the QE although many will be in denial.
See the idea for the Dow Jones below in related ideas.
Please LIKE and FOLLOW to get notification of updates and future posts.

NAS100 - Trading planYesterday I said to buy at 12575, today there could be another entry between 12631 and 12575.
The highlighted green demand zone is just in case if the market suddenly crashed, there will be great opportunity to buy.
--
This idea is based on my technical analysis only.
Do your research and trade on your own risk!

NAS100USD 2021 Jan 04 WeekOANDA:NAS100USD
Grey box showing market is in rotation.
Last bar closed in the top quarter of the bar.
Either remain in range or strength is likely to continue
until market shows us
further sign(s) of strength or weakness
Resistant1 = 12925.60 - 12932.6
Support1 = 112812.8 - 12827.6
Support2 = 12751.4 - 12773.6
Support3 = 12460.2 - 12461.8


NAS100 Trading inside the boxIts been very quite due to the holidays so i been trading inside the box. Its amazing how easy and simple strategy made me 300 pips in a day while consolidating. These strategies and experience cannot be found free on yourtube. This is 8 years of real life experience, which i learnt the hard way, Now its time to pass this down to serious people who will end up becoming profitable, successful and them carry on passing this knowledge down

NASDAQ - Tracking Minor Waves - This Could Be A TopAlthough we haven't seen a break of the rising trend-line or wave iv we need to use a couple of other indicators here.
We have divergence on the MACD indicating wave v price action.
Price bounced after the dip and encountered resistance on the upper channel.
The recent move down appears to be a Type-2 leading pattern.
We will need to see more evidence before any further assumptions can be made.
A break of the wave iv support around 12212 should provide confirmation that a top is in place.
I will provide another update as soon as we see a few more waves occur.
Please LIKE and FOLLOW to get notification of updates and future posts.


NASDAQ100: NEW HIGHS AND A RETEST (LOWS).new highs, a rising, an ascending, the B.R.C and a retest to previous support around 61-50%. 🤞🏽 make sure you leave a thumbs up 👍🏽 and comment, if you found this interesting and do follow for more. 😗

NASDAQ100: A 61-38% RETEST!So i made an analysis that went well which was a double with a bullish rise that lead to a breakout. a retest to 61% (12357) & 50% (12333) might just give us a 38% (12310) reach, a bounce of the 38% (12310) continues the bullish trend but if denied we might just be on our way down. but unfortunately the daily chart shows a bearish rejection so 🤞🏽on this week might just be bullish. if you loved my idea, leave a comment, like and be sure to follow for more 😗😙 cheers! ✌🏽🤑

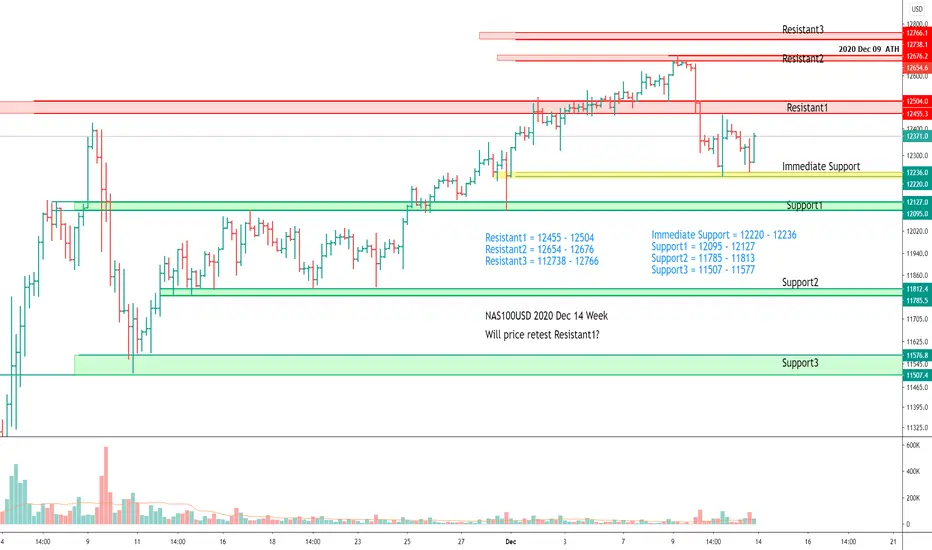
NAS100USD 2020 Dec 14 WeekOANDA:NAS100USD
NAS100USD 2020 Dec 14 Week
Will price retest Resistant1?
Resistant1 = 12455 - 12504
Resistant2 = 12654 - 12676
Resistant3 = 112738 - 12766
Immediate Support = 12220 - 12236
Support1 = 12095 - 12127
Support2 = 11785 - 11813
Support3 = 11507 - 11577
Nasdaq Composite and EWT It's a daily chart of NASDAQ, and it has made an Elliott wave pattern. The 4th wave has been completed. And the fifth wave is remaining.
The fifth is in the making process. As per the rules of Elliott wave theory, the fifth wave will hit the 0.618 level, which I have found by using Fibonacci of 1+3. Hence, it will march for the following level 12700 - 12800 .
Nasdaq Composite may collapse (up to support trendline) for the following levels before turning up.
Downside levels: 11860 - 11600
