NASDAQ buy > Going Up > Daily supportWatch strong price action at the current levels for BUY. GOOD LUCK!
NASDAQ on the 4 chart has broken above the daily support
Nasdaqanalysis

NASDAQ100/ USTECH/ US100PROBABILITY 2 - A POSSIBLE FORMATION OF THE DOUBLE TOP PATTERN WHICH IS A REVERSAL PATTERN WHICH SHIFTS THE MARKET FROM BEING BULLISH TO BEARISH. THIS IS POSSIBLE IF THE LAST HIGH HOLDS AS A STRONG RESISTANCE WITH ENOUGH MOMENTUM TO PUSH THE PRICE LOWER.

NASDAQ100/ USTECH/ US100NEW MONTH NEW PRICES AS PRICE MANAGED TO BREAK THROUGH ALL THE DAILY RESISTANCE ZONES . THE MARKET IS SHOWING POSITIVES KICKS AS THIS IS THE NEW MONTH AFTER PRESIDENT OF THE USA BIDEN WON THE ELECTIONS.

NDX SELL TP_10.309_13.40%_1595.0pips_SL_12.461_4.67%_556.5pipsNDX SELL TP_10.309_13.40%_1595.0pips_SL_12.461_4.67%_556.5pips

Nasdaq100- Towards a new all time highSince 10.600 Low in September, Nas100 had a good run with a gain of almost 20%.
The rise is constructive and looks reliable and, with the price just under resistance, I expect a break and continuation.
12k is now support and dips towards this zone should be bought.
13k seems a logical target for the technology index
NAS100 AnalysisNAS100 Analysis
Yesterday We had a close above the 12110 break a strong key level. If we manage to stay out and break out the current trend then we can see nasdaq reaching 12400-12550. If we fail then Nas may come back to 12040- 11900.

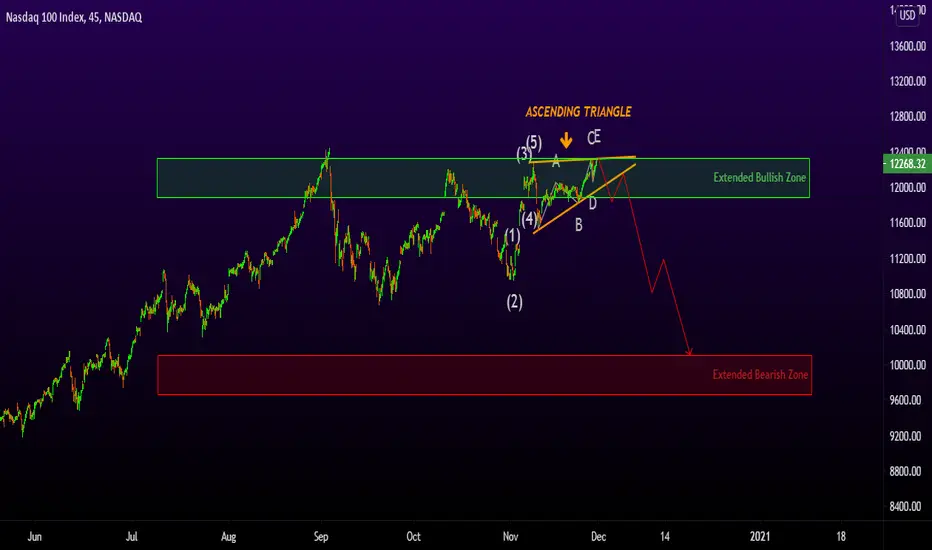
NASDAQ - Tracking Minor Waves - The End Is Near.Not much has happened since the last update but here goes anyway. (See related ideas below)
Really not much else to say on this one apart from what's in the video.
It's the calm before the storm.
Please LIKE and FOLLOW to get notification of updates and future posts.

NAS100 AnalysisNAS100 Analysis
Will we break 12110 today to bring the bulls right back in?. or break through 11901for a bearish momentum. If we do break 12110 then next target will be 12259, as for the bears 11900-11653. It may come down to find support before going back up. You must understand how to use support and resistance to be able to profit from these analysis. These are key major S/R but there are other minor support and resistance that are not drawn on the chart that you must be able to identify and draw yourself. I dont draw all the minors so people dont get confused with alot of lines.


Nasdaq- Sell on confirmationAfter 1000 points drop from 12.500 top to 11.500, Nasdaq recovered some of the sosses and is trading at the time of writing above 12k figure (12040)
I expect a new leg down from the technology index and a new drop to at least 11500
A drop under 11900-12k zone would confirm this outlook and a rise above 12250 would negate it

US 100 IDEAI THINK WE JUST GONNA GO RETEST THE HIGHS THEN DROP WHATS YOUR TAKE..OPEN FOR CRITICS ...LOOKING TO TAKE IT ON THE WAY UP AND THEN DOWN

NASDAQ - Tracking The Top Of This Market In Great Detail.In this video I discuss exactly what we are going to see as we complete the last few waves of this final wave v.
To understand the bigger picture I will link a few previous related ideas down below for your enjoyment.
Wave v is a stretched out Zig Zag and I take great pleasure in explaining every wave in detail.
Please LIKE and FOLLOW to get notification of updates and future posts.

NASDAQ Detailed AnalysisNASDAQ Analysis
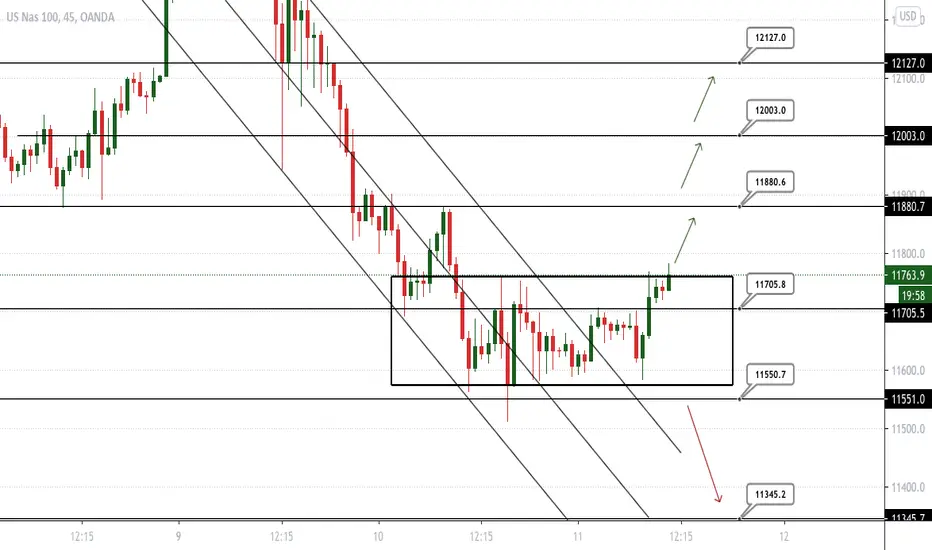
Hello Everyone. Market has been very choppy yesterday and it was same for all pairs. There wasn't much smooth trades. On NASDAQ, We have broke out of our falling channel and it has gone into consolidation. When it does break it our targets are as follow
Buyers: First target 11880, If it break here then next key level is 12000 and if it break this then 12127.
Sellers: Target is 11345 thats if it breaks out the box down and also breaks out our key level 11550.
I use pure price action so my key levels are where i enter or exit. I also draw minor support/ resistance for pullbacks/retest etc. Please make sure when you take trades, you have your confirmations that this trade is going the direction you entered and not fall into traps of false breakout.
Nasdaq - Short opportunityIt seems that the market has made a big channel that we are waiting to break to the level I marked on the chart with a strong push then we can enter the downward trend and make a good profit
Happy Pips
Good Luck :)

Nasdaq- I'm more bearish than 2 days agoIn my weekend comment, I said that I'm bearish Nasdaq and I expect a drop sooner rather than later, and looking at the daily chart after yesterday's vaccine news I become more bearish.
After the hanging mean which concluded last week's run, yesterday we have a very aggressive reversal day that engulfs all Friday's rise and this for me is a clear signal that bulls lost control, vaccine, or no vaccine.
I will look to sell above 12k figure and as a target, I look for 11k zone but I wouldn't be surprised if it drops to 10k in the medium term

NAS100- Weekly Review What a week it has been guys we saw some really big moves in the market that we dont usually see due to the election. This should have been a great opportunity for all traders. For myself trading couldn't have been any easier because the market was going one way. I made profits this week that are alot more than average due to this volatility. Biden has beat trump, Cant wait for tomorrow to see where this market is going
Weekly NASDAQ Pip Review
Monday: +244, -40(SL)
Tuesday: +225
Wednesday: +127, +245, -50(SL), -40 (SL)
Thursday: +204, +100
Friday: +165, +166
Blues: +1476
Reds: -130
Total: +1346 Profit
Total NAS Trades: 11 Trades: 8 Win, 3 Loss
Have a wonderful weekend guys!!!

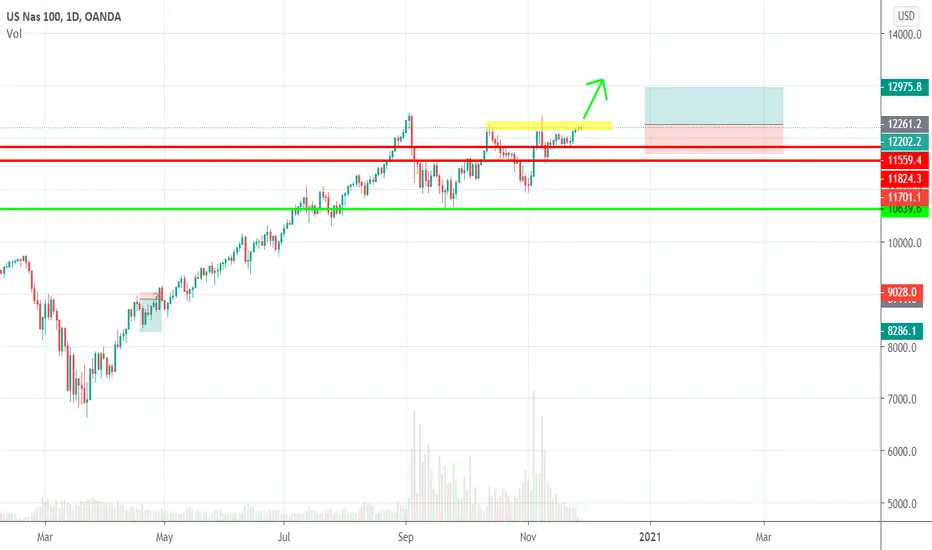
Nasdaq where to?The election week was a strong one for Nasdaq, with the price rising and managing to close above 12k.
Now the index is facing resistance and a strong sell zone so we can see the price rolling back to 11k.
On the other hand, a daily close above the previous top would put bulls in control and we can see the technology index making new all-time highs.
That being said, I will look to sell with a tight SL and a 11k target which can have a 1:5 R:R

NAS100 Analysis NAS100- Analysis
Hi Guys. Hope you all have a great time trading. This week the market has given some amazing opportunities, we had some very big moves and alot of volatility. Lets have a look where this is going now.
So we had a double top last night and now the market is at the bottom of the trend line. Nas is having a pullback and how deep this pullback is we cant be certain so iv put key levels where the pullbacks may come to. It can be a small pullback to 11881 or a medium pullback to 11525 or a deep one all the way to 11310.
I think if we continue as we are, we can eventually see a new high of 12500.
Have a great day trading :)


NASDAQ - BIRDS EYE VIEW - 5 Waves Since 2009 Just About Done.In my previous idea linked below I outlined Wave v (stretched out zig zag in detail) so you can check that out. (related ideas)
The move up since 2009 has been an ending diagonal Wave C.
If you look at the monthly RSI you will see the weakness behind this move.
Wave v cannot be longer than Wave iii which is why this one is close to topping out.
If you zoom in on the waves it becomes clear that these are not 5 wave advances.
Each wave is moving up in three waves. Waves iii and v are stretched out zig zags which is an AriasWave discovery.
Stretched out zig zags are indicative of extreme stimulus, jawboning, low interest rates and mania.
Want to know about interest rates? I have linked that idea below also.
Please LIKE and FOLLOW to get notification of updates and future posts.

NASDAQ,- Tracking The End Game Final Wave TopThis stretched out Zig Zag with an expanded (B) looks like it is almost done.
The B Wave within the (B) wave was the main culprit driving this monster rally.
This thing just needs to pop up to make one more all time high before the pattern is complete.
A break of the red trendline should signal the end.
This is also the end of wave v since 2009 but the pattern is not what you think.
I will post a separate chart depicting my bigger picture view.
Please LIKE and FOLLOW to get notification of updates and future posts.

