NASDAQ Elliott Wave Analysis Higher Timeframe (22/07/2023)In the weekly, the NASDAQ looks bullish and might be preparing for a Wave III to the upside. However, the minimum requirements for a Wave II to the downside were not fulfilled. As long as we do not take out the Wave I high, it could be that we still make a new low as a Wave II. In the daily and 4h, it looks like the upward structure as a wave (3) might finish soon. Investors should wait for a good pullback before buying again. Currently, as an investor, we are in an area to take profit.
Nasdaqanalysis

NASDAQ Elliott Wave Analysis for Friday 21/07/2023In the lower timeframe, we are at an area where the wave ((iv)) can be bought (ABC pullback looks more or less complete). However, we call for caution in long trades as we are close to finishing an upward structure in the higher timeframe.

NASDAQ on SupportNASDAQ is in support range of 15723-15730, hopefully we can see the up rally from here.
Manage your risk accordingly!

NASDAQ Elliott Wave Analysis for Thursday 20/07/2023In the lower timeframe, we are waiting for an ABC pullback to finish the wave ((iv)). From there, we can go long again. For the moment, there looks to be a complete structure to the upside which can be shorted (warning: against the main direction).

NASDAQ Elliott Wave Analysis for Wednesday 19/07/2023In the lower timeframe, we are waiting for an ABC pullback to finish the wave ((iv)). From there, we can go long again. For the moment, there looks to be a complete structure to the upside which can be shorted (warning: against the main direction).

NASDAQ Elliott Wave Analysis for Tuesday 18/07/2023In the lower timeframe, we are waiting for an ABC pullback to finish the wave ((iv)). From there, we can go long again.

NASDAQ Elliott Wave Analysis for Monday 17/07/2023In the lower timeframe, we are waiting for an ABC pullback to finish the wave ((iv)). From there, we can go long again.

NASDAQ Elliott Wave Analysis Higher Timeframe (15/07/2023)In the weekly, the NASDAQ looks bullish and might be preparing for a Wave III to the upside. However, the minimum requirements for a Wave II to the downside were not fulfilled. As long as we do not take out the Wave I high, it could be that we still make a new low as a Wave II. In the daily and 4h, it looks like the upward structure as a wave (3) might finish soon. Investors should wait for a good pullback before buying again. Currently, as an investor, we are in an area to take profit.

NASDAQ Elliott Wave Analysis for Friday 14/07/2023Although the NASDAQ looks bullish in the higher timeframe, we expect a pullback in the lower timeframe. In the 4 hours, we see 5 waves up and wave 5 is ending with divergence compared to wave 3. If the divergence is not erased, we would expect a pullback. In the 1 hour, the upward structure looks incomplete. When we have a complete impulse up, a short can be initiated (against the main direction). A safer way to trade is to wait for the next ABC pullback and go long from there.

NASDAQ Elliott Wave Analysis for Thursday 13/07/2023Although the NASDAQ looks bullish in the higher timeframe, we expect a pullback in the lower timeframe. In the 4 hours, we see 5 waves up and wave 5 is ending with divergence compared to wave 3. If the divergence is not erased, we would expect a pullback. In the 1 hour, the upward structure looks incomplete. When we have a complete impulse up, a short can be initiated (against the main direction). A safer way to trade is to wait for the next ABC pullback and go long from there.

NASDAQ Elliott Wave Analysis for Wednesday 12/07/2023Although the NASDAQ looks bullish in the higher timeframe, we expect a pullback in the lower timeframe. In the 4 hours, we see 5 waves up and wave 5 is ending with divergence compared to wave 3. If the divergence is not erased, we would expect a pullback. In the 1 hour, the upward structure looks incomplete. However, the structure looks very messy. We have to wait for more data.

NASDAQ Elliott Wave Analysis for Tuesday 11/07/2023Although the NASDAQ looks bullish in the higher timeframe, we expect a pullback in the lower timeframe. In the 4 hours, we see 5 waves up and wave 5 is ending with divergence compared to wave 3. If the divergence is not erased, we would expect a pullback. In the 1 hour, the upward structure looks incomplete and we see an entry for a long trade today.

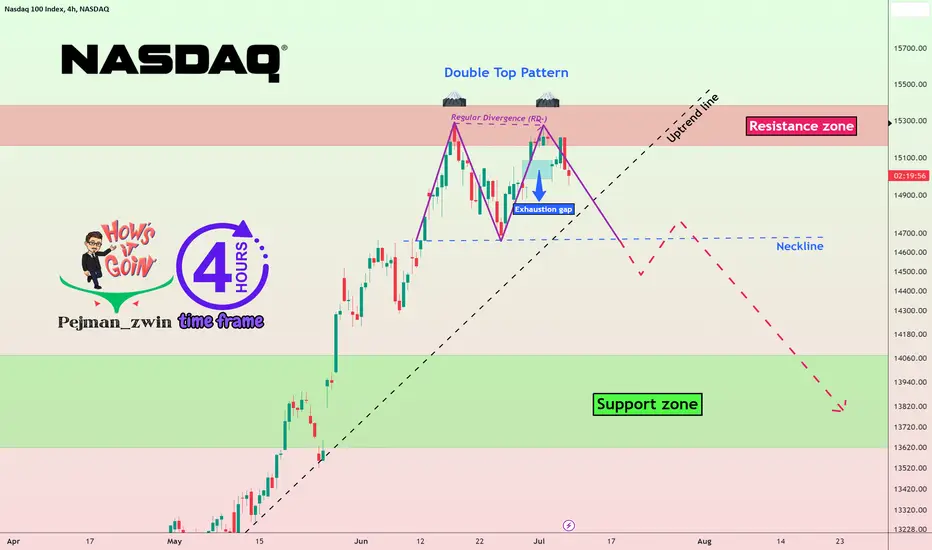
Nasdaq crash by🗻Double Top Pattern🗻Nasdaq is moving near the 🔴 resistance zone(15,385-$15,160) 🔴, and the formation of an Exhaustion gap can be a 💡 Sign 💡 of the end of the upward trend of the Nasdaq these few weeks.
Also, due to the Regular Divergence(RD-) between two consecutive peaks, the possibility of forming a 🗻 Double Top pattern 🗻 is very high.
🔔I expect the Nasdaq to fall to at least the 🟢 support zone($ 14,060-$ 13,610) 🟢 after breaking the uptrend line and neckline .
Nasdaq 100 Index Analyze (NDXUSD), 4-hour time frame⏰.
Do not forget to put Stop loss for your positions (For every position that you want to open).
Please follow your strategy, this is just my Idea, and I will be glad to see your ideas in this post.
Please do not forget the ✅' like '✅ button 🙏😊 & Share it with your friends; thanks, and Trade safe.
NASDAQ Elliott Wave Analysis for Monday 10/07/2023Although the NASDAQ looks bullish in the higher timeframe, we expect a pullback in the lower timeframe. In the 4 hours, we see 5 waves up and wave 5 is ending with divergence compared to wave 3. If the divergence is not erased, we would expect a pullback. In the 1 hour, the upward structure looks incomplete and we see an entry for a long trade today.

Is the Tech bull run over?Here's my Elliott Wave Count on the Nasdaq which suggests we could see some more downside to complete wave {iv}, within the following days, to then resume to the upside.
Feel free to ask me questions, trade safe!

NASDAQ Elliott Wave Analysis Higher Timeframe (07/07/2023)The NASDAQ looks bullish and might be preparing for a Wave III to the upside. However, the minimum requirements for a Wave II to the downside were not fulfilled. As long as we do not take out the Wave I high, it could be that we still make a new low as a Wave II.

NASDAQ Elliott Wave Analysis for Thursday 06/07/2023Although the NASDAQ looks bullish in the higher timeframe, we expect a pullback in the lower timeframe. In the 4 hours, we see 5 waves up and wave 5 is ending with divergence compared to wave 3. If the divergence is not erased, we would expect a pullback. We had another successful trade yesterday. Now we have to wait for more data.

NASDAQ Elliott Wave Analysis for Wednesday 05/07/2023Although the NASDAQ looks bullish in the higher timeframe, we expect a pullback in the lower timeframe. In the 4 hours, we see 5 waves up and wave 5 is ending with divergence compared to wave 3. If the divergence is not erased, we would expect a pullback. However, in the 1 hour, the upward structure looks incomplete so we expect a bit more upside.

NASDAQ Elliott Wave Analysis for Tuesday 04/07/2023Although the NASDAQ looks bullish in the higher timeframe, we expect a pullback in the lower timeframe. In the 4 hours, we see 5 waves up and wave 5 is ending with divergence compared to wave 3. If the divergence is not erased, we would expect a pullback. However, in the 1 hour, the upward structure looks incomplete so we expect a bit more upside.

NASDAQ Elliott Wave Analysis for Monday 03/07/2023Although the NASDAQ looks bullish in the higher timeframe, we expect a pullback in the lower timeframe. In the 4 hours, we see 5 waves up and wave 5 is ending with divergence compared to wave 3. If the divergence is not erased, we would expect a pullback. However, in the 1 hour, the upward structure looks incomplete so we expect a bit more upside.

NASDAQ Elliott Wave Analysis Higher Timeframe (01/07/2023)The NASDAQ looks bullish and might be preparing for a Wave III to the upside. However, the minimum requirements for a Wave II to the downside were not fulfilled. As long as we do not take out the Wave I high, it could be that we still make a new low as a Wave II.

NASDAQ Elliott Wave Analysis for Friday 30/06/2023Although the NASDAQ looks bullish in the higher timeframe, we expect a pullback in the lower timeframe. In the 4 hours, we see 5 waves up and wave 5 is ending with divergence compared to wave 3. If the divergence is not erased, we would expect a pullback. However, in the 1 hour, the upward structure looks incomplete and we can go long once the pullback is completed.

NASDAQ Elliott Wave Analysis for Thursday 29/06/2023Although the NASDAQ looks bullish in the higher timeframe, we expect a pullback in the lower timeframe. In the 4 hours, we see 5 waves up and wave 5 is ending with divergence compared to wave 3. If the divergence is not erased, we would expect a pullback. However, in the 1 hour, the upward structure looks incomplete and we can go long once the pullback is completed.
