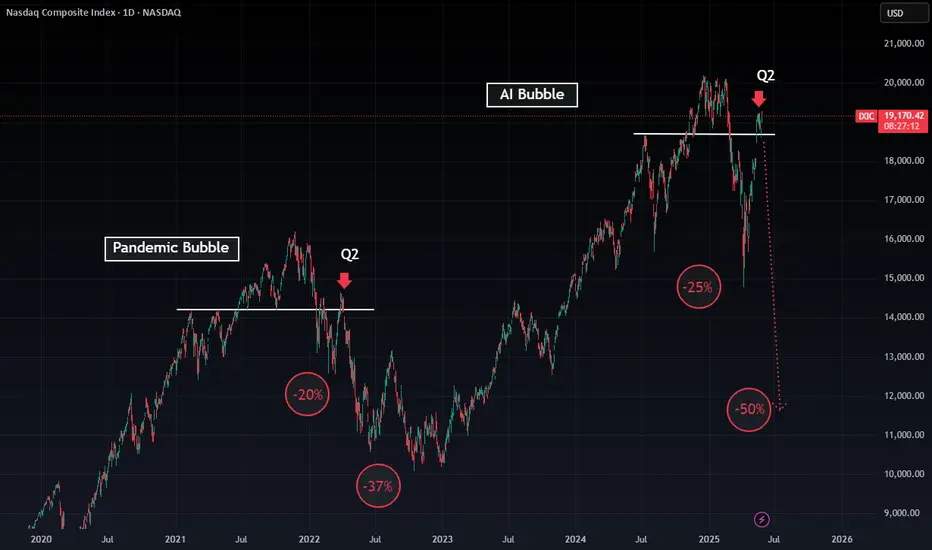
Nasdaq Composite – Deja Vu All Over Again🐂 Bulls are like parents – they can watch the same movie over and over and never remember the ending.
Look at the Nasdaq Composite:
Pandemic bubble? Popped.
Q2 peak? Drop.
AI bubble? Feels like we’re on repeat.
📉 The last times we had these setups, we saw:
A 20% drop, then a 37% cascade.
Now? A potential 25% drop just to revisit recent levels… or even -50% if the movie repeats the whole script.
🎥 Are we at intermission or is it the climax? The market’s about to decide.
Don’t let popcorn dreams blind you. Look at the chart and ask:
👉 Do I want to watch the same movie again, or leave early?
Nasdaqcomposite
When to buy Crypto and when to sell The only measure I've found that seems to have some consistency to assign relative value to crypto is by comparing BTC futures performance VS Nasdaq Total Return...
When BTC futures are in deep discounts it is time to Buy, when in wide premiums, it is time to sell!
Right now it's time to sell!

Trump's Second Term Brings Sharpest Market Decline Since 2001It's gone nearly three months or so... (Duh..? WTF.. less than 3 months, really? 🙀) since Donald Trump entered The White House (again).
Those times everyone was on a rush, chatting endless "Blah-Blah-Blah", "I-crypto-czar", "crypto-capital-of-the-world", "we-robot", "mambo-jumbo", "super-duper", AI, VR and so on super hyped bullsh#t.
What's happened next? We all know.. mostly all US stocks and crypto markets turned to 'a Bearish Mode', or to at least to 'a Correction' (that is still actual at this time).
Here's a short educational breakdown for Nasdaq Composite index NASDAQ:IXIC what we think about all of that, at our beloved 💖 @PandorraResearch Team.
Trump's Second Term Brings Sharpest Market Decline Since 2001: Analyzing the recent 15% Stock Market Plunge
President Donald Trump's second term has coincided with a dramatic stock market downturn, with the S&P 500 losing approximately 15% of its value since his January 2025 inauguration. This represents the worst start to a presidential term since George W. Bush in 2001 during the dot-com crash. The decline has erased more than $3 trillion in market value, driven primarily by concerns over trade policies, particularly the implementation of new tariffs.
Market analysts point to growing fears of potential stagflation—a toxic combination of slow economic growth and high inflation—as investor confidence continues to deteriorate despite pre-election expectations of business-friendly policies.
Unprecedented Market Decline Under the New Administration
Historical Context of Presidential Market Performance
The current market downturn stands out in stark relief when compared to previous presidential transitions. The S&P 500 has fallen nearly 10% in the first 10 weeks since Trump's inauguration on January 20, 2025, marking the worst start under a new president since George W. Bush in 2001. This decline is significantly worse than the start of the prior five administrations, with Bush's roughly 18% drop during the dot-com crash being the only steeper decline in recent presidential history. Looking further back, only Richard Nixon experienced a comparable early-term market decline with a 7.2% drop, highlighting the severity of the current situation.
When examining presidential market performance metrics, Trump's second term has already distinguished itself negatively. During the first 50 days, the S&P 500 declined by 6.4%, positioning it among the poorest market starts since 1950. By contrast, the best 50-day starts were achieved by John F. Kennedy (up 9.4%), Barack Obama (up 5.7%), and Bill Clinton (up 4.2%), demonstrating how unusual the current market trajectory is in historical context.
Magnitude of the Current Decline
The scale of market value destruction has been substantial. More than $3 trillion has been erased from the S&P 500's value over approximately 52 trading sessions since Trump's inauguration. By early April 2025, the decline had accelerated to approximately 15% from Inauguration Day, pushing the market dangerously close to bear territory. Market analysts note that if the S&P 500 reaches a 20% decline from its recent peak, it would mark the earliest instance of a bear market during a new administration based on S&P 500 history since 1957.
The tech-heavy Nasdaq Composite has suffered even more severely, with declines exceeding 11% by mid-March. This demonstrates the particular vulnerability of growth stocks that had previously led market gains, now facing the most significant corrections.
Key Factors Driving the Market Downturn
Trade Policy Uncertainty and Tariff Concerns
Trade policy, particularly the implementation and threat of tariffs, has emerged as the primary catalyst for market turmoil. The unpredictable nature of these policies has created significant uncertainty for businesses, investors, and consumers alike. Trump's "on-again, off-again approach to tariffs" has effectively extinguished the optimism that initially buoyed markets following his election victory in November 2024.
The market decline accelerated dramatically after what was termed the "Liberation Day" event, during which Trump announced plans for unprecedented tariff escalation. Two-thirds of the S&P 500's 15% decline occurred after this announcement, prompting Ed Yardeni of Yardeni Research to observe that "Liberation Day has been succeeded by Annihilation Days in the stock market".
Fear of Stagflation and Economic Instability
Many economists have warned that the new tariffs could reaccelerate inflation at a time when economic growth may be slowing, creating conditions for stagflation. This combination is particularly concerning for investors, as it creates a challenging environment for corporate profitability and economic prosperity. The risk that tariffs could trigger this economic condition has effectively neutralized investor optimism regarding other aspects of Trump's agenda, including potential regulatory reforms and tax reductions.
Shift in Market Sentiment
The market has undergone a fundamental transformation in sentiment from the period immediately following Trump's election victory to the current environment. Initially, investors had bid stocks up to record highs, anticipating benefits from tax cuts, deregulation, and business-friendly policies. However, this optimism has been replaced by growing concern about economic direction.
As one market strategist noted, "We have witnessed a significant shift in sentiment. A lot of strategies that previously worked are now failing". The S&P 500 has relinquished all gains made since Trump's November 2024 election victory, representing a striking reversal in market confidence.
Potential Long-Term Implications
Historical Patterns and Future Outlook
Historical analysis suggests that poor market starts during presidential transitions often foreshadow continued challenges. According to SunDial Capital Research strategist Jason Goepfert, rough starts represent a "bad omen" for stocks based on past performance patterns. His analysis indicates that markets typically show a median return of -1.9% six months after such a start, and after a year, they generally remain flat. Among similar historical instances, only four out of ten cases resulted in more gains than losses over the following year.
Administration's Response to Market Decline
Unlike during his first term, when Trump regularly referenced strong stock market performance as evidence of his administration's success, his second-term approach appears markedly different. Some market analysts have noted that "The Trump administration appears to be more accepting of the market's decline, potentially even welcoming a recession to achieve their broader objectives". This shift in attitude has further unsettled investors who previously expected the administration to prioritize market stability.
Technical challenge
The tech-heavy Nasdaq Composite index has recently soared 12% for its best day since January 2001.
But did you know what happened next in 2001? The major upside trend as well as 5-years SMA were shortly broken and market printed extra 40 percent Bearish decline.
Similar with what's happening in 2025..!? Exactly!
Conclusion
Trump's second presidential term has coincided with one of the worst stock market starts in modern American history, comparable only to George W. Bush's entry during the dot-com crash of 2001.
The approximately 15% market decline since inauguration represents a loss of trillions in market value and a complete reversal of the optimism that followed his election. Trade policy uncertainty, particularly regarding tariffs, has emerged as the primary driver of market instability, creating fears of potential stagflation and undermining business confidence.
As historical patterns suggest that poor starts often lead to continued underperformance, investors remain concerned about the market's trajectory through the remainder of 2025 and beyond.
--
Best 'a bad omen' wishes,
Your Beloved @PandorraResearch Team 😎

Apparatchik Trump Says 'No.. More Pain' Ahead of Amazon EarningsPresident Trump's new tariffs have had a significant negative impact on Amazon's stock performance, revenue, and earnings, primarily due to increased costs and supply chain disruptions.
Here below is a detailed analysis of these effects.
Impact on Amazon's Stock Performance
Amazon's stock has seen substantial declines following the announcement of Trump's tariff plan. The company's shares dropped nearly 7% within two days of the announcement and are down nearly 21% year-to-date. These tariffs have exacerbated existing challenges for Amazon, which was already struggling in early 2025 with a 13% decline in stock value during the first quarter. The broader market also suffered, with technology stocks experiencing sharp declines as investors reacted to fears of higher costs and inflation.
Revenue Challenges
Amazon's reliance on Chinese suppliers for merchandise has made it particularly vulnerable to the newly imposed tariffs. Over 50% of Amazon's top third-party sellers are based in China, and many of their products are subject to hefty import taxes, including a 34% tariff on Chinese goods. These tariffs increase landed costs for a significant portion of Amazon's inventory, forcing sellers to either absorb the additional expenses or pass them on to consumers through higher prices. This could lead to reduced consumer demand, as higher prices may deter shoppers from purchasing goods on Amazon's platform.
Additionally, the elimination of duty exemptions on minor imports—previously advantageous for discount platforms such as Temu and Shein—has disrupted Amazon's competitive pricing strategy. While this change may level the playing field among e-commerce platforms, it also raises operational costs for Amazon's marketplace vendors who had relied on these exemptions.
Earnings Pressure
The tariffs are projected to slash Amazon's annual operating profits by $5 billion to $10 billion due to increased merchandise costs. Goldman Sachs estimates that these costs could rise by 15% to 20%, further straining profitability. While Amazon has historically maintained lower prices compared to competitors, absorbing these increased expenses without raising prices significantly may be unsustainable in the long term.
Moreover, fears of inflation resurgence due to Trump's trade policies could further dampen consumer purchasing power. This would likely lead to lower sales volumes and additional pressure on profit margins across Amazon's retail operations.
Potential Mitigation Strategies
To counteract these challenges, Amazon may implement several measures:
Vendor Negotiations. The company could negotiate with suppliers to share the burden of increased input costs rather than bearing them entirely.
Price Adjustments. Selective price increases on certain products may help offset rising costs without alienating customers entirely.
Supply Chain Diversification. Shifting sourcing away from heavily tariffed regions like China or focusing more on domestic suppliers could reduce exposure to trade disruptions.
Focus on Services. Amazon’s cloud division, AWS, contributes significantly to its operating income (58% in Q4 2024) and remains largely unaffected by tariffs. Increased emphasis on AWS could help mitigate losses from retail operations.
Technical challenge
The main technical graph indicates on Bearish market in development, with nearly 30% potential to further decline, down to major 10-year average support.
Conclusion
Trump’s tariffs have created substantial headwinds for Amazon by driving up costs and disrupting its supply chain. These challenges have led to stock declines, reduced revenue potential, and significant earnings pressure. While Amazon is exploring mitigation strategies such as vendor negotiations and diversification, the long-term impact will depend on how effectively the company adapts its operations amidst ongoing trade tensions.
--
Best 'Apparatchik' wishes,
PandorraResearch Team 😎

Nvidia Stock Goes 'DeepSeek', Ahead of Earnings CallNvidia's stock has experienced significant volatility recently, largely influenced by the emergence of a new AI model from Chinese startup DeepSeek. This model, known as R1, reportedly rivals the capabilities of advanced models from major U.S. tech companies like OpenAI and Google, but does so using less powerful and cheaper chips. This development has raised concerns among investors about the sustainability of Nvidia's market dominance and the high valuations of U.S. tech stocks.
Impact of DeepSeek on Nvidia Stock
Stock Performance.
On January 27, 2025, Nvidia's shares plummeted by over 16%, marking its largest intraday drop since August 2023. This decline wiped more than half-a-trillion US dollars from Nvidia's market capitalization. The stock fell approximately 12.5% in early trading, reflecting widespread investor anxiety about the implications of DeepSeek's advancements.
Investor Sentiment.
The introduction of DeepSeek's AI model has prompted a reevaluation of the heavy investments made by U.S. tech firms in AI technologies. Analysts noted that if DeepSeek can achieve competitive results with lower costs, it may lead to reduced demand for Nvidia's high-end chips. This has caused a ripple effect across the tech sector, with other semiconductor stocks also experiencing declines.
Market Reactions.
The broader tech market was affected as well, with the Nasdaq index falling nearly 4% in pre-market trading. Other companies linked to AI and technology also saw significant drops; for instance, ASML and Broadcom fell by 7% and over 12%, respectively.
Perspectives by Fundamental and Technical Analyst
Skepticism About DeepSeek.
While some analysts expressed skepticism about DeepSeek's ability to compete effectively without advanced chips, they acknowledged that its success could force U.S. companies to reconsider their strategies regarding AI investments and efficiency. For example, Citi analysts maintained a "buy" rating on Nvidia, suggesting that major U.S. companies are unlikely to shift away from using Nvidia's GPUs in the near term.
Concerns Over Valuations.
Analysts at Wedbush highlighted that U.S. tech stocks are currently valued at premium levels, which makes them vulnerable to any disruptions in perceived technological superiority. They noted that even small developments like those from DeepSeek could significantly impact stock prices due to inflated expectations surrounding AI advancements.
Future Outlook.
Despite the immediate negative impact on Nvidia's stock, some analysts believe that concerns may be exaggerated and that U.S. firms are still well-positioned for long-term growth in AI technologies. They argue that while DeepSeek's model is impressive, it does not yet match the comprehensive infrastructure and ecosystem that American tech giants have developed.
Technical Outlook.
The main technical graph for Nvidia stock (1-week resolution) indicates on epic breakthrough of upside channel, which has been alive for more than last two years, until ̶D̶o̶n̶a̶l̶d̶ ̶T̶r̶u̶m̶p̶ someone entered ̶a̶ ̶c̶h̶a̶t̶ White House.
Ahead of Nvidia Earnings call (scheduled on February, 26) our 'fancy-nancy' Analyst Team is strongly against any Nvidia stock purchase below ready to be lost, $130 per share level.
Potentially 52-week SMA can support a stock for a while near $115 a share, otherwise we believe Nvidia stock will dive below $100 level again.
Conclusion
In summary, the rise of DeepSeek represents a pivotal moment for Nvidia and the broader tech sector, challenging existing assumptions about AI development costs and market dynamics. The ongoing situation will likely lead to further scrutiny of investment strategies within the industry as stakeholders assess the long-term implications of this emerging competition.

US Stocks Surge as Trump Takes Office: Will the Rally Continue?The US stock market is buzzing with excitement as President-elect Donald Trump's inauguration on January 20 approaches. On Friday, January 17, the major indices saw significant gains, with:
● S&P 500 SP:SPX rose 59 points, or 1%
● Dow Jones Industrial Average TVC:DJI increased 335 points, or 0.8%
● Nasdaq composite NASDAQ:IXIC surged 292 points, or 1.5%
◉ Major Sector Driving Gains
The technology sector, particularly the "Magnificent Seven" stocks, has been instrumental in this upward momentum.
◉ Investor Sentiment
Investors are optimistic about Trump's policies, but concerned about potential inflationary pressures. Experts believe Trump's administration could lead to significant growth due to:
1. Increased Government Stimulus: Trump's background as a real estate developer may result in policies designed to stimulate economic growth.
2. Technological Innovation: Rapid advancements in technology are expected to create new industries and opportunities.
3. Lower Interest Rates: There is speculation that Trump may implement lower interest rates to further encourage economic expansion.
Overall, the market is cautiously optimistic, with investors closely monitoring Trump's policies.

Election Volatility Shakes Up US MarketsS&P 500
● The index retreated from its all-time high of 5,880, initiating a downward trend.
● A breakdown below the Rising Wedge pattern has been confirmed.
● Key support levels to watch:
➖ Immediate support: 5,670
➖ Strong support: 5,400
Nasdaq Composite
● The index has hit an all-time high near the 18,750 level before beginning to retreat.
● After breaking through the trendline support, the index is currently hovering slightly above the next immediate support level.
● If it dips below this support, we could see a significant drop, potentially driving the index down to the 16,670 level.
**This market volatility is consistent with historical trends during US presidential election years. The 2024 election is particularly unpredictable due to conflicting economic indicators and potential delays in results.

US Markets Demonstrate Confidence Despite Election JittersThe US markets are currently demonstrating a bullish sentiment, despite concerns surrounding the upcoming election.
All major indices, including the S&P 500, NYSE Composite, and Nasdaq Composite, have formed a bullish Cup & Handle chart pattern and have subsequently broken to follow an upward trend.
While the S&P 500 and NYSE Composite have reached new all-time highs, the Nasdaq Composite is close to its highest peak, further reinforcing the positive market outlook.
'This overall bullish sentiment suggests that the upward trend in the US markets is likely to continue, even in the face of election-related uncertainties.

Nasdaq Composite - Can U see this happening?I can.
See it.
And also Believe it.
These securities are measured in #Fiat
which only becomes worth ... less with each passing year.
Until #Vivek comes into office, of course and backs the dollar with a basket of commoditie!
(maybe that basket may include #BTC)
Inverse head and shoulders has massive linear and log targets
Will be fun to watch this play out.

NASDAQ Composite - The Momentum Will Continue Till 19,250(1) After a notable increase, the price reached the 16,200 level before facing a sharp decline of approximately 37%.
(2) Following this, the price found solid support near the 10,150 level and started to climb again.
(3) After a two-year consolidation period, the price finally broke through its resistance level and surged upwards.
(4) A Cup & Handle pattern emerged on the weekly chart, suggesting a continuation of the upward trend.
(5) Currently, the price is at its all-time high, nearing a potential resistance level around 19,250.

NASDAQI Also Want To See The Nasdaq Trading Lower This Week, They Can Trade Up To Take That H4 Liquidity Above That High.
Or They Can Run Out Today's Lunch Hour Highs Then Sell Off.
Do Remember To Use The S&P500 And The Dow Jones Index For SMT Divergence.

SPX500 needs a rest. obviously, the overall trend of SPX and all other indexes is bullish.
but, as all of them has stretched from their key moving averages, I expect a correction and I hope it will be in shape of a continuing base instead of a sharp pullback.
it can be a new chance to buy the proven leading stocks.
So, I see the market in neutral or even negative for very short-time and a strong bullish long-term trend.
Friday daily candle and its volume helps this scenario.

🟥 NASDAQ's Deceptive Rally
MARKET OVERVIEW: 📈
The NASDAQ Composite index seems to be in a buoyant mood, painting a rosy picture of the overall market. However, upon closer inspection, it becomes evident that this rally is highly concentrated and powered primarily by the FANG (Facebook, Amazon, Netflix, Google) stocks. In fact, the large market caps of these tech behemoths are heavily skewing the index, making it appear as if the entire market is thriving, when in reality, it's only a select few stocks that are soaring high.
DIVERGENCE: THE REAL CONCERN 🚫
The true concern lies in the divergence between the NASDAQ Composite and the market participation line. The former is marking a higher high, while the number of stocks above their 200-day moving average (a common benchmark in technical analysis) is making a lower high. This indicates that a significant proportion of the market is underperforming, even as the index itself continues to rise. Currently, about 2/3 of the market is trading below their 200-day moving average, a situation eerily similar to what we witnessed in 2021.
IMPLICATIONS: A SHORT-TERM WARNING ⚠️
This divergence presents a short-term ominous sign for traders and investors alike. Buying into a market where only a fraction of the stocks are driving the rally while the rest are struggling could potentially lead to considerable losses. It's imperative to interpret the NASDAQ Composite's performance with a pinch of salt, keeping in mind that it is not reflective of the broader market's health.
CONCLUSION: PROCEED WITH CAUTION 🚦
In conclusion, despite the NASDAQ's apparent strength, the market is exhibiting a deceptive rally. The majority of stocks are not participating in this upward momentum, which is a significant cause for concern. It's recommended to approach this market with caution, and consider this divergence when making investment decisions. It's not a market scenario you would want to blindly buy.

Wait for a pullback before going long.
How to seize the trend in this market? It is to follow the trend. When the trend comes, an invisible force pushes you forward.
Currently, the stock market is expected to continue to rebound as the pace of interest rate hikes has slowed. However, with a return rate of around 5%, there is limited upside for the stock market to rebound significantly. Therefore, it is recommended to continue buying the dips in the Nasdaq at the 12,000 level.
Short positions are not currently recommended as global stock indices are rebounding, and market sentiment has not reached the point of being extremely bullish. Following the trend is still the main strategy, as the Nasdaq has not rebounded as much as the Hang Seng and European stock indices, which had huge declines last year. It is important to prevent the possibility of it not rising when the news becomes clear later on, as there may still be opportunities for 500 to 800 point moves.
Specific strategy: Wait for a pullback to the 12,000 level to go long.
Follow me to make trading simpler!
SKILLING:NASDAQ

now, we can see a strong sewing Now, as expected, we had a #pullback .
Somehow, it went a little longer and deeper than we expected
The 40W SMA is not in a downtrend and is flattening.
I think another positive swing is going to start. But it won't necessarily be a sharp one.

Nasdaq Composite dropping. IXICIt is appearing to be doing so along with the other major indices and there is plenty of data to speculate that the drop will continue technically and from a valuation standpoint. How low are we going? No one knows, but we have charted a few goals reasonable to us. A book can be written on how we derive the goals, so we won't bore you now.
We are not in the business of getting every prediction right, no one ever does and that is not the aim of the game. The Fibonacci targets are highlighted in purple with invalidation in red. Confirmation level, where relevant, is a pink dotted, finite line. Fibonacci goals, it is prudent to suggest, are nothing more than mere fractally evident and therefore statistically likely levels that the market will go to. Having said that, the market will always do what it wants and always has a mind of its own. Therefore, none of this is financial advice, so do your own research and rely only on your own analysis. Trading is a true one man sport. Good luck out there and stay safe.

Nasdaq at an area of valueNASDAQ:IXIC is at an area of interest, near a potential resistance level but also trading above a key MA. Friday close will be interesting, a solid close above this MA might bring a bull run. Failure to push up will bring us back to the boring "correction" environment. I'm rooting for the upside.

WORST yet to come. Crypto's bubble bursting? Maybe.Disclaimer: This is a Newbie analyses with no past Experience!
Don't get me wrong, I love everything about Crypto and appreciate being alive to witness this astonishing technology.
Some people have made fortunes, others lost fortunes and salute to those STILL HODLING. 2020-2021 was INSANE, everything was hitting the roof, people invested pennies and got rich. But this time its different, this year is different, I mean BITCOIN BTC is down 53%.
I CAN'T help but to think that we are witnessing something similar to the DOTCOM Bubble of the 90s. Where:
-Money was everywhere
-New start-ups were emerging everyday,
-Hell, NASDAQ reached 5048, at its peak, then plummeted to 1114 in Oct 2002.
Similarly,
-Money was everywhere in the Crypto space,
-People made 100x-1000x-10000x on their investments.
-A dozen of new projects are emerging every single day.
- BITCOIN soared all the way to 65k USD in 2021, and now potentially it might bottom out to 11k-12k zone.
All this, with what the world is witnessing, GLOBAL WARS, RECESSION and INFLATION, I think we are at verge of CRYPTO's bubble bursting. However, it is not all bad news, if this scenario is executed, then after the crash, only the strong, most promising and solid projects will SURVIVE.
NOTE:
For further observation, open the NASDAQ Composite MONTHLY chart, set the year between (1995-2003), and compare it to CRYPTO's Total (2018-2022).
This is not a financial advise!
Please comment your ideas about the analyses.
Appreciate your constructive comment and feedback in advance.

IXIC Buy AreaToday i think the Contrarian Investing is a good idea: "Buy When There's Blood in the Streets".
IXIC has entered the strong support/volume area which is a buy opportunity in my opinion for a reversal.
The next resistance is 13625.
Looking forward to read your opinion about it.

$QQQ Analysis, Key Levels and Targets. $NDX $TQQQ$QQQ Analysis, Key Levels and Targets.
I actually trade $TQQQ which is why I track here…
I’ll post again when target gets closer and it might be soon or not, but it’s coming… stay tuned…
GL
——————
I am not your financial advisor, but I will happily answer questions and analyze to the best of my ability but ultimately the risk is on you. Check out my ideas, but also do your own due diligence.
I have a huge tolerance for volatility so please know that. If you’re new to my trade setups please try them on a small scale first. Then go in with a risk you’re comfortable with.
I am not a bull. I am not a bear. I just see what I see in the charts and I don’t pay too much attention to the noise in the news.
If you want me to analyze any stock or ETF just leave me a comment and I’ll do it if I can. (If I have time)
And most importantly… Have fun, y’all!!
(\_/)
( •_•)
/ >🚀

Where it is Headed?We can not be sure whether Nasdaq will further or not, But if it falls 11,930 will be a major support.


nasdaq nas100 us100 This will be an interesting day, hit the premium point and head to the discounted point before heading to new premium zones.
