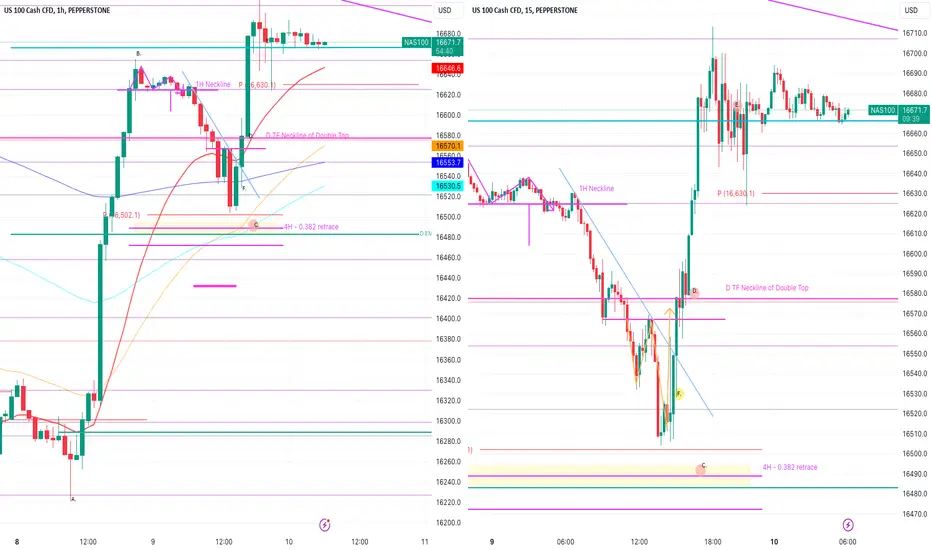
Nasdaq Intraday Review – Wednesday 10 Jan 2024I trade Nasdaq intraday exclusively
Trading in GMT time zone
Sharing my post day review & analysis in case it can help you :)
Did my analysis around 5:20am GMT.
At time of analysis, the following was noted:
Buy fib was drawn early this morning from swing low at A to swing high at B1…and then later in the day to swing high at B2. Retracement levels written in purple for B2 fib.
Fib levels were relatively close together with less than 600 pips separating the 0.383 and 0.618 levels. This means that one can usually go in with your full lot size because the potential draw down can be handled.
Market was consolidating into a descending triangle market pattern on both the 1H TF and the 4H TF (with double tops inside). This market pattern usually breaks down.
Bears indeed managed to break the neckline of the double top (shown with orange lines) and market moved down the same distance as the height of the pattern. Here, price found dynamic support from 1H 20 EMA and moved back up to test neckline of the 1H / 4H double top.
I usually like to be part of the restest of the neckline which is in the same direction as the overall trend (bullish in this case). This morning however, I was expecting market to move down further but when I saw the reaction to the 1H EMA, I entered.
I entered half my usual position size as a buy at C. (half because I was really expecting market to move down at least to pivot point).
Confirmations:
- Market Pattern: Bears had broken the neckline of the double top formed on the 1H & 4H TF. Price had travelled the profit target distance and was about to test the neckline of the market pattern in the same direction as the overall trend. Price was moving up and had closed above the neckline at C. on the 15min TF. Price had also broken back into the descending triangle indicating that the break out down was a fake out.
- Fib: None – this is the reason I entered only half a position because the 0.382 retracement level was at the pivot point this morning so this little market pattern break out was a very shallow retracement.
- Candle sticks & trend: The candle at C. on the 15min TF closed green forming a higher high after a series of lower highs indicating that the temporary down trend was possibly over (fully confirmed by the next green 15min candle which closed above the temporary orange down trend line).
- S&R: 1H 20 EMA providing dynamic support
Mental stop was placed at think pink line, because if price did not retrace by the 0.618 fib level and closed below the previous D neckline then a sell would ensue. I would have entered another half position of price moved down.
Market moved up 750 pips from my position and I secured at entry.
I knew a real fight between bears and bulls would take place at the purple down trend line. This line is draw on the wicks of the D candles from the D Double top.
The move I wanted to secure today was the bulls breaking this trend line. So I didn’t take profit at peak B2.
Price came down and took me out at entry.
After judging price action just before & during market open I re-entered at D.
I am now secured at entry and holding in case bulls break through the purple trend line.
So I will be out at entry with nothing or if the bulls break through, I suspect there will be a big move up and KA-CHING!!
Fingers crossed! Hope you had a good trading day too!
What could I have done differently:
So I was trying to adjust my stop loss of my C. position and all of a sudden my trade closed and also my swing trade from Sunday evening.
My C. trade was close to entry anyway so I wasn’t too worried about that.
But my swing trade closing by accident caused serious PANIC IN THE DISCO!!!!!
I usually set my profit to show as pips in MT5 (it’s a strategy to help me deal with greed and fear). So the whole time I was seeing my swing trade profit in pips.
When it suddenly closed, I saw the massive monetary profit in my equity and it totally threw me off! I was like “should I just keep the profit?? It’s so much money!”….”Maybe this happened for a reason”….”This wasn’t my plan at all but maybe now that I have the money banked I should just keep it”.
Eventually, after I calmed down, I re-entered my "swing trade". So now my swing trade will be two trades that I will combine in my trading journal and view ultimately as one trade. It was never my plan to close that swing trade at that moment. I decided to stick to my plan and even if market draws down and I ultimately make a smaller profit from this swing trade, it’s more important that I stick to my plan and close my trades when I want to close them based on price action.
So take a moment to think about what you will do if a trade closes by accident….having thought it through before the time will assist you in those critical moments when it happens to you.
TF = timeframe
TP = take profit
1H = 1 hour
4H = 4 hour
D = day
W = week
M = month
S&R = support and resistance
EMA = exponential moving average
Nasdaqidea

Nas Long SetupWent long on this setup as h1 is clearly bullish, expecting an expansion and for this low to stay in tact.

Nasdaq Intraday Review – Tuesday 9 Jan 2024I trade Nasdaq intraday exclusively
Trading in GMT time zone
Sharing my post day review & analysis in case it can help you :)
Did my analysis around 5:20am GMT.
At time of analysis, the following was noted:
A double top was forming on the 1H TF (marked with purple lines).
I knew that market would come down to test the neckline (marked in pink) of the D Double top that it broke through yesterday.
Drawing retracement levels in the charts in purple (swing low at A. and swing high at B.)
Noted that both the D 20 EMA and the 4H 20 EMA were close to the 4H – 0.382 retracement level. This created a strong area of confluence in my opinion (so I highlighted this area in yellow).
I set a buy limit at C. for half on my usual position size.
Mental stop was placed by the thick pink line, as this was also just below the 0.50 fib level so I would give my trade some breathing room in case market decided to test the 0.50 fib level.
Ultimately, market never reached my buy limit.
For me, today was a really important day for Nasdaq. If the bulls were not able to break the neckline of the D Double top that had formed previously, then we would see a further down swing of the market and a larger bearish pushdown.
With the candles, pivot point + EMAs + 0.382 retracement level below the neckline of the D double top (i.e. market had ALREADY broken below the D neckline), I felt unsure of a buy because the market was already in a risky area (below the neckline).
I entered a buy at D – Confirmations:
- Market Patterns: formation of double bottom on 1H TF. Entered when market had broken the neckline of the double bottom as well as the D neckline (marked in pink)
- Trend Line: D also represented the level where market had broken the temporary down trend line (marked in blue) and closed a higher high after a period of lower highs – signaling the end of the downtrend.
- Candlesticks: Strong green candle close on the 1H, breaking D Neckline
- Fib: Market had been down in the region of the 0.382 4H Fib retracement level and was now moving higher
Mental stop was the same.
Bulls continued the push up and eventually I closed my position in stages at E. as candles began consolidating at the level.
So that 933 pips profit for me today!
What could I have done differently:
I could have been more aggressive and entered at about F.
I already had a buy limit at C. so I was already willing to risk the buy from below the neckline at C. So when the double bottom started forming on the 15 min TF just above the level of my buy limit, I should have jumped in with my buy. But having to enter manually, I felt myself hesitating and being fearful that bears would step in at the neckline. Lesson to be learnt, if you have an ideal entry point where you set a buy / sell limit and then market forms a reversal pattern very close to your desired entry then jump in at that point and delete your pending order. If I had done that I would have had 511 extra pips in my pocket!
Hope you caught this nice buy!
TF = timeframe
TP = take profit
1H = 1 hour
4H = 4 hour
D = day
W = week
M = month
S&R = support and resistance
EMA = exponential moving average
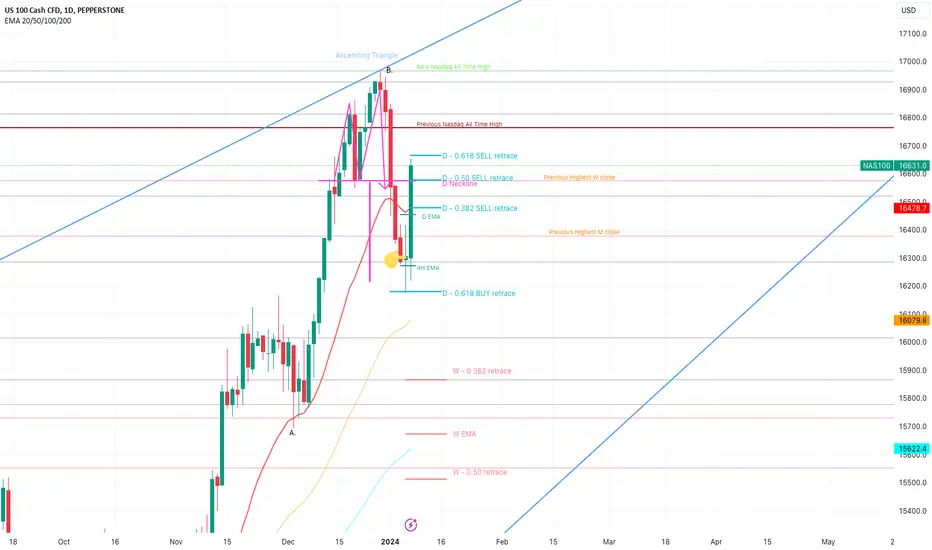
Nasdaq Intraday Review – Monday 8 Jan 2024I trade Nasdaq intraday exclusively
Trading in GMT time zone
Sharing my post day review & analysis in case it can help you :)
Today was a different day for me. I planned the trade I took today over the weekend.
Friday 5th Jan trading day ended with a green doji candle close on the D TF.
This D candle touched the 0.618 Fib level on the D TF and closed above the 4H 200 EMA.
To me this signalled the start of a bullish move, at the very least to re-test the neckline of the Double Top on the D TF (marked in pink).
I decided I wanted to enter a swing trade and so I stayed up late on Sunday evening and opened a nice big buy position in the seconds as market opened on Sunday 11pm GMT.
My swing trade buy confirmations:
- Market Pattern – double top had formed on the D TF and price had traveled the full distance of the profit target (i.e. the same distance down as the height of the market pattern). I like to enter a trade that will re-test the neckline in the same direction as the overall trend (bullish in this case if we assume that the bear move was just a retracement and not a full trend reversal. I will consider a full trend reversal to be in place if market tests the neckline of the double top and then moves down again).
- Fib – a strong fib level was reached on a high TF (0.618 on a D TF)
- Candle stick – green doji on a D TF
- S&R – 4H 200 EMA providing dynamic support to 2 x D candles
I funded my trading account with the amount of money I was prepared to lose and I would not place a stop loss. I correctly choose my position size to handle a drawdown of 1500 – 2000 pips and if my account bust then that would be the end of my swing trade.
All went according to plan, and I am currently on 3166 pips profit for the day.
I did close a small portion of my position to recover my small losses over the previous days and also take some profit for my efforts today. But the majority of the trade is running.
I secured my trade at entry and am now trading risk free.
The plan is to wait to see if bulls break through the neckline (so far so good, but I am expecting a bearish push down tomorrow to test bulls strength). Luckily pivot point + 1H, 4H and D 20 EMA’s will be under the candles hopefully giving a push up.
What could I have done differently:
I am happy with my performance today.
Hope you caught this nice buy!
TF = timeframe
TP = take profit
1H = 1 hour
4H = 4 hour
D = day
W = week
M = month
S&R = support and resistance
EMA = exponential moving average
7 Dimension Trade idea For Nasdaq 😇 7 Dimension Analysis
Time Frame: H4
1️⃣ Swing Structure: Bullish
🟢 Structure Behavior: Break of Structure (BoS)
🟢 Swing Move: Corrective move, indicating a Point of Interest (POI) for potential reversal. Vigilance is required for a bullish reaction at this level.
🟢 Inducement: Not done yet; waiting for a proper internal bullish BoS.
🟢 Internal Structure: Currently bearish, anticipating a shift with a bullish BoS.
🟢 Decisional Order Block: About to be mitigated.
🟢 Demand Area: Identified via FVG, indicating a discounted area.
🟢 Time Frame Confluence: Daily and H4
2️⃣ Pattern
🟢 CHART PATTERNS: No significant chart patterns observed.
🟢 CANDLE PATTERNS: Various signals: Record Session count, Shrinking long wick, Change in guard with engulfing, Doji, Momentum, Inside bar, and a blended combo suggesting a potential reversal.
3️⃣ Volume
🟢 Fixed Range: Bullish dominance in these areas.
🟢 Volume during Correction: Comparatively less during correction than in impulsive moves.
4️⃣ Momentum RSI
🟢 Zone: Extremely Bearish
🟢 Range Shift: Waiting for a potential shift from bearish to sideways. Two strong bullish divergences indicate weakness in bearish momentum.
🟢 Loud Moves: Conventional RSI theory suggests an extremely oversold market, possibly signaling a reversal.
🟢 Grandfather Father Son Entries: A robust 7-star buy signal.
5️⃣ Volatility Bollinger Bands
🟢 Price is already under the Middle band.
🟢 After a strong expansion, the market is moving into contraction, indicating a potential bullish sideways move.
🟢 Squeeze breakout awaited.
🟢 Walking on the band not yet.
6️⃣ Strength According to ROC
🟢 Values: Nasdaq shows the highest rate of bullish sentiment compared to all other indices.
7️⃣ Sentiment
Price action signals a clear long entry, but other dimensions like momentum and volatility tell a different story. Waiting for final volatility and momentum confirmation for a long position.
✔️ Entry Time Frame: H4
✅ Entry TF Structure: Bullish
☑️ Current Move: Corrective
✔ Support Resistance Base: FVG demand area
☑️ Candles Behavior: Bullish signals intact - RSC, Long wicks, Doji, Inside, Momentum.
☑️ FIB Trigger Event: Occurred
☑️ Trend Line Breakout: Breached but not confirmed.
💡 Decision: It's prudent to wait until the price provides a proper internal structure breakout. Once a bullish BoS is confirmed, consider a buy. I will update entry, take profit, and stop levels when triggered.
🚀 Entry:
✋ Stop Loss:
🎯 Take Profit: 2nd Exit if Internal Structure changes, also Exit 3rd Trendline Breakout, FOMO.
😊 Risk to Reward Ratio:
🕛 Expected Duration:
SUMMARY: The analysis suggests a potential bullish reversal but advises caution until the price demonstrates a clear internal structure breakout. Various signals indicate a reversal, and a detailed plan will be updated upon market confirmation.

NASDAQ Long Term Short PositionNAS moving in a parallel channel, getting resistance with bearish divergence on weekly time frame.
It's a long term trade so manage your risk accordingly.

Nasdaq 100 - Sell (Double Top, H&S Pattern, 0.618 Fib Extension)- Double top formation forming on the Daily/Weekly chart
- Head & Shoulders Pattern potential to form (2nd top in double top is the head of H&S patter)
- Price has reached Fibo 0.618 extension, potential area for reversal
- Mean reversion back to the long term trend line (excluding the inflationary impact of money
printing)
- News celebrating all time high, contrarian approach to avoid masses excitement/hysteria.

NAS100 TECHNICAL ANALYSIS Today is NFP and anything can happen, but according to my analytics that am using, which is universal to everyone, PRICE , PRICE MOVEMENTS , I would like to see a pullback to a Fib level 61.8 which perfectly fit with the previous resistance which is about to turn into Support if the level Holds.
If not then I will be buying at the support level, why? Because the Index have 2 weeks in range, no clear move, and will apply the simple approach or rule of thumb which say's "BUY LOW & SELL HIGH", in this in case, according to my understanding when the price is at support, with the right tools one always have a chance to buy.

NAS100USD ShortAccording to the index price movement, there is a formation of a rising flag, which might be a potential reversal hence a bearish momentum.
Also, there is a bearish dragonfly doji candle according to the higher timeframes (1D), which might be a potential bearish reversal in the price.
My entry point is at 15950 after the price has retested the support zone of the flag. SL at 16200, just above the resistance zone. Take Profit at 15200, with a R: R of 1:3.
Note, that risk is only 1% of your account.

NAS100 LONGTERM VIEWThis idea base on reversal, but im waiting for price to filled the imbalances below.
I will update this if this idea happens.
This is not a financial advice.
Follow for more.
Trade at your own risk.
For daily and weekly updates come and check me out.
Scalpers lets goo..

NAS100 BLOW OFF TOPI would like to believe that the road to the blow off top on NAS100 is beginning from today onwards. I've laid out my trading plan to long NAS100 in small quantities.
Ultimate blow off top will be in the high 17,000's; i plan to exit at around 16,800-17,000.

NAS100 4H NAS100 is in a bearish move over two weeks. LH and LL are keep forming. Now any signs of BOS (break of structure). There is a huge gap between last week High and last week Low. We can see a possible correction reversal move. A lot of imbalances are also to be taken out as we can see a lot of single print moves. This week we wait for FED decision about rates. Be careful with your trades and use tight SL.

NAS100 MID-WEEK ANALYSIS-24/09/2023NAS100: Exploring Potential Bullish Scenarios Amid Market Shift
The market has recently exhibited a notable shift in the NAS100 index, particularly on lower timeframes, which has piqued my interest in exploring potential buy opportunities. Join me in the quest to uncover emerging bullish scenarios for NAS100 and adapt our trading strategies accordingly. Stay tuned for ongoing insights and updates! 📈📊 #NAS100Trading #BullishScenarios #MarketShift
SAME BIAS AS US30 AND SPX500

Nasdaq Bearish-US100According to my analysis, the downtrend will continue, And the support zone where the price was supported in the previous two series. This series will be broken.
Follow for notifying more Analysis.
Boost, Comment for signal, and more.

Mirror strategy in a Ranging MarketNAS100USD has been Ranging between 15538 and 14556 since 18 Aug 2023. Here is our trading plan.
📣📈💹
Possible Path 1: To Upside
A Higher Low forms above the bottom of the Demand Zone (14826) ,
then attach the Supply Zone and Trend Line again.
Idea:
1. Long Entry when a Low formed above 14826.
2. Target to 15352 (Bottom of the Supply Zone).
3. Stop Loss below the Demand.
Risk and Reward 1:3 to 1:4
📣📉💹
Possible Path 2: To Downside
Straightly break the bottom of the Demand Zone (14826), then formed a Lower Low below the Demand Zone.
Idea:
1. Short Entry when a Lower Low formed below 14826.
2. Target to 14557 (Day Low on 18 Aug).
3. Stop Loss above the Demand.
Risk and Reward 1:3 to 1:4

NASDAQ 05/10 MovePair : NASDAQ - US100
Description :
Impulse Correction Impulse , Correction in a Corrective Pattern " Bearish Channel " and Completed ( 123 / AB / WX ) Corrective Wave and Bullish Channel in Short Time Frame if it Breaks the Lower Trend Line then Short

NAS100When you understand the game, you don't panic.
.
.
.
.
.
.
🧅Disclaimer :There are risks associated with investing in securities. Investing in stocks, bonds, exchange traded funds, mutual funds, and money market funds involve risk of loss. Loss of principal is possible. Some high risk investments may use leverage, which will accentuate gains & losses. Foreign investing involves special risks, including a greater volatility and political, economic and currency risks and differences in accounting methods. This is Not Financial Advice
🧅JUST AN OPINION OF THE ONION.🧅

NAS100 SHORTExpecting a short in price Current price at 14788.6 expecting a break and close below 14658.2 zone for a sell off to 14545.8 ---- 14437.4 zone.

NASDAQ on the riseOk so we have a lovely completed bat on the NASDAQ, personally, I like TP1, TP2 I will be bringing up my SL after Tp1 hits.
Have a look into correlation, it's very important. You see I'm waiting to add further sells to my gold trade, and seeing the Nasdaq going up makes me happy.
Published 22 Sept 2023 09.15am UTC+1

NASDAQ Breakout TradeNASDAQ wait for breakout and trade in the direction of breakout or place your buy and sell stop.
Manage your risk according to account size!

Nasdaq Push before fall? Just looking at Price ActionBased on a higher timeframe I speculate that Nasdaq could push up higher towards 15360.5 as this price range falls into equilibrium based on the High to the Low left on the 4hr timeframe from last weeks price action.
I can also clearly see that price swept previous lows on a 1hr & 4hr timeframes.
with this information I jumped to a 5 minute timeframe, and can clearly see Friday of last week price left a beautiful displacement high, and a Fair Value Gap where Sunday price went to trade down towards 15203.4 testing the FVG once more.. giving me confirmation of price wanting to push higher.
So my full idea is that ill wait for price to go towards 15360.5 area to look for a short position.
Remember this is all just my personal conclusion..

Overall Market Analysis Tickers: SPX, NAS100, SPY, QQQAs we step into the second week of September, we've observed a promising start with some key indices showing positive momentum.
NAS100 & QQQ Analysis:
- The tech-centric NAS100 and QQQ began the week on a brighter note, showing green after a bearish week.
- Tomorrow's Key Levels for NAS100: Watch for a potential break above the 15,500 level. A decisive move above this can pave the way for a rally towards 15,750. On the downside, failure to maintain above 15,500 might trigger a pullback.
- Tomorrow's Key Levels for QQQ: It's crucial for the price to find solid footing at the 375 mark. This level should act as robust support.
SPX & SPY Analysis:
- Key Levels for SPX: We're keenly watching the 4500 resistance level. A break and hold above this could signal further upside. However, the 4475 price point is expected to offer support should the momentum wane.
- Key Levels for SPY: Bulls would want to see a break above the 450 level, while 445 stands out as the immediate support.
Stay tuned for further updates and adjust your trading strategies accordingly. Always remember to manage your risks and trade safely!

BTCUSD Parallel Channel Breakout TradeNASDAQ wait for breakout and trade in the direction of breakout or place your buy and sell stop.
Manage your risk according to account size!
