NASDAQ Breakout Long! NASDAQ broke the
Resistance cluster of the
Falling and horizontal level of 15396.5
And the breakout is confirmed
Because the candles are closing above
the cluster so now
I am bullish biased
And I think that the Indices
Will go higher up !
Nasdaqidea

NAS100 Anticipating a Reversal from Resistance ZoneHello traders, this is my view on NAS100.
NAS100 is likely to reverse from the resistance zone. I believe it will fall after taking out BSL (buy-side liquidity). The reason for this idea is that NAS100 has perfectly created an inducement at 15,930.90, near the weekly timeframe CoG (Center of Gravity) at 16,099, and then it fell. Now, it has returned again to create a buy trap for retail traders. I think it will fall strongly after hitting BSL, which is at 15,796 on the 1D timeframe and 15,926 on the weekly timeframe. I'm looking to short it from the range of 15,800 to 15,940.
"Please do support and engage with this analysis by giving it a follow and a like if you find it valuable. Your support helps us continue to provide insights into the market. Thank you!"

NASDAQ Forming Head and Shoulders ReversalNASDAQ Daily
*Note: This is an update to our previous analysis that will be linked below
Price Chart
The NDX is currently trading within an upward channel (Yellow Solids), and has recently tested the bottom trend line a fourth time; the more price retests it the weaker it becomes. This has also formed what could be the neckline (Teal / Red Solid) to a head and shoulders setup and has pushed the price past the mid-point (Teal Dotted) of the double top; which would also be the head. EMA's on the other hand have failed to cross lower with the 12-day and 26-day recrossing higher. Also notable is the spike in selling pressure on July 21; which is the same area the NDX is currently trading.
Relative Strength Indicator
There is a divergence (Teal Solid) from the price which lead to the trend line (Yellow Solid) breaking and the RSI dipping below the 50 level. The RSI has since recovered, however it's re approaching the trend line for a retest.
On Balance Volume
Similarly to the RSI, the OBV has also shown a divergence from the price and moved lower past the mid-point (Teal Dotted) in the double top. After a bounce at the support (Red Solid) the indicator is moving higher to retest the mid-point.
TLDR;
The market is showing strength, but a head and shoulders pattern is possibly forming as outlined above. RSI and OBV are both signaling higher, however, the indicators are nearing a trend line retest and level of resistance respectively. If price action moves past the head then we have an invalidation, but look for lower buying volume in the beginning of September to signal the formation of the shoulder.
What Seems Legit?
Um, not our portfolio if Mr. Market keeps running away from our targets; the market has been on a tear since the reversal in Dec / Jan. I mean, how many times have you heard those Bloomberg boys on the radio be like "omg markut go zhoom moar! wuuuuut?!", then the analyst comes on and is like "OH YEA NO U GOTTA DEPLOY CASH HERE I MEAN U CANT SIT ON THE SIDELINES LIKE WE CALLED THE BOTTOM AND NAO U GOTTA BAI". Layin' it on a little thick, text book transfer of wealth. Let's see if we get that head and shoulders.
Follow us on Twitter for memes, market moves, and not so headline news.
Chart Key
Yellow Solid = Major Trend Line / Channel
Red Solid = Support / Resistance
Teal / Red Solid = H&S Neck Line
Aqua Solid = Divergences
Teal Dotted = Midpoint Resistance
White Dotted = Invalidation of H&S
Green Boxes = Supports / Target Areas

NASDAQ Short Term Sell IdeaH4 - Bearish trend pattern followed by a potential double wave correction.
No opposite signs.
I expect the price to move lower further in the short term until the two strong resistance zones hold.

Nas100 OutlookNas is looking like it is re-accumulating atm but it could turn on a dime and all of a sudden become a distribution schematic so pivot areas are indicated in the annotations on the chart. Just watch out for what price action does in the next coming weeks along the key areas and levels as it will be pretty telling if we are going to start a meltdown soon or if we are going to have a last push to the top most quarter key level.
A H&S pattern looking formed atm. Could melt, could not, we will see.

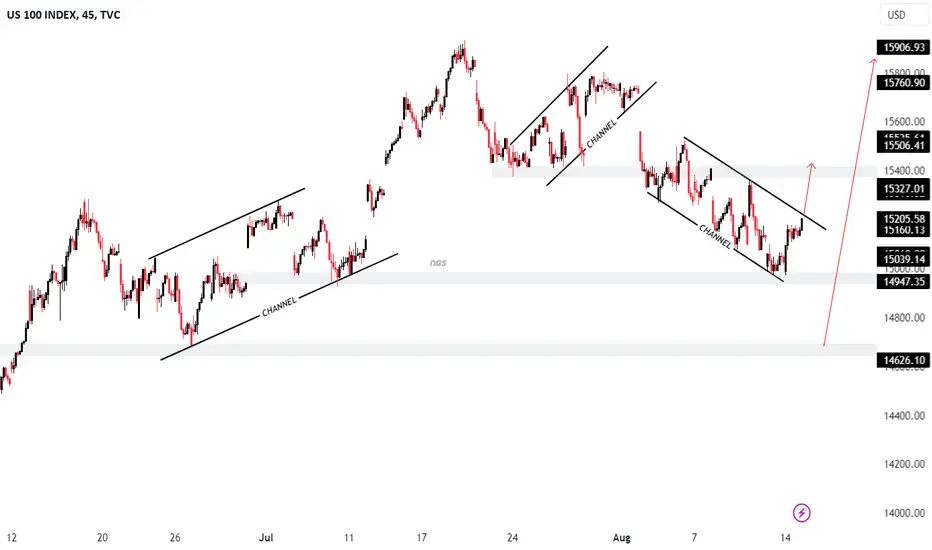
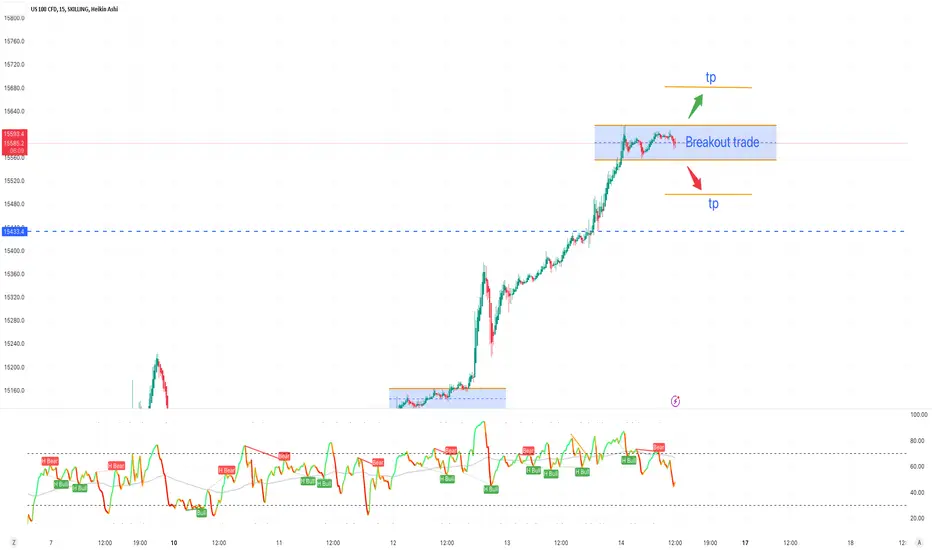
NASDAQ Breakout TradeNASDAQ wait for breakout and trade in the direction of breakout or place your but and sell stop.
Manage your risk according to account size!

NQ Outlook and Trade Ideas for the WeekNQ Outlook and Trade Ideas for the Week
Everything presented in the chart.
I don't want to overcomplicate it.

NASDAQ 23-08 MovePair : US100 - NASDAQ
Description :
Support Level
Completed " 1234 " Impulsive Wave
Bearish Channel in STF as an Corrective Pattern
Break of Structure
Divergence - RSI

NASDAQ US100 15-08 MovePair : NASDAQ - US100
Description :
Bearish Channel in Short Time Frame as an Corrective Pattern
Break of Structure
RSI - Divergence
Demand Zone
Completed " 1234 " Impulsive Wave
NASDAQ Moving LowerLooks as if a double top has formed after the recent melt up and a secondary trendline has been broken (solid yellow). Used RSI and OBV here to show the deviation from the price action solid red). The current trendline of the RSI has broken down and has bounced lower off the 50 level while the OBV sits right on it's current trendline. Price action has seemingly failed to make a higher high and is accompanied by higher recent selling volume. Current support levels are shown as dashed lines (yellow to red) With the red box being the strongest support and current target.
The Short Term - Looks as if we return to the primary trendline of the melt up (teal solid) to see if we get a breakout or a fake out. Mom's allowance money for this week says we make that move lower due to the above analysis and since RSI was rejected off the 50 level.
The Long Term - Shows price action moving back towards and testing the 200-day MA with the battle between the 50-day and 200-day to follow afterwards. Death cross = doom and gloom, bounce = hao in the NHL did u guise pull ths off?
TDLR; Bearish Deviations - Price action moves down to the teal solid line then towards the 200-day MA. Red box is the current target. Stay tuned to see how mad mom gets if the market takes our allowance money.
None of this was meant to be financial advice, but still seems pretty legit

NAS sell on US session?PEPPERSTONE:NAS100
Hey, today with something special
This idea will be ICC based so lets get into it
How u can see trade from yesterday on nas was 0 drawdown so hope today will be same
For valid trade price cant go over last high whats around 15230.
Then we want to see break of last low and close candle under it
SL can be on last high. For TP1 we will be reaching last low (15100) candle close (15080) wick
Around this zone we can close partials or watch what price do, if we break under we can hold until new low will be made
Just wait for US Session
I took 2 trades like this on nas with high reward so i hope nas make the same move even when i share it with you.
Shoutout to SCI

NASDAQ Will Go Down!NASDAQ broke the support
Cluster of the rising and
Horizontal lines at around
15432 so we are now
Bearish biased and I will
Be expecting a move down!

NQ1! NAS100USD NASDAQ 2023 JULY 31
NQ1! NAS100USD NASDAQ 2023 JULY 31
A) Market facing resistance at 16030-15904 area
B) Fallen out of uptrend channel | | Lower High
C) Rotation between 16030 - 15511
D) Weakening upward momentum on W / D timeframe
Possible Scenarios:
1) Rotation strategy: Trade at boundary 16030 | 15904 and 15511 (grey zone 390 - 500pts range).
Target can be 50% of range or trail to rotation boundary.
Price Reaction Levels
Short on Test and reject | Long on Test and Accept
16646 16030 15511 15118
*Longer term: 13350 needs to be supported for long trend to be intact.
Price/Volume/Trend Analysis:
Weekly: Narrowing spread ave vol up bar = weakening momentum
Daily: Lower vol up bar close off high = minor weakness
*NTC = Non-Trend Changing | PTC: Potential Trend Changing
Like and follow if you find this useful | *For education purpose only.
Have a profitable trading week.

nasdaqIt is placed in a resistance zone, which if it wants to make a correction, it can correct up to the lower green line

US100 tradeafter liquidity taken of the buy side and rejection of FVG we will see a drop of the price to wards sell side zone

NASDAQI Also Want To See The Nasdaq Trading Lower This Week, They Can Trade Up To Take That H4 Liquidity Above That High.
Or They Can Run Out Today's Lunch Hour Highs Then Sell Off.
Do Remember To Use The S&P500 And The Dow Jones Index For SMT Divergence.

NASDAQI Also Want To See The Nasdaq Trading Lower This Week, They Can Trade Up To Take That H4 Liquidity Above That High.
Or They Can Run Out Today's Lunch Hour Highs Then Sell Off
Do Remember To Use The S&P500 And The Dow Jones Index For SMT Divergence.

NASDAQ Breakout Trade PlanNASDAQ moving in range now wait for breakout to trade or place your buy stop and sell stop.
Manage risk according to your account size.
Nasdaq's Rebalancing of Fabulous 7 Tech Stock so CautionRecent news concerns Nasdaq's decision to rebalance its equal weighting for the Fabulous 7 tech stocks. While this may seem like a routine adjustment, I urge you to exercise caution and remain skeptical about future stock returns and performance.
It is no secret that the Fabulous 7 tech stock has been the talk of the town lately, capturing the attention of investors worldwide. Its remarkable growth and seemingly unstoppable momentum have undoubtedly piqued the interest of many. However, as seasoned traders, we must be aware of the hype and excitement surrounding these stocks.
Nasdaq's decision to rebalance the equal weighting of the Fabulous Seven tech stock raises concerns and warrants a closer examination of the situation. Why would such a move be necessary if everything was going swimmingly? It is essential to question the motives behind this adjustment and consider its potential implications on the stock's performance.
While rebalancing can be a regular part of market operations, it often signifies a shift in the underlying dynamics of a stock. It is crucial to remember that past performance does not guarantee future success. The Fabulous Seven tech stock's meteoric rise may have been impressive, but more is needed to ensure continued growth or prosperity.
As traders, we must remain vigilant and not mindlessly follow the crowd. While the Fabulous Seven tech stock has undoubtedly provided lucrative opportunities in the past, it is crucial to approach future investments with a healthy dose of skepticism. We must carefully analyze the potential risks and rewards, considering the rebalancing decision and its impact on the stock.
In conclusion, please proceed cautiously regarding the Fabulous Seven tech stock and any future investments. Nasdaq's rebalancing decision serves as a reminder that the market can be unpredictable and subject to sudden changes. Let us remember the importance of conducting thorough research, diversifying our portfolios, and making informed decisions based on careful analysis.

NASDAQNASDAQ PM SESSION TRADE SETUP, This Is Basically What I Think May Happen But Price Can Still do Otherwise As It Is Currently Bullish, This down move would a retracement if it isn't yet complete which I think it isn't.

US100 TRADEAfter change of character and retracement to fill fvg we will see a down trend towards kill zones for Asia and London Session

AMD | JULY - W3 | Bullish $122 CallingAMD is likely to to get drive for the bulls. Expecting the target of $122.

TESLA | JULY - W2 | BearishTesla is expected to fill up the FVG after taking the highs of previous week.
