My NQ Long Idea 5/5/2025Been a while but I haven't been posting ideas because I have been scalping and doing smaller time frame trades. I think we have NQ at a nice price level where we might see a bull run soon with the market sentiment slowly "thawing" on the idea of "risk-off" sentiment to "risk-on" sentiment and environment with more uncertainties clearing out of the market scenes.
We have US trying to negotiate deals with many countries including China which is very challenging and we can never know if it will be achieved or not. However, from an economic point of view we can agree that the US economy is in the Neutral-bullish. We have a very bullish price action in the past week or so. We also have healthy economic numbers but it is still unclear until Wednesday.
On Wednesday the FED will speak on this matter and give us some clarity on whether it is a Risk-on or Risk-off environment. Anything will happen but I can see the "Gap" getting filled on FED day due to the SPIKE that will be delivered to us.
Currently Edgefinder tool is giving us 8 for NQ with only the GDP and sPMI scores in the negative. However the net score is bullish and on the positive.
I think 1 of those two ideas will be played out sooner or later anything can happen but from a technical view I would like to see the price reaching the 50% FIB and then take off from there.
It is subjective though and everything in trading is subjective including what I do and say.
Nasdaqlong
Are You Ready For Nasdaq Next Flight ? 500 Pips Waiting For Us !Here is my opinion on Nasdaq , i think we have a very good closure and we can say we will go up for sometime in the next few days , so i`m waiting the price to go back to my support area ( Lower One ) that already broken , and then we can enter a buy trade and targeting 500 pips . also if the price touch the higher place and give me a good bullish price action , we can enter a buy trade with small lot size and if the price go to the lower one we can add one more contract .
NQ for the weeki don't see a lot of options for shorters here if you didn't catch the move, possibly you can you get some short in lower time frame toward that ray i pointed out there, some options if you want to buy is wait for that thursday low get taken and patiently wait for a reversal. IF today have been this volatile, i don't suggest to trade tomorrow.
NAS100 Rebound Setup – Bulls Gaining Strength Again?The NAS100 has bounced strongly from the high-volume demand zone (16,700 – 17,800) highlighted by LuxAlgo's Supply and Demand indicator. The current price is consolidating near 18,700, building momentum for a potential breakout.
Key Technical Zones:
Demand Zone: 16,700 – 17,800 (high buy interest)
Support Level: 17,828.9
Resistance 1: 20,350.6 (first upside target)
Major Supply Zone: 21,775.4 (big decision point for bulls)
Bullish Outlook:
Price has reclaimed the 17,828.9 support and is forming higher lows.
A strong break above 19,000 could send price to test 20,350, then possibly 21,775.
Green arrows show the bullish potential if price holds above support.
Bearish Risk:
A breakdown below 17,828.9 could signal a return to the demand zone.
Watch for rejection candlesticks or divergence signals near resistance.
Volume Profile Insight:
LuxAlgo's visible range shows strong buyer interest below 18,000, indicating institutions may be accumulating positions.
---
Trade Idea: Look for a confirmed breakout above recent highs near 18,800 for long entries. Conservative traders may wait for a pullback to 17,800 for better risk-reward.
---
What’s your take on NAS100? Will buyers push it to 20K+ or is this just a trap rally? Share your thoughts below!
#NASDAQ #US100 #NAS100 #IndexTrading #SupplyAndDemand #LuxAlgo #ForexAnalysis #StockMarket #TradingView #TechnicalAnalysis #BullishSetup
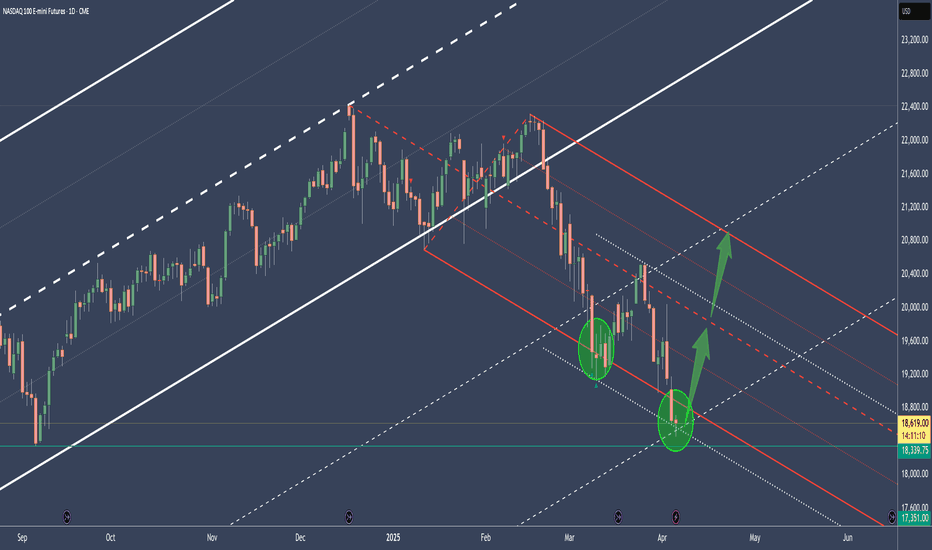
NQ - Nasdaq's potential to reboundThe Median or Centerline:
The Median (Centerline) Line is the central element of the Pitchfork and acts as the equilibrium point. Price tends to oscillate around this line, and it often serves as a strong reference for potential reversals or price targets. A price move back toward the Median Line is common after significant moves away from it.
Pitchfork (Red):
The red Pitchfork, drawn through significant price points, provides the overall trend direction and shows the potential path to the downside. The red line indicates a bearish bias in the current setup, as it has been guiding the price lower.
Green Circles and Arrows:
These represent key areas of support.
The lower green circle and green arrows indicate price has found solid support in this region. The price has been bouncing from this support level, showing that it is reacting to the [ower boundary of the Pitchfork. This behavior aligns with the rule that the price tends to respect these boundaries, creating a foundation for a potential move back toward the Median Line.
Price Action Analysis:
The price recently tested the lower green circle and green arrows, bouncing off this support level, which is a typical reaction in a Pitchfork setup.
According to the Median Line theory , when the price moves too far away from the Median Line, it often returns toward it. Therefore, the bounce off the lower boundary suggests that price may now be setting up for a bullish reversal toward the RED Median Line .
Bottom Line:
The price action is following the general Pitchfork playbook . The bounce from the lower green circle suggests that the price is setting up for a potential bullish reversal toward the RED Median Line .
The next major test will be the upper resistance in the red Pitchfork , after the break of the Centerline. If the price can break through this resistance, a strong move higher is likely.
Keep an eye on this critical point!
NAS100 Testing Demand Zone – Major Reversal or More Drops? 📊 Market Overview:
The NASDAQ 100 (NAS100) just tested a strong demand zone (18,900 - 18,950) and is showing signs of a potential reversal. Can buyers push the price higher, or will bears take control?
🔹 Key Resistance Levels: 19,568 | 20,160
🔹 Current Price: 18,977
🔹 Key Support Levels: 18,896 (demand zone)
📉 Price Action Breakdown:
1️⃣ Sharp Drop into Demand Zone
Price recently fell from 19,568 after failing to break higher.
Buyers are now defending the 18,900 support zone, which has historically held strong.
2️⃣ Bullish Reversal Setup?
If the price holds above 18,900, we could see a bullish rally toward 19,568.
A breakout above 19,568 may open the way for 20,160+.
3️⃣ Bearish Breakdown Risk
If the price drops below 18,896, expect further downside towards 18,600 - 18,500.
Sellers would regain control, confirming a bearish continuation.
📊 Trading Plan:
📍 Bullish Case:
🔹 Look for bullish confirmation in the 18,900 - 18,950 zone.
🔹 A strong bounce could target 19,568, then 20,160.
📍 Bearish Case:
🔹 If price fails to hold 18,896, a short setup targeting 18,600 - 18,500 is possible.
🔹 Wait for a clean break & retest before shorting.
🔥 Will NAS100 bounce back from this demand zone, or will sellers dominate? Drop your thoughts in the comments! 👇
📊 Like & Follow for more trade insights! 🚀
#NASDAQ100 #TechStocks #Trading #StockMarket #SupplyAndDemand #Forex #PriceAction
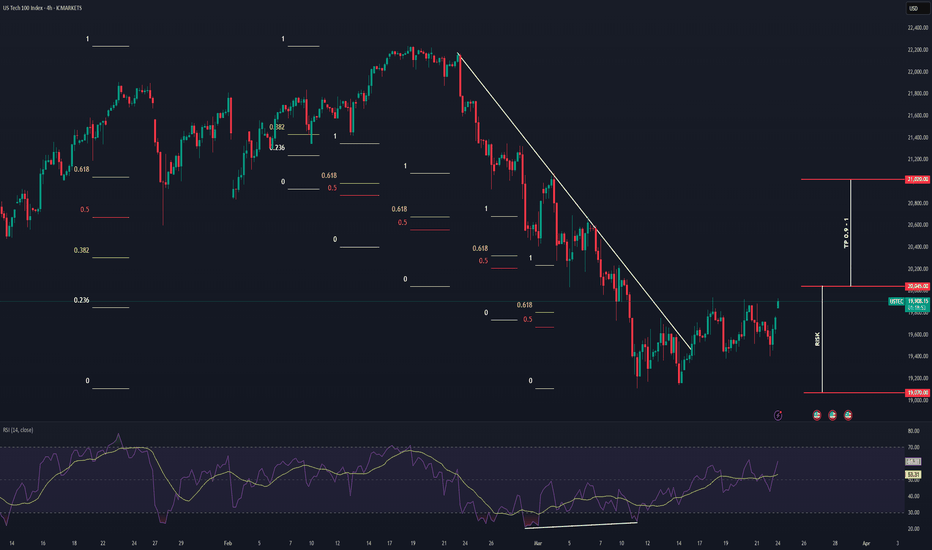
NASDAQ Bullish Reversal (Potential Tariff Resolution?) NASDAQ price action went through a massive correction with a drop from the top worth approx. 14%.
However after the passing of the latest FOMC Meeting, we may finally see a direction towards the resolution of widespread tariff based uncertainty across the macro economic landscape.
This presents us with a potential Reversal opportunity if we see the formation of a credible Higher High (given a potential proper break out) on the 4 HR and shorter timeframes.
Trade Plan :
Entry @ 20045
Stop Loss @ 19070
TP 0.9 - 1 @ 20923 - 21020
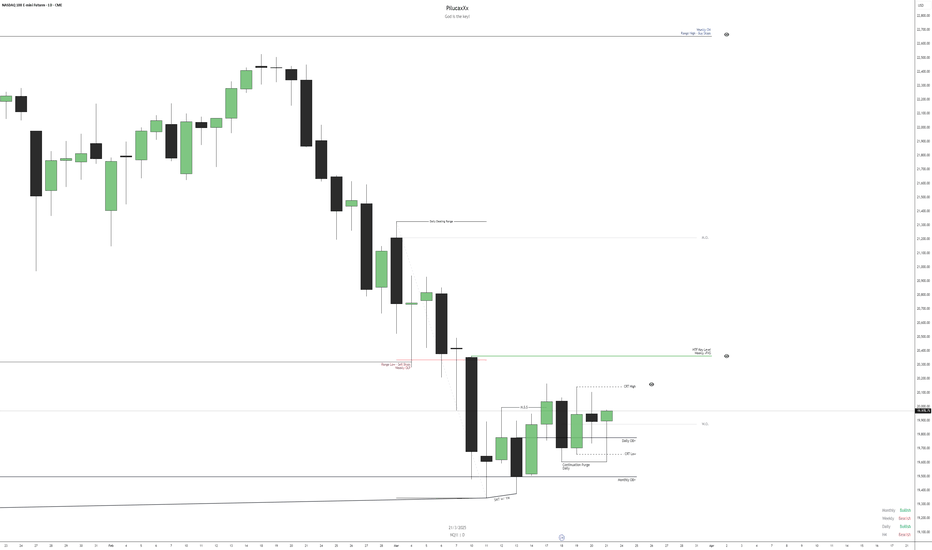
$NQ IdeaAnalyzing the NQ for the upcoming week, we observe that the price held at the monthly OB, where an SMT also formed, reinforcing the indication of a bullish continuation from that point.
On the daily chart, we identify a shift in market structure, evidenced by the presence of an SMT + MSS, followed by a continuation purge of the price. Given this, we understand that our weekly DOL will initially be the daily CRT High and the Weekly FVG, although the final target may be the monthly Range High.
Additionally, based on the economic calendar, we anticipate more significant movements on Monday, Thursday, and Friday due to news related to the dollar.
It is important to emphasize that this analysis is based solely on price action, and macroeconomic factors may impact the market throughout the week. Therefore, we must be prepared for potential changes in the scenario.
Nasdaq Intraday TradeWith the overnight GAP, price jumped above the white Centerline, just to come back in the Asia session.
We see that price broke the white CL and halted afterwards. Do yo see where it halted? Yes, at the Centerline of the yellow Momentum Fork!
And currently it's pushing up through the white CL again...hmmm...
So, we have momentum, clear support at the yellow CL, a potential new push through the white CL and a loooooot of Air...and stop/losses above to be sucked in §8-)
I'm long with a stop below the yellow CL low, and with multiple targets to the upside.
Let's have fun!
QQQ - Nasdaq has reached it's firstPrice reached the Warning Line 1.
This is a natural support, because it's a standard deviation stretch. From here, price has a high tendency of mean-reversion.
How far?
Most of the time it shoots back to the Lower-Medianline-Parallel.
Beware of the potential resistnace zone.
This level is a good one to take partial profits.
As for a stop, I would put it below the last swing-long. I may play it with Options (for example a Risk-Reversal), giving me more leeway to the downside if it's not playing out immediately.
NASDAQ100Hello friends
Our ascending channel had a strong break and considering the negative news, how far do you think the decline will continue?
The support levels identified can help you trade, but we need to see where the price will go with the news that will be announced this week...
*Trade safely with us*


