Nasdaq 100 Head and ShoulderHaving studied Nas100 for sometime now, I've noticed that it has a bullish turning movement of a head and shoulder. Expecting the market to correct/pull back into 4H demand before continuing to break all time highs. Expecting move from now until early next week, latest Wednesday.
Nasdaqlong

NAS sitting on the fenceWith NVIDIA earnings due, NAS seems to be sitting on the fence in terms of direction, so I am considering all options
Feel free to comment what your thinking or what i've missed

NAS100 - MONDAY'S SMALL SHORT FOR BIG LONG! (TARGET 17265)As you might have noticed, the Nasdaq is on fire and I'm more of a reversal trader so times are harder. But, there is an old saying that states: "the trend is your ". I forgot the rest but I'll let you figure out the last word. So in homage of this old saying, we'll tighten our bullish running shoes and propose a setup that satisfies both camps. Here's what I see happening on Monday (29/01/2024):
What is on the chart? (follow the steps)
1) We have our liquidity target level which gave place to the continuation of the rally. So far so good for bulls, price is going up and their net worths too.
2) Our first reversal structure, with a low taken out and the high intact.
3) This is our retracement signal, confirming the market structure shift to the downside. This is paired with the fact that price broke the hourly Tenkan and Kijun + the Tenkan and the Kijun crossed over + breaking the Kumo + breaking the latest low. Additionally, the 4H Kijun and Tenkan reside within the 1H Kumo so those too were broken (not shown on the chart to promote clarity). These are reliable reversal signals. I am not trying to be a contrarian against the general trend but, this is how we spot general highs and lows. The daily is simply bullish so it's harder to spot a minor intraday opportunity such as this one.
4) This rejection confirms our reversal idea, and strengthens the probability of sellside liquidity getting taken out.
5) This is our final target, ideally the 1 Hour FVG. Again, on Monday anything can happen of course but this seems the most likely. I want these lows taken out before anything and, therefore we can short in anticipation of these lows getting taken out!
Most importantly, take some rest and have a great weekend! ;)

Nas Long SetupWent long on this setup as h1 is clearly bullish, expecting an expansion and for this low to stay in tact.

NASDAQ is going to pull back to the bottom of the broken channelWhen NASDAQ index reached the midline of the main historical channel, the hammer landed on its head. Then the bottom of the ascending channel was lost and now it is pulling back to the bottom of the broken channel with the confirmation of the indicator for a pullback.
The predicted route is specified.

Nasdaq weakness before Christmas?Nasdaq weakness before Christmas?
Barely hanging on to gains in a streak lasting ten days, US stocks managed to recover from initial losses and were trading slightly higher on Wednesday. The attempt to secure a tenth consecutive session of gains pushed the Nasdaq 100 to a new record high of 16,830.
In December, the Nasdaq has seen an increase of over 5%, and its performance for 2023 stands at 43%, on track for its best year since 2020. These gains can be attributed to expectations of the Federal Reserve cutting interest rates next year. Additionally, positive economic data this week exceeded expectations, with existing home sales unexpectedly rising and CB consumer confidence experiencing its most significant increase since early 2021.
The NAS100 Index is currently trading above both the 200-day and 50-day moving averages, indicating a bullish trend. However, it is not far from yesterday’s close which raises caution, as it could suggest either a consolidation phase or a potential reversal.
In the short term, there may be some weakness targeting the 16,750 area and 16,400, the latter being the level where consolidation occurred at the beginning of December before the most recent upward movement.

NDX Broke Double Bullish Pattern, 16600 SoonDear Traders,
NDX broke the falling channel (long purple trendlines) and then repeated a breakout from the falling wedge (short purple trendlines).
I believe NDX can continue its rally because MACD turned bullish, and I can see a confirmed bullish cross on the RSI. The price is above EMAs, and the volume is high enough for the continuation. I believe the target could be around 16600.
NDX is also overbought. While I expect further upside, traders without an existing position from lower target prices could wait for a corrective retracement to enter.
Kind regards,
Ely

UPDATE: Nasdaq easily heading to first target 16,956Similar to Dow Jones, the Nasdaq is heading to our initial target of 16,956.
Also formed a Cup and Handle. Also above the 200MA.
Also moving based on the fundamentals of weaker US dollar and slow down in interest rate hikes.
Also, with AI tech and EVs taking over control with many different companies in some ways or another, we can expect the tech boom going into 2024.
All the reasons to stay bullish and optimistic.
Or am I just feeling the festive season too much?
You let me know!

US100 SHORT, NASDAQ SHORTPrice has recently into an area of resistance, I'll be expecting price to trade down as marked on the chart. My setup for the week to come until take profit is hit. HAPPY TRADING


NAS100 MID-WEEK ANALYSIS-24/09/2023NAS100: Exploring Potential Bullish Scenarios Amid Market Shift
The market has recently exhibited a notable shift in the NAS100 index, particularly on lower timeframes, which has piqued my interest in exploring potential buy opportunities. Join me in the quest to uncover emerging bullish scenarios for NAS100 and adapt our trading strategies accordingly. Stay tuned for ongoing insights and updates! 📈📊 #NAS100Trading #BullishScenarios #MarketShift
SAME BIAS AS US30 AND SPX500

Nasdaq NQ1!) - LONG ... Then Short!This thing is taking off here, as expected. Load up!
The chart ought to be self explanatory. (March is usually bad for equities, just keep that in mind.)
USD strength is major factor here which should keep a nice strong lid on this, later on.
Here is a closeup;

E-mini Nasdaq MONSTER LONG Setup (ABCD Completion)Looking at a potential MONSTER move on E-mini NASDAQ
Market bottomed out and using our Fib calculations we would see a strong Extension from here (ABCD pattern Completion) that would take is to 15497.75 for 470+pts of profit potential... I have engaged position LONG at 15012.5 and am holding on strong... A lot is riding on TESLA Earnings tonight, followed by Jerome Powell tomorrow at 12pm EST if all goes well we will be running for new Highs in my opinion!

NQZ2023 LONG for SWING opportunity (Bigger Picture)Looking at new analysis for E-Mini Nasdaq. Looking at probe down into Bullish orderblock with suggested entry range 14923-15028 LONG and will be looking for upside Target potential of 15665-15670

Long RKLB - RocketlabsLong RKLB, had a good short from the monthly highs I should have held longer, not complaining but yah live and learn. See triple bottom/I h & s here. Longing with tight stop. Not advise, good luck.

Nasdaq Bounce from L-MLHWhat a drag yesterday.
The red Fork gives us very good context.
We see how price reacted two times at the Center-Line.
Then came the "Flush" throu the CL with no pull-back.
No Mercy!
This move brought us down to the Lower-Medianline-Parallel. From here price starts to bounce.
It's also a level where NQ had support (see left side).
So far, divergence with the RSI is confirming a good potential for a bounce.
But I don't believe in this support, until we break the downsloping "Change In Behaviour" line. Price must prove that is has enough strenght.
If this CIB line gets broken, I expect a pullback to it.
This would be the level where I would stalk a long entry, with a target at the Center-Line.
Happy Hump-Day Tr8dingN3rds

NASDAQ Breakout Long! NASDAQ broke the
Resistance cluster of the
Falling and horizontal level of 15396.5
And the breakout is confirmed
Because the candles are closing above
the cluster so now
I am bullish biased
And I think that the Indices
Will go higher up !

Nasdaq: Continuation of an uptrendThe Nasdaq continues its upward trend, breaking the correctional trendline and forming new highs. Therefore, I expect it to target the all-time high.
If you find it useful, like, follow, share!
Good trading!

NQ Outlook and Trade Ideas for the WeekNQ Outlook and Trade Ideas for the Week
Everything presented in the chart.
I don't want to overcomplicate it.

NASDAQ 23-08 MovePair : US100 - NASDAQ
Description :
Support Level
Completed " 1234 " Impulsive Wave
Bearish Channel in STF as an Corrective Pattern
Break of Structure
Divergence - RSI


NASDAQ 100 LONG SET UP SWING TRADE (1000 PIPS INCOMING)Hey folks! hope you have all been bagging some green pips. Interesting times are lying ahead of us as some juicy set ups are cooking and we just need to continuously be disciplined and patient. On the menu today is NASDAQ 100 swing trade that has been in a Multi year uptrend.
looking at the 4 hour chart, we see that price broke structure to the upside indicated (BOS).
Price has now made its way back down to the origin demand level that caused the break of structure.
This makes demand level a point of interest and may mean potentially price can mitigate the zone and can begin to accumulate positions around the zone to begin travelling back up north of about 1000 pips. Am already in with a small position and will only be adding more positions when price has given more confirmations but for now its still a risky set up. Overall this could be a set up of about 1:6 risk reward ratio.
Remember to always apply proper money and risk management in your trade set ups.

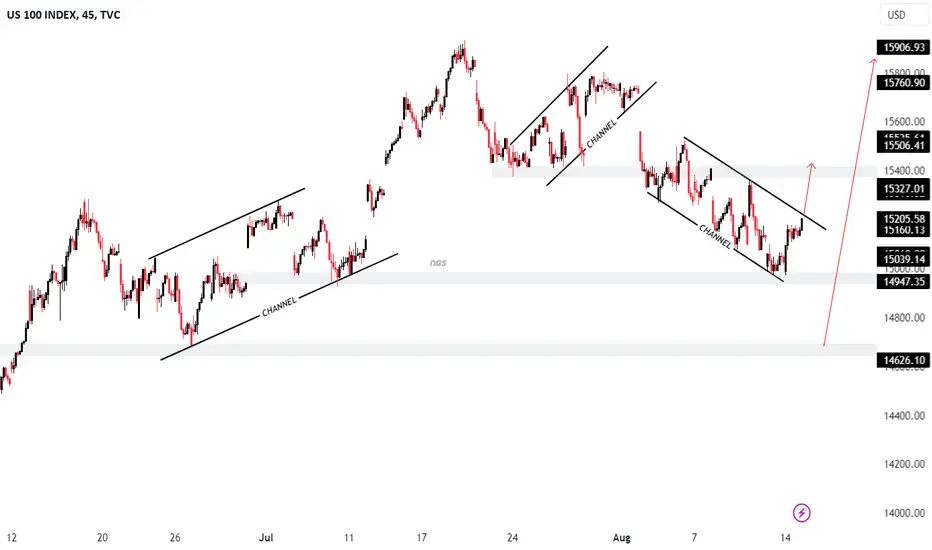
NASDAQ US100 15-08 MovePair : NASDAQ - US100
Description :
Bearish Channel in Short Time Frame as an Corrective Pattern
Break of Structure
RSI - Divergence
Demand Zone
Completed " 1234 " Impulsive Wave