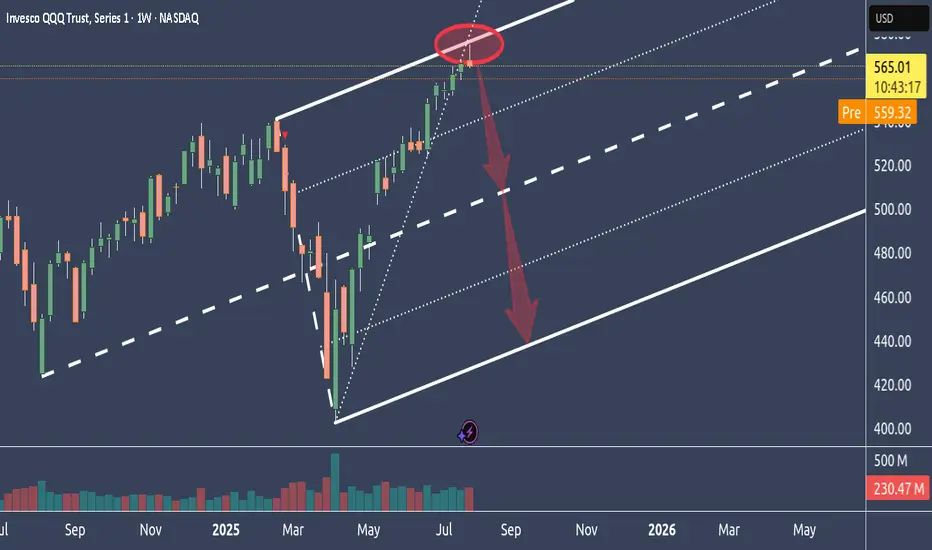
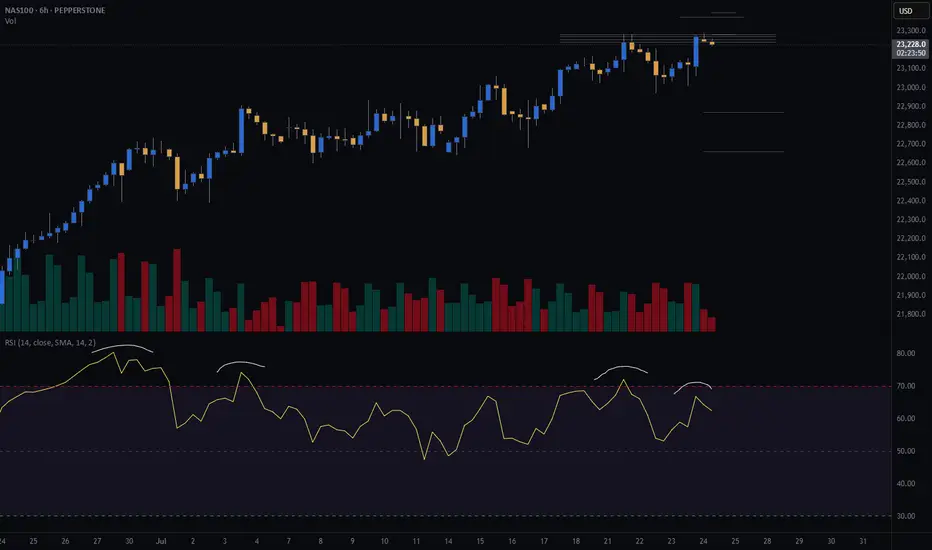
Why NQ is probably tanking big timeIn this weekly chart, we see QQQ, which represents the Nasdaq.
As we can see, it had a hell of a run up.
Too far too fast IMO, and it reached the stretch level at the Upper Medianline Parallel.
The natural move is now to let go, take a breath and trade down to center again, which is the Centerline.
After all the most major and most important earnings results are over, and Funds have pumped up their gains through manipulative Options plays, it's time to reap what they have planted and book the gains.
It's all in line with, all moves are at the point, and everything is showing in a simple chart.
Unless price is opening and closing outside of the U-MLH, it's time to load the Boat and sail to the South.
Nasdaqshort
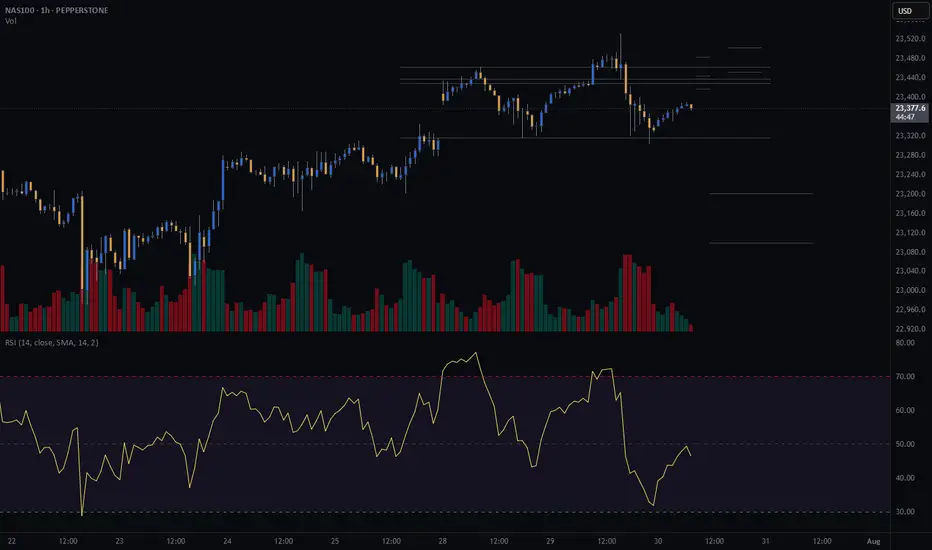
NAS - LET'S MAKE MILLIONS Team, last night NAS I was expect the FALL BACK as I predicted rate un-change will get NASTY on both DOW AND NAS.
So I have a set up entry LONG, i didnt expect the NAS flying to the moon.
both target hit so fast in 15 minutes
However, today is another opportunity to SHORT NAS on the current market at 23613-23625
STOP LOSS AT 23720
Once the NAS pull back toward 23580-65 - BRING STOP LOSS TO BE
TARGET 1: at 23540-20
TARGET 2: at 23480-65
LETS GO

CASH100 (NASDAQ) CRASH - Head and shoulders Risk/reward = 3.7
Entry price = 23 430
Stop loss price = 23 503.2
Take profit level 1 (50%) = 23 202
Take profit level 2 (50%) = 23 099
Still waiting for some variables to confirm before entering the trade
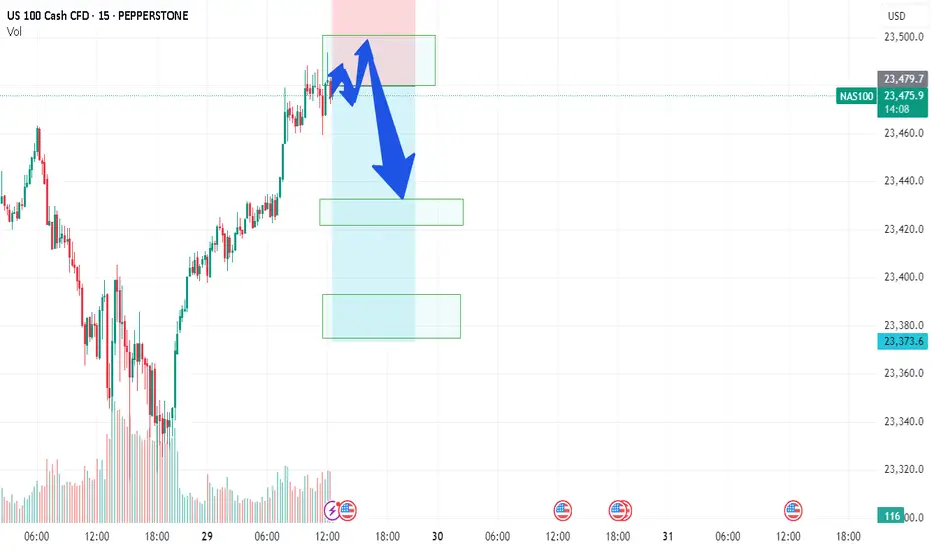
NAS/TEC100 - LETS GET NASTY ON NAS100Team, NAS currently sitting at 23480, before the US market open
however during the market open, please be aware of the volatility that may hit your stop loss
You have 2 options to trade on this NAS- NASTY
Option 1: wait for market open, if it hits 23500-23515 - then short with stop loss at 23580
Option 2: Short at the current market with small volume - and if the market open with volatile, you can take another advantage of shorting more volume as per option 1 instructed.
OK, pick your strategy! do NOT be shy.
I am going to have small short position and will consider adding more during US market opening after 5-10 minutes, much easier to see the direction of the market - we do LIVE trading everyday. Please note: if NAS fall below 23450-40 bring stop loss to BE (Break even)
1st TARGET range: 23435-23416 - make sure take 70% volume
2nd target at 23390 to 23376
Why do I short on NAS when tomorrow rate decision, i think this quarter report, market will not be the same as last quarter, even rate cut!
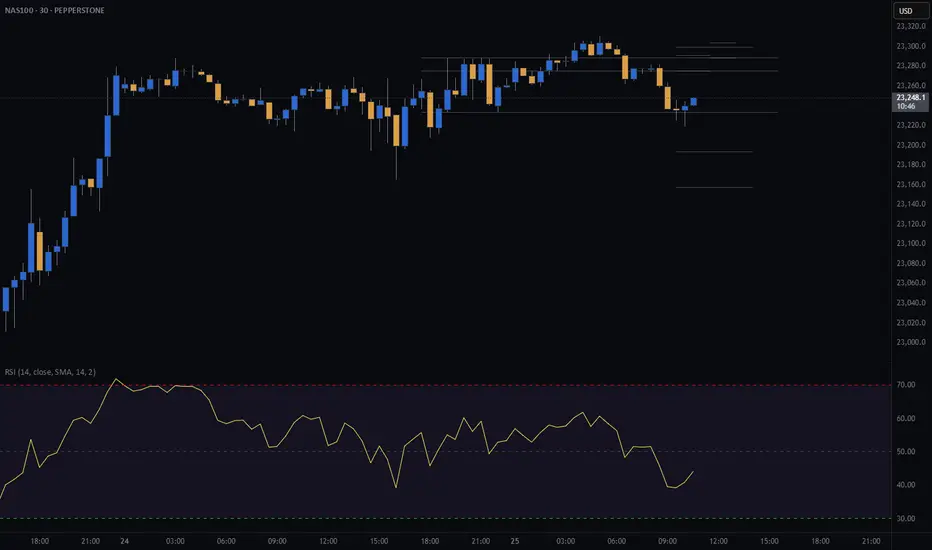
NDX (NASDAQ) CASH500 SHORT - Head and shoulders 30minRisk/reward = 3.2
Entry price = 23 275.7
Stop loss price = 23 303.9
Take profit level 1 (50%) = 23 193
Take profit level 2 (50%) = 23 157
Waiting on confirmation on a number of variables before entering the trade.
NASDAQ (CASH100) SHORT - double top H6Risk/reward = 4.3
Entry price = 23 282
Stop loss price = 23 398
Take profit level 1 (50%) = 22 871
Take profit level 2 (50%) = 22 663
If current H6 goes back into range, I will open short position.
All variables on checklist have been met.
I was out last night so I missed my initial entry. Hoping for a second chance.
Hopefully this short works because the last few higher time frame short setups have failed, although because of exit plan I have made very little losses.
NASDAQ (CASH100) SHORT - Head and shoulders H1Risk/reward = 3.8
Entry price = 23 167.9
Stop loss price = 23 232.8
Take profit level 1 (50%) = 22 943
Take profit level 2 (50%) = 22 878
Still waiting on confirmation on some variables in checklist

NASDAQ (CASH100) SHORT - Double TOP H4Risk/reward = 11.3
Entry price = 23 190
Stop loss price = 23 270.4
Take profit level 1 (50%) = 22 674
Take profit level 2 (50%) = 22 053
All variables met, and entered the trade.
What is everyone's thoughts on shorting or longing cash100?
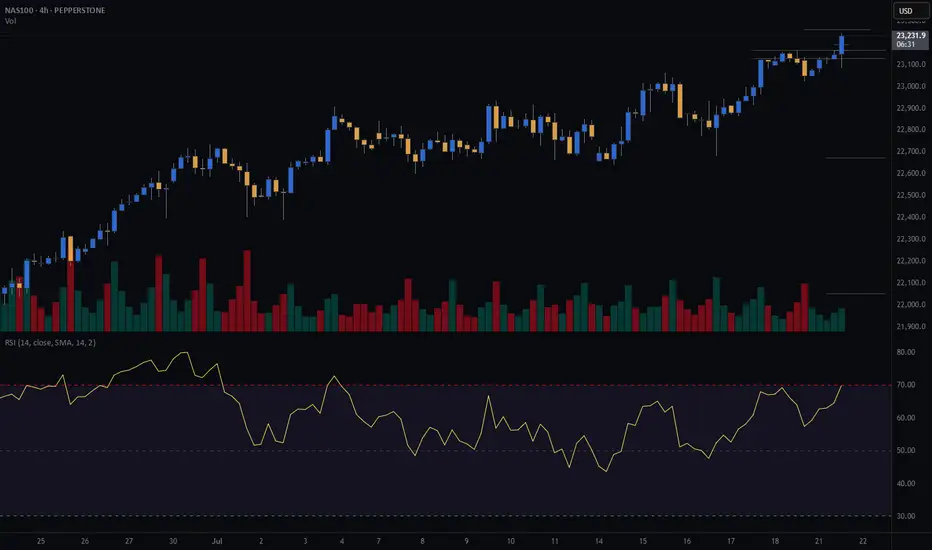
NASDAQ At Good Res , Is It A Chance To Sell To Get 200 Pips ?Here is my 4H Nasdaq Chart and my opinion is the price at very interesting selling area for me , this Res Area forced the prices to go down 2 times and i think this third time will be the best one , so i`m waiting the price to go up a little to retest the res one more time and then we can enter a sell trade and targeting from 100 to 200 pips . the only reason to cancel this idea if we have a clear daily closure above my res area .

Nasdaq ready to dropwe can see the formation of a ressistance zone in daily, and as we explore the chart the best trade for todaty is a short.
targets are in green. entry zone in blue.
have fun
all details are explained in the video.
Elektra

NAS100 sell setup15 min supply zone engineering during market open yesterday will be the key trigger for todays sell off

NASDAQ Potential Bearish Reversal Analysis NASDAQ Potential Bearish Reversal Analysis 🧠🔻
The chart illustrates a potential bearish setup forming after a recent uptrend in NASDAQ. Let's break it down professionally:
🔍 Technical Overview:
Ascending Trendline Break ✅
Price had been respecting a steady ascending trendline.
A break below this trendline indicates a possible momentum shift from bullish to bearish.
Bearish Pattern Formation 🔷
A bearish flag/pennant-like formation can be observed after the sharp rise.
This consolidation followed by a breakdown could be a continuation pattern, hinting at further downside.
Resistance Rejection 🔴
A red arrow marks a clear rejection from the resistance zone near 22,800 USD.
Strong wick rejections and bearish candles suggest selling pressure at that level.
Support Turned Resistance (SUPPOT 🛑)
The previously broken support zone is now acting as resistance (note: "SUPPOT" appears misspelled—should be "SUPPORT").
Bearish Target Zone 🎯
The chart marks a "TAEGET" zone (should be "TARGET") near the 21,900 – 22,000 USD range.
This aligns with prior consolidation and demand zones, making it a likely area for price to retrace.
📌 Key Zones:
Resistance (Rejection Area): 22,800 USD
Current Price: 22,739.7 USD
Bearish Target Zone: 21,900 – 22,000 USD
⚠️ Conclusion:
The market shows signs of a bearish reversal with a confirmed trendline break, resistance rejection, and bearish pattern formation. If the price fails to reclaim the 22,800 level, there’s a high probability of downward continuation toward the 22,000 target.

Nasdaq 100 Trade idea for the day and bias.This is what I'm expecting Nas100 to do today looking at the higher timeframe structure.


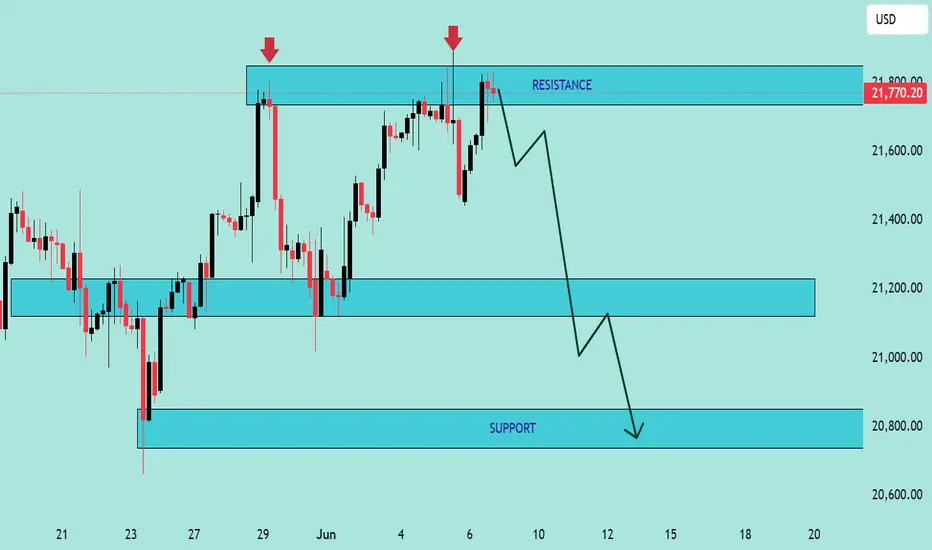
NAS100 Technical Analysis – Bearish Rejection at ResistanceNAS100 Technical Analysis – Bearish Rejection at Resistance 🚨
📅 Date: June 6, 2025
📈 Instrument: NAS100 (US Tech 100 Index)
🔍 Chart Overview:
The price action shows a clear rejection from the 21,800 USD resistance zone, marked by two strong bearish wicks (indicated by red arrows 🔴). This level has proven to be a strong supply zone, as sellers repeatedly step in to push prices lower.
🔵 Key Zones:
🔺 Resistance Zone: 21,750 – 21,800 USD
✅ Multiple rejections and bearish pressure.
🔻 Support Zone 1: 21,100 – 21,200 USD
📍 Acts as a mid-range demand zone and a potential take-profit level for short positions.
📉 Support Zone 2 (Major): 20,700 – 20,850 USD
📦 High-probability bounce area due to historical demand.
🔄 Price Action Insight:
The chart outlines a bearish double rejection pattern at the resistance level.
The current candlestick setup suggests bearish momentum, with a potential drop toward the mid-support zone.
If the price breaks below the mid-support, it could cascade down toward the major support near 20,800 USD.
📌 Projected Move:
🔻 From current levels (~21,750), expect:
Pullback from resistance,
Target 1️⃣: 21,100 USD zone,
Target 2️⃣: 20,800 USD major support.
🚫 A clean break and close above 21,800 invalidates the bearish outlook and may trigger a bullish continuation.
✅ Conclusion:
The chart favors a short bias below the resistance zone. Patience is key—wait for confirmation (like a bearish engulfing or break of structure 📉) before entering positions.
📊 Always use risk management. Set stop-loss above resistance in case of reversal.
NASDAQ100 Analysis – Key S/R Zones & Price Reaction Incoming! NASDAQ100 Analysis – Key S/R Zones & Price Reaction Incoming! 🚨
🔍 Chart Breakdown:
This is a technical chart analysis of NASDAQ100 (NAS100) with defined Support and Resistance zones. The price is currently at 21,314.50, sitting below a critical decision area.
🧱 Key Zones:
🔵 Resistance Zone:
‣ 21,640 – 21,800
‣ Strong supply area where price sharply reversed previously.
‣ If price breaks above the mid resistance zone, a bullish move towards this level is likely.
🟩 Support + Resistance Flip Zone:
‣ 21,280 – 21,420
‣ Former support, now acting as resistance.
‣ Price is struggling to reclaim this zone.
‣ Acts as a key decision level.
🟢 Support Zone:
‣ 20,630 – 20,750
‣ Strong demand zone from which previous rallies initiated.
‣ Target if bearish rejection continues.
🔄 Price Action Insight:
Price is currently rejecting the Support-turned-Resistance zone.
There’s a clear bearish rejection at the mid-zone (S/R flip), forming a lower high structure.
📉 A breakdown from current levels could lead to a retest of the support zone at 20,700 area.
🟢 However, a successful reclaim and bullish confirmation above 21,420 could see price target the upper resistance at 21,800.
📌 Outlook:
🔽 Bearish Bias if price fails to break above 21,420 – possible drop to 20,700.
🔼 Bullish Reversal above 21,420 could drive price to 21,800.
📅 Date: June 1, 2025
🕒 Timeframe: Likely 1H or 4H chart
💬 “Respect the levels, not the noise.”
Trade safe! ✅

Nasdaq analysis: 29-May-2025Good morning, everyone! Today's Nasdaq analysis is designed to educate and empower. Use these insights to refine your price action trading strategy.


(NQ) | Strong Buyers and Blue‑Box Entry Zones(NQ) | Strong Buyers and Blue‑Box Entry Zones
NQ shows powerful buying pressure, and the marked blue boxes highlight areas where demand has reliably appeared. For those seeking long exposure, two approaches stand out:
Low‑Time‑Frame Breakouts from the Blue Box
Wait for price to dip into a blue‑boxed support zone and then break higher on shorter time frames. A decisive move with rising footprint volume confirms genuine buyer commitment.
Direct Low‑Time‑Frame Breakouts
If price skips a pullback and powers upward on low‑time‑frame charts, that momentum surge—backed by substantial volume—also provides a valid long entry.
Key Considerations
Ensure any breakout is backed by real volume footprint signals, not just price movement.
If these zones fail to hold or volume dries up, stand aside and await the next confirmed setup.
By focusing on these blue‑boxed areas and insisting on volume‑confirmed breakouts, you align your entries with where buyers truly dominate.
📌I keep my charts clean and simple because I believe clarity leads to better decisions.
📌My approach is built on years of experience and a solid track record. I don’t claim to know it all but I’m confident in my ability to spot high-probability setups.
📌If you would like to learn how to use the heatmap, cumulative volume delta and volume footprint techniques that I use below to determine very accurate demand regions, you can send me a private message. I help anyone who wants it completely free of charge.
🔑I have a long list of my proven technique below:
🎯 ZENUSDT.P: Patience & Profitability | %230 Reaction from the Sniper Entry
🐶 DOGEUSDT.P: Next Move
🎨 RENDERUSDT.P: Opportunity of the Month
💎 ETHUSDT.P: Where to Retrace
🟢 BNBUSDT.P: Potential Surge
📊 BTC Dominance: Reaction Zone
🌊 WAVESUSDT.P: Demand Zone Potential
🟣 UNIUSDT.P: Long-Term Trade
🔵 XRPUSDT.P: Entry Zones
🔗 LINKUSDT.P: Follow The River
📈 BTCUSDT.P: Two Key Demand Zones
🟩 POLUSDT: Bullish Momentum
🌟 PENDLEUSDT.P: Where Opportunity Meets Precision
🔥 BTCUSDT.P: Liquidation of Highly Leveraged Longs
🌊 SOLUSDT.P: SOL's Dip - Your Opportunity
🐸 1000PEPEUSDT.P: Prime Bounce Zone Unlocked
🚀 ETHUSDT.P: Set to Explode - Don't Miss This Game Changer
🤖 IQUSDT: Smart Plan
⚡️ PONDUSDT: A Trade Not Taken Is Better Than a Losing One
💼 STMXUSDT: 2 Buying Areas
🐢 TURBOUSDT: Buy Zones and Buyer Presence
🌍 ICPUSDT.P: Massive Upside Potential | Check the Trade Update For Seeing Results
🟠 IDEXUSDT: Spot Buy Area | %26 Profit if You Trade with MSB
📌 USUALUSDT: Buyers Are Active + %70 Profit in Total
🌟 FORTHUSDT: Sniper Entry +%26 Reaction
🐳 QKCUSDT: Sniper Entry +%57 Reaction
📊 BTC.D: Retest of Key Area Highly Likely
📊 XNOUSDT %80 Reaction with a Simple Blue Box!
📊 BELUSDT Amazing %120 Reaction!
📊 Simple Red Box, Extraordinary Results
I stopped adding to the list because it's kinda tiring to add 5-10 charts in every move but you can check my profile and see that it goes on..

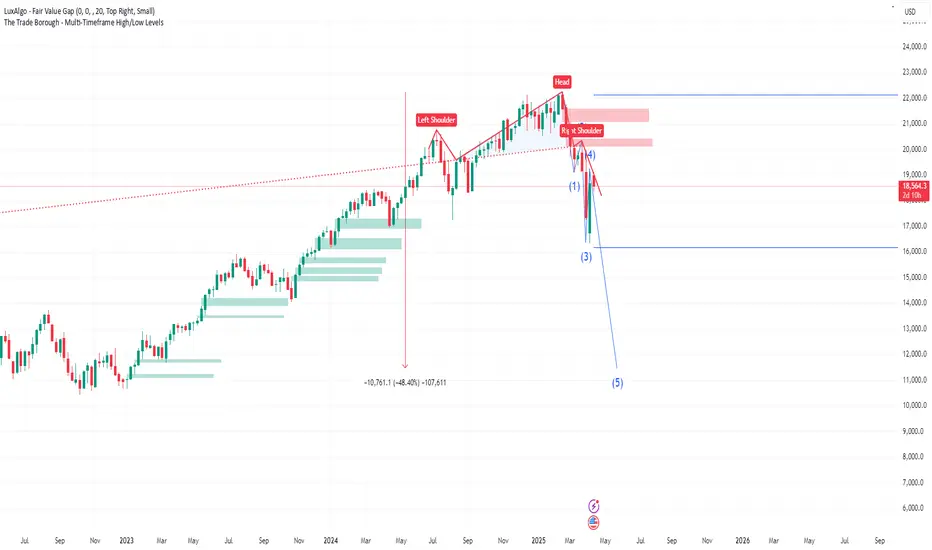
No shampoo in sight.....and an $11k Nasdaq?This posts presents an idea that has no precedence (that I can recall at least), so this is by definition a crazy idea BUT the chart is showing signs of extreme exhaustion and is possibly and quite frankly on the verge of a potentially destructive collapse.
If the recent severe volatility hasn't peaked your attention... this chart should.
It's quite simple...we have a MONSTER Head and Shoulders pattern on the Weekly TF...and we're finishing off the Right Shoulder! From a chart pattern perspective, this is ultra-ultra bearish.
The confluence we have is the Elliot Wave showing the we could be about to enter Wave 5. Elliot Waves are of course subjective BUT in this case its syncs with the Head and Shoulders.
If this was a 15min chart, most would probably agree hands down, but this is a Weekly Chart and represents Trillions on Trillions so its hard to believe that this could even be a possibility.....but I believe it could happen!
The horizontal blue lines provide 2024's High and Low Price. For this disaster scenario to be avoided, the Bulls and anyone who cares must defend 2024's low around 16100. This must not be breached, to keep the 12M bullish structure in place.
The green shaded areas highlight all of the Buy Side fair value gaps on the WEEKLY TF going back to early January 2023!
Could the market dive for these in devastating fashion? Only time will tell.
In the interim, we should trade safe and manage risk as best as we can.
NASDAQ Breakout Done , 5oo Pips Waiting For Us , Are You Ready ?Here is my opinion on Nasdaq , we have a stop hunt very clear and then we have a very good breakout with amazing bearish candle , so i`m waiting for the price to go up a little to retest the broken support and new Res , and then we can enter with good bearish P.A And Targeting from 300 to 500 pips .

Nasdaq market analysis: 23-APRIL-2025Good morning Dear Traders! Join me for Nasdaq market analysis for today. Share your charts, ask questions, and let's discuss trading strategies.

Nasdaq insights: 16-APRIL-2025Good morning, traders! As a seasoned price action trader, I'll share my Nasdaq insights to help you improve your trading skills.
