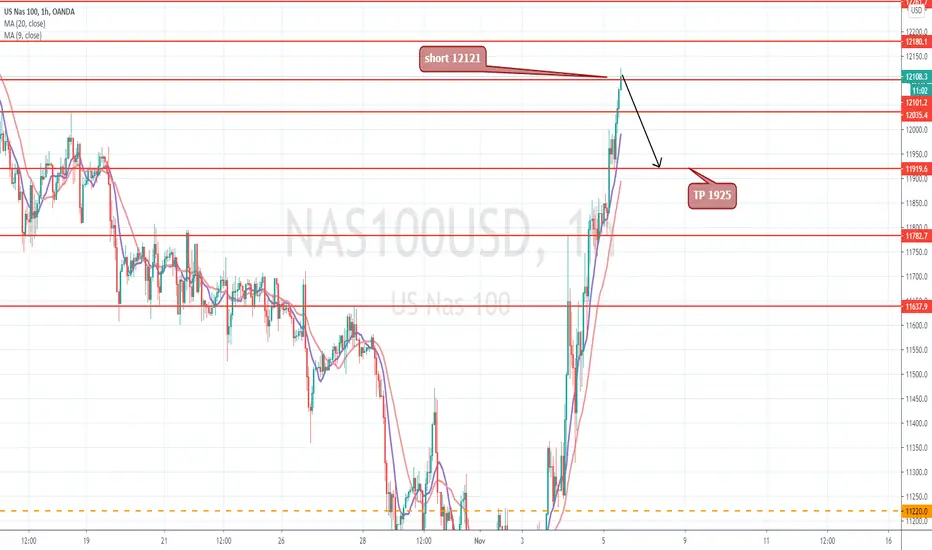
SHORT INTRADAY AT 12121 AND TAKE PROFIT AT 11925SHORT INTRADAY AT 12121 AND TAKE PROFIT AT 11925
mARKET UP ON bIDEN wIN BUTR REMEMBER HE WANT TO UP THE TAX ON TECH
ANYWAY I ONLY PLAY THE PULLBACK FOR NOW BEFORE THE FOMC/FED OR ANY NEWS ABOUT SENATE OR HOUSE FOR ELECTION
WHILE HE WILL TOUCH MY TP I WILL NOT CUT BUT MADE A TRAILING STOP
SO I ENTER WITH 2 X1 LOT
THE FIRST LOTR I WILL CUT ATR AROUND 12000 FOR FULL PROFIT AND THE OTHER I WILL PUT A STOP AROUND 12080 AND EVERYTIME IF HE DOWN I WILL ADJUST IT
Nasdaqshort
NASDAQ - Possible correction inboundChart is self explanatory. also look at our previous ideas on Nasdaq here

NAS100- Weekly Review Weekly NASDAQ Pip Review
Monday: +181
Tuesday: -40
Wednesday: +182
Thursday: +260
Friday: +222, -40
Blues: +845
Reds: -80
Total: +765 Profit
Total NAS Trades: 6 Trades
Have a wonderful weekend guys!!!
Thats its guys on nasdaq only 6 trades taken this week. 4 win trade and 2 loss trades which made 765 pips. My stop loss are always 40pip, Loss is so minimal that the wins overpower them any day. And thats how easy trading should be.

NAS100 AnalysisNAS100 Analysis
Hi Guys, So earlier today it broken through the middle of the channel, didn't bounce and come back down. So it went to my first target 11589. If we get a break here im hoping for 11741 which is a strong resistance even on the daily. we may even get a retest of the middle channel line before going to 11741

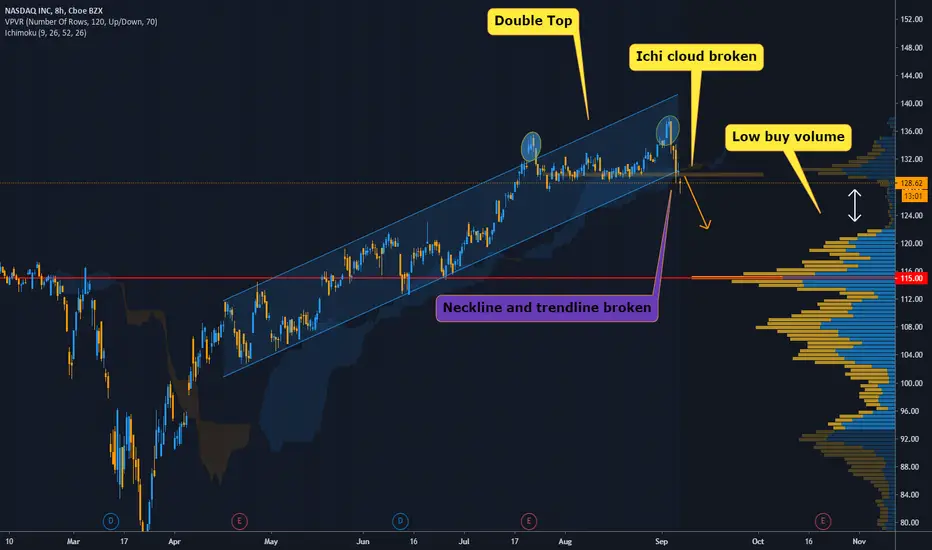
Nasdaq double topThere mostly likely will not be a stimulus bill before the election. That means we are headed down.
I've shorted the N100, Initial target is .382 retracement but I think we will at least touch the .618 retracement before this is over.
GLHF.

NAS100- Weekly review and a quick overview- MUST READWeekly Pip Review
Monday: +89, +114. -40
Tuesday: +136, +101
Wednesday: +161, +136
Thursday: +90, -40
Friday: +82, -40
Blues: +909
Reds: -120
Total: +789 Profit
Total NAS Trades: 11 Trades
Hi guys Hope you all had a good trading week. Trading is all about having a plan and trying to execute it. A beautiful quote comes into my mind "A fool with a plan can beat a genius with no plan". If you learn to plan your days and follow good risk mangement strategy then you will only trades opportunities and not get into revenge trading, rush trading, blind trading etc. All my trades are well planned. I dont get 100% win ever but my losses are all controlled max 40 pips. Those who learn from me know i always recommend max 40-50pip stop. And thats how you become a winner, by protecting your capital. If you take 10 trades then you should aim to win 7 of them. you should not lose 9 trades out of 10.

NAS100- TP HITHope you all had a great day yesterday. it was just too easy. If you followed my analysis it when right up to 11618.


NAS100 AnalysisNAS100 Analysis
Aim for Bear is 11619 - 11482 (see the daily to understand why this area)
Bulls -Current market may just be a pullback and a break of 11870 will bring the bulls back in to continue.

Sell Opportunity on NASDAQ Nasdaq could not break our resistance area at 12188.7 that area was tested three times and after that it formed a doji candlestick telling us that the market has change direction and sellers are in control now

NASDAQ100 correction same as other 2 indexes ... nasdaq also have its pattern
so lets wait 9800-9500 area

NAS100 Analysis NAS100 - Analysis
Currently NAS is consolidating. This is the area to concentrate on today. Yesterdays analysis still valid. We may get nas coming back to fill some gaps before going up or it may just go up

NAS100 AnalysisNas100 is currently around the 11333 zone. A break here alongside a break of the trend line we can see more bears come through, taking us to anywhere between 11172- 10743. However if it fails to break 11333 and the trend line then we can see the bulls back upto 11544 to try break it again. 11544 has been tested many times now which has become very weak so next time it goes up we can expect a break.

NAS100 Analysis We may get a pullback at 11172 if we get a break then chances are bears can carry on. As for the bulls they can still take over if there is a pullback and their target will be 11852


NASDAQ 100 | downward trend or upside breakout ?NASDAQ 100 is in a downtrend we may see rejection for short at 11200
Possible next move is to 10668 to 10313
Breakout at level 11300 may take it to 11776
Resistance Levels: 11200, 11354, 11564, 11776
Support Levels: 11090, 10885, 10668, 10313
Let's watch...
#JustTradeFxOnline
Thanks for your love and support.
Don’t forget to like and comment for more.

Be aware of the Nasdaq levels here!It's may be time to start looking for Short Entries?!... w. a 7500 (long term) target.

NASDAQ 1W-TIMEFRAME ANALYSISNASDAQ 1W-TIMEFRAME ANALYSIS
Hello ladies and gentlemen
This is my new idea for NASDAQ
NASDAQ price will test 10070 daily support
My idea shows the possibility of breaking this support
But be relaxed
Real support is between 9850 and 9900 It would be good to test it
From there we will start the bull market
I hope my idea is clear
Support me by like and share
Good luck

NASDAQ -------- Short of THE decade. UPDATE 1Hi Friends,
NASDAQ clearly broke the neck line of Head and Shoulder patter (look for my previous post on this one)
I will update shorting opportunities in NASDAQ.
When ever the volatility stop hit ( TURNS GREEN ) then it is shorting opportunity.
Now it stands at 11208.3 , any point above can be shorted with stoploss of 11626.
What is the target? Sky is the high and ocean is the bottom, we never know how much it falls.
so target is at your convenience.
YOUR HUMBLE TRADER
KIRAN


NASDAQ is trading within a downtrend channelCURRENCYCOM:US100
📍 After reaching the record high level around 12500.00 investors are taking their profit because of fear about the economic slow and and doubt over economic rebound
📍 Currently the price is below the 11000.00 key psychological level. Ahead of the US presidential election everyone had a doubt over who is win the election and how they will impose new tax on corporate sector
📍 US100 is trading in a downtrend channel. And series of HH LL LH LL patterns forming. And approaching towards the lower side of the major trend line we can expect a minor rebound from this level
📍 Within this downtrend channel series of bearish flag patterns are formed which is a clear sign of bearish trend
📍 In Elliot wave theory The 3rd minor wave is forming within the major third wave. The 2nd major wave was clearly closed at 61.8% of the 1st wave
📍 Recently the tech shares are in decline phase which in turn the US100 is falling as the tech shares the major movers
📍 The price was felled below the 50,1001200 exponential moving average the Ichimoku cloud is acting as resistance for the bull
📍 If the price moved above 11840.00 level then the bearish trend got invalidated 11840.00 is a 50% Fibonacci level
📍 MACD is in red zone and oscillators are pointing towards bearish trend. But in RSI the strength is slowly fading and we can expect minor rebound up to RSI-50
📍 The next bearish target would be 10310.00 which is a July low level. In alternative case the target would be 10800.00
Please give us a thumbs up if u like our work and do follow us so that you can get a regular update about upcoming setups and ideas


Nasdaq about to drop???Just looking at the technicals not accounting for fed money this sucker looks ready to drop...