Nasdaq SHORT. Revision: "Top of the Market to you!..."Update for: "Top of the Market to you! Nasdaq to test March lows?.."
Shows good Short Entry potential here w. tight stopsas well as
the potential (likely) price action for the next few months.
Let's see what happens...
Nasdaqshort


NASDAQ looking very weak on multiple indicatorsI continue to cobble together a trading system that will help me let my winners run while finding potential reversal points as I have gotten fairly good at buying the dip or finding longer term reversals but I leave to much on the table or I get out too soon. So lets break this down:
The VSTOP system is pretty simple. The regular setting helps track areas of support and resistance and you can look at closing a position when it flips. When it does flip you have a secondary back up at the Multiple Time Frame VSTOP. Often you can get quick movements from the VSTOP to the VSTOP MTF. The current target for that move would be around $121.
The On Balance Volume EMAs is one of my favorite indicators. Like many indicators it is a bit easier to but the dip than it is to short the top because of how difficult shorting can be. The purple circle does show an interesting consolidation below bearishly crossed 10 and 20 EMAs just above the 100 EMA. Should we get the expected move off the VSTOP the OBV situation would probably drive OBV below the 100 EMA and single worse things to come.
Further that: the OBV showing hidden bearish divergence peak to peak as shown by the red arrow. That is very crucial and the OBV beneath the EMAs shows a lot of weakness.
The blue circles on the MACD show that we have a very similar bearish cross compared to the black squares and purple circle. The MACD has a potential to cross zero and the MACD histogram is showing classic bearish divergence. Somewhat painfully for me is I know uptrends often have three highs (simple elliot wave) and the MACD helps show us where those highs are technically. I shorted the second high poorly.
And finally, the 20D SMA is in a position to act as resistance.
Based on this system I am cobbling together we could short and place a stop above the VSTOP and either take profit at the MTF VSTOP or look for a fib retracement of this uptrend. You could also zoom out and look for a wider support.
If the price action breaks the VSTOP bullishly the setup is negated. If the OBV EMA situation is no longer bearishly stacked the setup is negated. If price action goes to the MTF VSTOP then bounces up the trade is just a swing trade and not a longer term trade.

NASDAQ- Plan for Monday 24th Aug 2020I am looking out for a breakout and a retest on different zones to either go long or short. Quite a long video in comparison to others, but I trust it's worth it. Remember if you follow my advice to enter a trade, you are on your own. God bless


NASDAQ -Waiting for FALSE BREAKOUT Hello Everyone! nasdaq can give false breakout | RSI showing bearish divergence | wait for close in range b/w 10820 & 10400 |
stay cautious | fed can stop dumping money anytime

NASDAQ (USTEC), Reaching Moon.Triple top formation
Rejection Zone.
Trendline rejection.
Hoping to gain some serious pips..

Nasdaq is going for dive, but how deep?! that's the questionMy First Analysis of NASDAQ, i could be totally wrong though, but the deepest target in my analysis is around ~9000

NASDAQ- Plan gone rightFollow up on previous video regarding my plans for today. It all went well. I went short and caught over 100pips. Thanks for supporting and motivating me to share more videos

NASDAQ- Back to 11,000 and my Plans for todayJust as I said, 11000 is back. Want to know what I am looking at trading today ? Then watch this video

NASDAQ- Made all time highs last week.I am expecting a retest to the highs of last week and a possible correction to 10300 and if that breaks, 10100. Nasdaq is still in an uptrend so be careful when going short during correction.

NDX Wave (2) Corrective LowerThe same predicament exist in the NDX as the SPX. NDX is facing Fib resistance at 10,993 level a triangle pattern that could unfold into wave (2) corrective wave lower. Immediate resistance 10,715 likely to find a wave (5) top for now. NDX is leading the charge on the overall indexes rally, focus on on remaining push into 10715 wave 5 Fib resistance zone and from there we’re looking for a decline back towards 10,400.
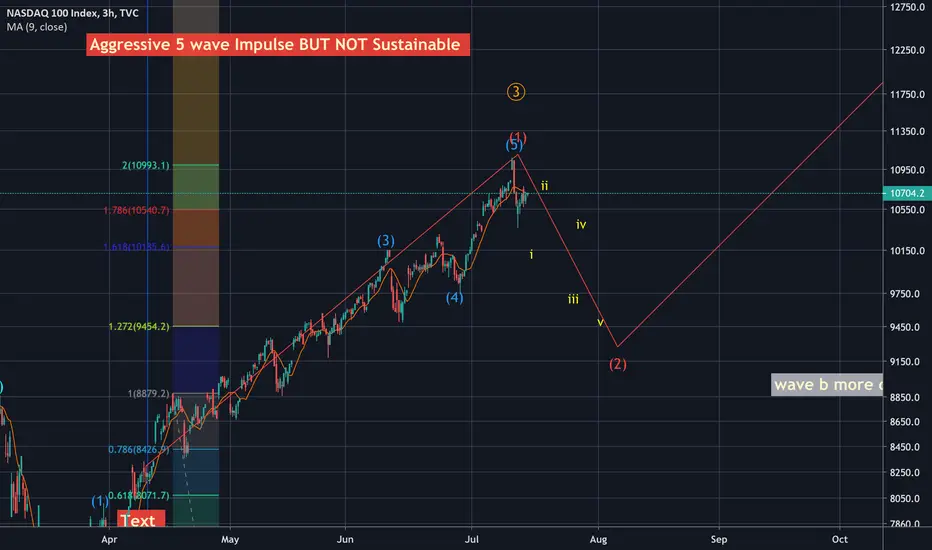
NDX Wave (2) Pullback , Rally Not SustainableThe same predicament exist in the NDX as the SPX. NDX is facing Fib resistance at 10,993 level a triangle pattern that could unfold into wave (2) corrective wave lower. Immediate resistance 10,715 likely to find a wave (5) top for now. NDX is leading the charge on the overall indexes rally, focus on on remaining push into 10715 wave 5 Fib resistance zone and from there we’re looking for a decline back towards 10,400.

sell at 10854 and tp under 10000sell at 10854 and tp under 10000
do with 2 lot
first lot cut in half of target like 10480
lot 2 made a stop loss at 10600 as exemple when he reach less than 10500
if you see the volatily very high coupled with a bed news.u can go down than 9950..just do a traling stop manulally

NASDAQ - Expecting 11,000 this week !Nasdaq is presently on all time highs and based on the charts, I see more gains for the bulls. Watch to see why !

NASDAQ - Entry point for sellSomeone asked me about a good entry point of a sell trade so I thought I'd make a quick video about it. Please remember I am not a financial adviser so I am not advising you to do as I say.


NASDAQ - Possible short ?As a day trader, I trade with the trend but also take advantage of pull backs. To the newbies, you can do this too, remember keep it simple. Understand price action, do not confuse yourself. I started trading NASDAQ only recently as well that's why I said you can do this.

NASDAQ - Extremely Complex Wave 2 Deciphered By AriasWaveWave E is an ending diagonal which gives the entire correction away even if it was trying to trick us all.
Short this market when it hits the green line if you're an aggressive trader.
If you are a conservative trader with a bit more capital to risk then wait for a break of the magenta line.
Please LIKE and FOLLOW to get notification of updates and future posts.

NAS100USD forecast 1st to 5th June 2020, Nasdaq IdeaHi,
as you can see i have made my analyses on Nasdaq, as it is going for short term Long position to fill the double top pattern, after that i am expecting it to go SHORT for long term on the next month and reach this level 8330.8, and if the price breaks below this level 7362.4 it will continue to the downside (anything is possible in the forex market.)
as closer view

NDX WeeklyPotential, "last" short opportunity i NDX,
- Gap closed
- Supply zone on weekly
- Resistance, trend channel
