Nasdaqsignals

DowJones (US30) Bearish patterns and signsIn this 1-hour chart of DowJones (US30), we observe a significant bearish pattern forming after the price action. The market hunted the highs of both the Asia and Euro sessions during the NY session, which typically signals a liquidity grab. This maneuver often leads to a swift reversal, as is evident by the price dropping back down after touching the resistance zone.
The index has broken down from a rising wedge pattern, a bearish reversal signal. This suggests that after the false breakout to the upside, the DowJones is poised for a considerable decline. Traders should anticipate further bearish momentum, potentially leading the index down to lower levels. The break below the wedge confirms that the upward momentum has weakened, and sellers are likely to dominate, pushing the price down further.
Keep an eye on support levels for any potential slowdowns, but the overall trend appears to be bearish for the immediate future.

NASDAQ H3 Idea | SELL to BUYPlanning to initiate a short position in the Nasdaq when it reaches 19,100, aiming to capitalise on a downward movement to 18,600. Once the Nasdaq hits 18,600, I will close my short position and open a long position, anticipating a rebound that could lead to a new all-time high (ATH). This strategy is designed to take advantage of both the anticipated decline and the subsequent recovery in the Nasdaq index.

idea to be long in us100 nasdaq 60 % probabilityWe have the original bullish trend and the price is giving us signs of going long in very important areas and today we also have important news

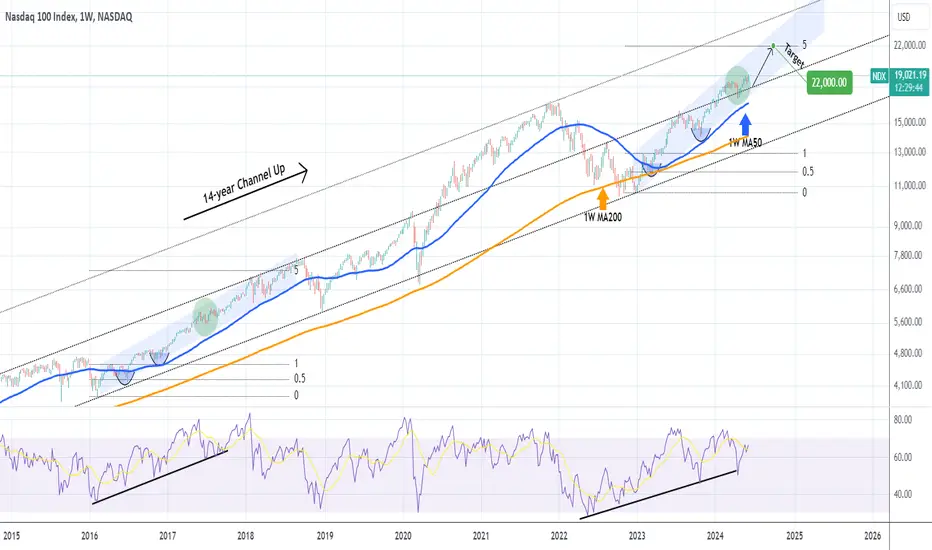
NASDAQ will continue to rise on this pattern repetition.Nasdaq (NDX) has been trading within a (blue) Channel Up since basically the market bottom of the inflation crisis in October 2022. On the bigger picture, this is the technical Bullish Leg of the 14-year Channel Up and is supported by the 1W MA50 (blue trend-line) since March 13 2023.
Based on the 1W RSI pattern, we have previously seen such Bullish Leg within the long-term Channel Up supported by the 1W MA50, back on the February 08 2016 bottom. As you can see on this 1W chart, both Bullish Legs (Channel Up patterns) made their first pull-back on the 0.5 Fibonacci retracement level. In June 2018, the previous fractal reached the 5.0 Fibonacci extension and shortly after, the index corrected aggressively back at the bottom of the 14-year Channel Up.
We expect Nasdaq to hit again the 5.0 Fib ext sooner or later but most likely before the year is over. This gives us a medium-term Target of 22000.
-------------------------------------------------------------------------------
** Please LIKE 👍, FOLLOW ✅, SHARE 🙌 and COMMENT ✍ if you enjoy this idea! Also share your ideas and charts in the comments section below! This is best way to keep it relevant, support us, keep the content here free and allow the idea to reach as many people as possible. **
-------------------------------------------------------------------------------
💸💸💸💸💸💸
👇 👇 👇 👇 👇 👇
NASDAQ BUY TP HITHi traders our NASDAQ Trade went into our direction as analyzed lets close our trades and enjoy our profits.
Certified Price action king

entry analysis in GBPNZDthese scenarios I expect with confirmation but I would like it to go down first and look for purchases since the structure is bullish

NQ Short Term LongRespected the daily FVG two times. Closed bullish yesterday on daily. We took on 15min the lase bearish FVG and an order block. I will look for an long entry with first TP previous day close around 18665 and potential to previous day high around 18750. Stop will go below current day low at 18565. Trade is off if we reach the first TP before trigger

NASDAQ H1 BuyBullish setup on NASDAQ H1 chart. Risk reward 1:2, on this chart we see fake break down afrer consolidation and bullish pull back. Now it's not hard to continue this move till 18737 level.

Nasdaq buy setup institutional tactics hello traders this is my nas100 buy setup
risk reward 1:10
the system: institutional tactics
if you like this deal hit the like button follow comment subscribe and show some love ❤️
wish you good luck and good trading
i would like to have conversation and share our ideas and know you good people
remember the flow state is important
Flow , Glow and know and never blow

tech is going uptoday we have touch the bottom part of a range.
we are going up.
entry in blue. target in green.
stop in red.
have fun
Eleketra 33

US100Nasdaq index analysis
1 hour time frame
The price can move to the bottom of the 1-hour range and from there return to the top of the 1-hour range.

BUY NASQADAs you can see on the chart, the price now came out of the strongest zone of the volume profile and heading up to the IC in which you'll get a short entry.
This might be a risky trade, manage your risk!

NASDAQ Another 2 weeks of consolidation possibleNasdaq (NDX) made the bullish break-out that we largely expected as described on our previous idea (May 15, see chart below) and almost hit our 19100 Target:
Right now we see a short-term pull-back, which based on the November - December 2023 fractal (green ellipse), should be at worst a 2 week consolidation. The 1D RSI also shows that symmetrically we should be at a point similar to December 06 2023.
That fractal then rose for a Higher High on the 2.236 Fibonacci extension. As a result, our medium-term Target is now set at 19900 (just under the 2.236 Fib and top of the 1.5 year Channel Up).
-------------------------------------------------------------------------------
** Please LIKE 👍, FOLLOW ✅, SHARE 🙌 and COMMENT ✍ if you enjoy this idea! Also share your ideas and charts in the comments section below! This is best way to keep it relevant, support us, keep the content here free and allow the idea to reach as many people as possible. **
-------------------------------------------------------------------------------
💸💸💸💸💸💸
👇 👇 👇 👇 👇 👇

nasdaq FUN TIME2 possible trades.
long and short.
target in green.
description on the chart.
have fun
Elektra 33

US30 - 15m Buy OpportunityThe recent price action in the Dow Jones (US30) shows a potential buying opportunity after a significant drop. To manage risk effectively, it's essential to make this buy position risk-free by moving the stop-loss to breakeven or into profit. This approach ensures that even if the market reverses, you will not incur a loss on this trade.
With the current setup, wait for price action signals to confirm the next movement towards the target levels. Watch for bullish signs such as higher highs and higher lows, or bullish candlestick patterns that indicate continued upward momentum. By doing so, you can maximize profits while minimizing risks.

TSLA (TESLA) falling continue. Target 150.Hi friend. So we have bears accumulation channel "1" between 166.4 - 186.5. I think in next few weeks price will fall to 150. On a road price have two transit levels 166.4 and 158.7 (there can be correction). Volume analysis based on my author indicators. Levels thanks to X-Lines script.
Follow me;)

NASDAQ (US100): Possible scenarios NASDAQ is the strongest index in comparison to S&P500 and Dow Jones.
If the price wants to move lower, it should stay below the inversion, if it happens then we can target the previous week's low and sell-side liquidity, but if the price breaks the inversion we will see the new all-time high again.
💡Wait for the update!
🗓️27/05/2024
🔎 DYOR
💌It is my honor to share your comments with me💌

NASDAQ. Weekly trading levels 20 - 24.05.2024Indices are at highs. We haven’t been to the top yet, there’s no data there. If we update the historical maximum, we can find out more in the Daily Posts.
During the week you can trade from these price levels. Finding the entry point into a transaction and its support is up to you, depending on your trading style and the development of the situation. Zones show preferred price ranges WHERE to look for an entry point into a trade.
If you expect any medium-term price movements, then most likely they will start from one of the zones.
Levels are valid for a week, the date is in the title. Next week I will adjust the levels based on new data and publish a new post.
! Please note that brokers have a difference in quotes, take this into account when trading.
The history of level development can be seen in my previous posts. They cannot be edited or deleted. Everything is fair. :)
----------------------------------------------
I don’t play guess the direction (that’s why there are no directional arrows), but zones (levels) are used for trading. We wait for the zone to approach, watch the reaction, and enter the trade.
Levels are drawn based on volumes and data from the CME. They are used as areas of interest for trading. Traded as classic support/resistance levels. We see the reaction to the rebound, we trade the rebound. We see a breakout and continue to trade on a rollback to the level. The worst option is if we revolve around the zone in a flat.
Do not reverse the market at every level; if there is a trend movement, consider it as an opportunity to continue the movement. Until the price has drawn a reversal pattern.
Don't forget to like Rocket and Subscribe!!! Feedback is very important to me!

US100Nasdaq index analysis
Time frame 4 hours
I expect to see a drop to the 18,300 range, then another bullish lag.

nasdaqPair : NASDAQ ( US 100 )
Description :
Completed " 12345 " Impulsive Waves
Break of Structure
Rising Wedge as an Corrective Pattern in Short Time Frame
RSI - Divergence
Fibonacci Level - 261.8%

NASDAQ BUY TP HITHi Traders Our analysis for Nasdaq went into our favor as planned. stay tune for more profitable trades.

