NASDAQ Close to the 1st 1D Golden Cross in 2 years!Nasdaq (NDX) has been trading within a Channel Up since the December 2022 Low and is currently extending the gains of the latest Bullish Leg.
At the same time it is about to form the first 1D Golden Cross in more than 2 years (since March 08 2023). The last two major Bullish Legs of this pattern, before the previous one was interrupted by the Trade War, were pretty symmetrical, peaking at +49.21% and +47.47% respectively.
If the current one follows the +47.47% 'minimum', we should be expecting Nasdaq to hit 24000 by late Q3.
-------------------------------------------------------------------------------
** Please LIKE 👍, FOLLOW ✅, SHARE 🙌 and COMMENT ✍ if you enjoy this idea! Also share your ideas and charts in the comments section below! This is best way to keep it relevant, support us, keep the content here free and allow the idea to reach as many people as possible. **
-------------------------------------------------------------------------------
Disclosure: I am part of Trade Nation's Influencer program and receive a monthly fee for using their TradingView charts in my analysis.
💸💸💸💸💸💸
👇 👇 👇 👇 👇 👇
Nasdaqsignals

NAS - TIME TO MAKE ACTIVE TRADER ROOM GREATER AGAIN!Team, last week we got a good entry on both DOW/US30 AND NAS100/TEC100
Yes, i do know about the situation with ISRAEL AND IRAN.
This will drag on for at least 3-6 months for the solutions
however, I expect the cease fire should be stop within next week as President Trump's is negotiation with Iran
There are two strategy to trade for the NAS- NASTY market
Rule: make sure you calculate how much position and volume you are taking risk on the trade. Every time you enter, ensure you are understood each trade risk.
As I always do.
The last 90 days we have not losing a single trade - check my new video release soon.
OK, lets get back to the trade set up again
entry small volume at market now.
If market falling down during US session, buy more at the second setting
However, I expect the 1st setting likely to recover soon.
Jump on board now.
See you to the moon

update TP for NASDAQ i see more ups for NASDAQ .The Nasdaq index touched strong support, so I think it will rise further, as shown.

-(update)- Opportunity for buying NASDAQ After careful observation and relying on support and resistance, I see an upward movement from the support represented in front of you.


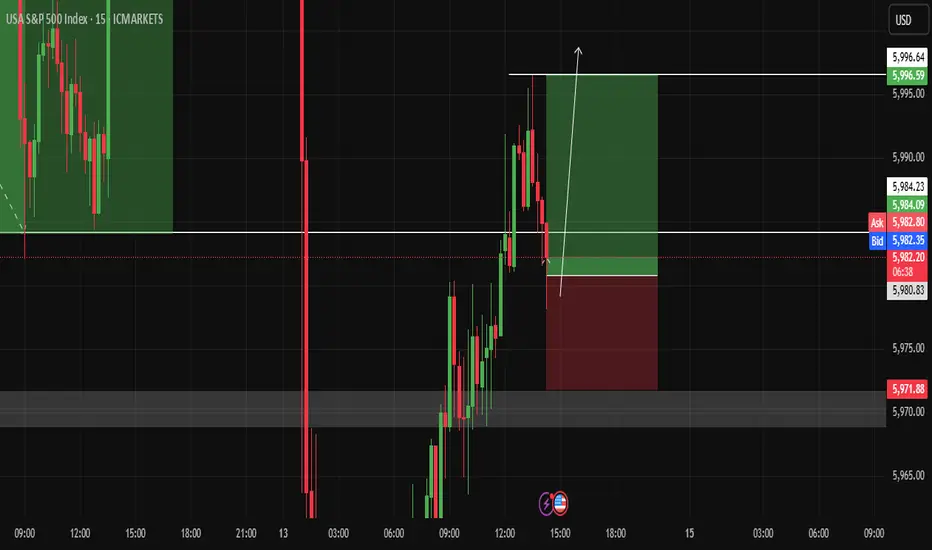
Opportunity to buy NASDAQBy combining support and resistance, I see NASDAQ rising to 5996 before reaching to 5971
NAS - LOOKING FOR RECOVERTeam This morning we got out of beautiful SHORT on UK100
Market dumping hard due to ISRAEL'S and Iran
However we expect market to be recover during UK market opening
Please follow the price accordingly to the chart
Once it reach 1st target, take 50-70% profit reduce the volume and bring stop loss to BE
LET'S GO.

NASDAQ ShortLooking for the short on Nasdaq been trading this long and short through out the week. Check the linked publications. Shouted out 22,000 before seeing the short.


NASDAQ Initiated a standard short-term Bull Cycle.Nasdaq (NDX) has been trading within a Channel Up ever since the November 2008 bottom of the U.S. Housing Crisis. The recent Trade War correction that started early this year, bottomed just before the 1W MA200 (orange trend-line) and rebounded.
As this chart shows, every break below the 1W MA50 (blue trend-line) has technically started a new Cycle. During this 16-year pattern, we have seen two types of Cycles, a short (blue Rectangle) and long (green Rectangle).
Based on the sequence since the start of the Channel Up, the index should have now just initiated its new short Cycle. Both previous ones peaked on the 1.786 Fibonacci extension before a correction below the 1W MA50 again. As a result, we expect to see 28000 at least before the next meaningful technical correction.
-------------------------------------------------------------------------------
** Please LIKE 👍, FOLLOW ✅, SHARE 🙌 and COMMENT ✍ if you enjoy this idea! Also share your ideas and charts in the comments section below! This is best way to keep it relevant, support us, keep the content here free and allow the idea to reach as many people as possible. **
-------------------------------------------------------------------------------
💸💸💸💸💸💸
👇 👇 👇 👇 👇 👇

NASDAQ failed to capture hourly fair value gap multiple times.The US100 index failed to close a body above the hourly fair value gap multiple times. I would expect it to go towards sellside liquidity marked on the chart after multiple failed attempts at closing above an important level .

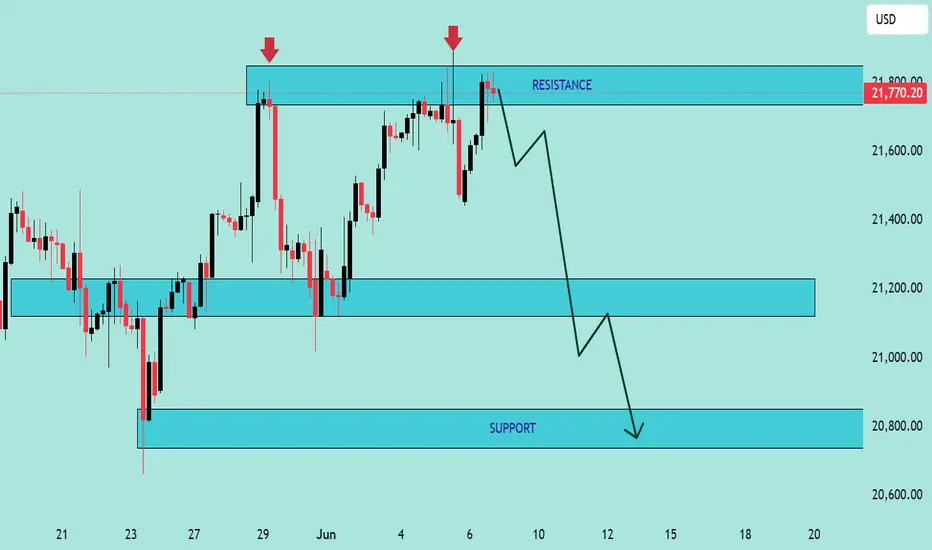
NAS100 Technical Analysis – Bearish Rejection at ResistanceNAS100 Technical Analysis – Bearish Rejection at Resistance 🚨
📅 Date: June 6, 2025
📈 Instrument: NAS100 (US Tech 100 Index)
🔍 Chart Overview:
The price action shows a clear rejection from the 21,800 USD resistance zone, marked by two strong bearish wicks (indicated by red arrows 🔴). This level has proven to be a strong supply zone, as sellers repeatedly step in to push prices lower.
🔵 Key Zones:
🔺 Resistance Zone: 21,750 – 21,800 USD
✅ Multiple rejections and bearish pressure.
🔻 Support Zone 1: 21,100 – 21,200 USD
📍 Acts as a mid-range demand zone and a potential take-profit level for short positions.
📉 Support Zone 2 (Major): 20,700 – 20,850 USD
📦 High-probability bounce area due to historical demand.
🔄 Price Action Insight:
The chart outlines a bearish double rejection pattern at the resistance level.
The current candlestick setup suggests bearish momentum, with a potential drop toward the mid-support zone.
If the price breaks below the mid-support, it could cascade down toward the major support near 20,800 USD.
📌 Projected Move:
🔻 From current levels (~21,750), expect:
Pullback from resistance,
Target 1️⃣: 21,100 USD zone,
Target 2️⃣: 20,800 USD major support.
🚫 A clean break and close above 21,800 invalidates the bearish outlook and may trigger a bullish continuation.
✅ Conclusion:
The chart favors a short bias below the resistance zone. Patience is key—wait for confirmation (like a bearish engulfing or break of structure 📉) before entering positions.
📊 Always use risk management. Set stop-loss above resistance in case of reversal.
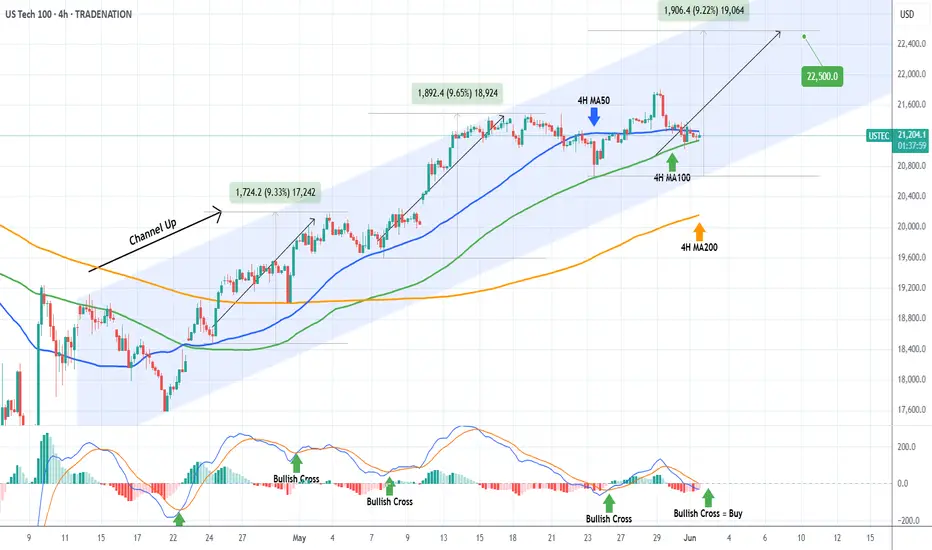
NASDAQ Will the 4H MA100 come to the rescue?Nasdaq (NDX) is trading within a 3-week Channel Up, which is currently supported by the 4H MA100 (green trend-line). In fact, the price is being squeezed in the last three 4H candles within the 4H MA100 and the 4H MA50 (blue trend-line).
This tight compression technically tends to cause violent break-outs either way. As long as the Channel Up holds, we expect that to be upwards and it should be confirmed by the formation of a 4H MACD Bullish Cross.
With the last two major rallies being around +9.50%, we expect to see 22500 on the next Leg Up.
-------------------------------------------------------------------------------
** Please LIKE 👍, FOLLOW ✅, SHARE 🙌 and COMMENT ✍ if you enjoy this idea! Also share your ideas and charts in the comments section below! This is best way to keep it relevant, support us, keep the content here free and allow the idea to reach as many people as possible. **
-------------------------------------------------------------------------------
Disclosure: I am part of Trade Nation's Influencer program and receive a monthly fee for using their TradingView charts in my analysis.
💸💸💸💸💸💸
👇 👇 👇 👇 👇 👇
NASDAQ100 Analysis – Key S/R Zones & Price Reaction Incoming! NASDAQ100 Analysis – Key S/R Zones & Price Reaction Incoming! 🚨
🔍 Chart Breakdown:
This is a technical chart analysis of NASDAQ100 (NAS100) with defined Support and Resistance zones. The price is currently at 21,314.50, sitting below a critical decision area.
🧱 Key Zones:
🔵 Resistance Zone:
‣ 21,640 – 21,800
‣ Strong supply area where price sharply reversed previously.
‣ If price breaks above the mid resistance zone, a bullish move towards this level is likely.
🟩 Support + Resistance Flip Zone:
‣ 21,280 – 21,420
‣ Former support, now acting as resistance.
‣ Price is struggling to reclaim this zone.
‣ Acts as a key decision level.
🟢 Support Zone:
‣ 20,630 – 20,750
‣ Strong demand zone from which previous rallies initiated.
‣ Target if bearish rejection continues.
🔄 Price Action Insight:
Price is currently rejecting the Support-turned-Resistance zone.
There’s a clear bearish rejection at the mid-zone (S/R flip), forming a lower high structure.
📉 A breakdown from current levels could lead to a retest of the support zone at 20,700 area.
🟢 However, a successful reclaim and bullish confirmation above 21,420 could see price target the upper resistance at 21,800.
📌 Outlook:
🔽 Bearish Bias if price fails to break above 21,420 – possible drop to 20,700.
🔼 Bullish Reversal above 21,420 could drive price to 21,800.
📅 Date: June 1, 2025
🕒 Timeframe: Likely 1H or 4H chart
💬 “Respect the levels, not the noise.”
Trade safe! ✅

NAS100-TEC100 - THE SECRETE OF TRADING INDICES STRATEGYTeam,
yesterday we short the NAS, DOW, DAX and long the GOLD - 4 out of 4 perfectly target hit
Now, we are going long, i want you to carefully look at the picture and understand the concept of how I structure the trade. This has been calculate using my statistic and probability to ensure our entry is safe.
First picture, is buying small volume, if market volatile and push further down, i need you to double up your trade, this allow us to win better.
That's the reason why you saw my videos that everyday i show LIVE trading and profitable every trade. However, always carefully look at your capital and know exactly how much risk are you going to take.
Remember, you can win straight 3-6 months and if you failed risk management and overleverage yourself, the account can easily be kill within 1 day.
Hope you all have a great day.!

Nasdaq analysis: 29-May-2025Good morning, everyone! Today's Nasdaq analysis is designed to educate and empower. Use these insights to refine your price action trading strategy.

Apple Stock Heist Blueprint – Precision Buy Setup Unlocked!🏴☠️ Apple Stock Heist: The Stealthy Long Setup
🎯 Entry Zone – Loot the Dip!
Current Price: $200.21
Action: Initiate long positions now or target pullbacks near the $193–$190 support zone.
Pro Tip: Place buy limits near swing lows/highs. Utilize chart alerts as your secret weapon.
🛡️ Stop Loss – Guard the Treasure!
Swing Traders: Position stop loss below the $190 support level.
Day Traders: Adjust stop loss according to your risk tolerance and order count.
TECHi
💰 Profit Target – Escape with the Loot!
Primary Target: $210 resistance zone.
Secondary Target: $227–$230 range.
⚔️ Scalpers vs. Swing Traders – Choose Your Weapon!
Scalpers: Focus on quick strikes. Enter long positions and exit swiftly.
Swing Traders: Trail stops and lock in gains as the price moves in your favor.
🌪️ Market Pulse – Bullish Winds Blowing!
Technical Indicators: Price is supported near $201, with potential to bounce back toward local resistance at $213.
RSI: Approximately 35 on the 1-hour timeframe, indicating oversold conditions and potential for a rebound.
TradingView
⚠️ News Trap Warning!
Upcoming Events: Monitor for any high-impact news that may affect Apple's stock price.
Strategy: Freeze trades or tighten stops ahead of major announcements.
🚨 Join the Trading Crew!
Engage: Like 👍 or Boost 🚀 this idea to fuel our next raid.
Support: Your engagement keeps the strategies alive!
🤑 Stay Locked In – The Next Big Score is Coming…
Timing: Watch the charts closely.
Action: Strike hard. Exit smarter.

NASDAQ: More Bullish MovementsHuge drop on the left side which happens to reset the trend. Maybe NAS could continue to rally from this point forward

NASDAQ got the 4H MA50 confirmation it neededNasdaq (NDX) has been trading within a Channel Up since the April 21 bottom and last week it unfolded its latest technical Bearish Leg.
As the 4H RSI bottomed on the 30.00 oversold barrier and the 4H MACD formed a Bullish Cross, that Leg bottomed and today the index gave the confirmation of the new Bullish Leg by breaking above its 4H MA50 (blue trend-line).
This is similar to the April 21 bottom, so we expect at least a minimum of +9.18% rise on the current Bullish Leg, which gives a 22500 short-term Target.
-------------------------------------------------------------------------------
** Please LIKE 👍, FOLLOW ✅, SHARE 🙌 and COMMENT ✍ if you enjoy this idea! Also share your ideas and charts in the comments section below! This is best way to keep it relevant, support us, keep the content here free and allow the idea to reach as many people as possible. **
-------------------------------------------------------------------------------
Disclosure: I am part of Trade Nation's Influencer program and receive a monthly fee for using their TradingView charts in my analysis.
💸💸💸💸💸💸
👇 👇 👇 👇 👇 👇

Nasdaq trading insights: 26-May-2025Nasdaq trading insights: Not signals, but informative zones to aid your decision-making. Please note: These zones are not trading advice. Use them as a starting point for your own analysis.

#NQ1! "E-Mini Nasdaq 100" Index Market Bullish Robbery Plan 🌟Hi! Hola! Ola! Bonjour! Hallo! Marhaba!🌟
Dear Money Makers & Robbers, 🤑 💰💸✈️
Based on 🔥Thief Trading style technical and fundamental analysis🔥, here is our master plan to heist the NQ1! "E-Mini Nasdaq 100" Index Market Heist. Please adhere to the strategy I've outlined in the chart, which emphasizes long entry. Our aim is to escape near the high-risk YELLOW MA Zone. It's a Risky level, overbought market, consolidation, trend reversal, trap at the level where traders and bearish robbers are stronger. 🏆💸"Take profit and treat yourself, traders. You deserve it!💪🏆🎉
Entry 📈 : "The heist is on! Wait for the Crossing previous high (19800) then make your move - Bullish profits await!"
however I advise to Place Buy stop orders above the Moving average (or) Place buy limit orders within a 15 or 30 minute timeframe most recent or swing, low or high level for Pullback entries.
📌I strongly advise you to set an "alert (Alarm)" on your chart so you can see when the breakout entry occurs.
Stop Loss 🛑: "🔊 Yo, listen up! 🗣️ If you're lookin' to get in on a buy stop order, don't even think about settin' that stop loss till after the breakout 🚀. You feel me? Now, if you're smart, you'll place that stop loss where I told you to 📍, but if you're a rebel, you can put it wherever you like 🤪 - just don't say I didn't warn you ⚠️. You're playin' with fire 🔥, and it's your risk, not mine 👊."
📍 Thief SL placed at the nearest/swing low level Using the 2H timeframe (19200) Day trade basis.
📍 SL is based on your risk of the trade, lot size and how many multiple orders you have to take.
🏴☠️Target 🎯: 20500
🧲Scalpers, take note 👀 : only scalp on the Long side. If you have a lot of money, you can go straight away; if not, you can join swing traders and carry out the robbery plan. Use trailing SL to safeguard your money 💰.
💰💵💸NQ1! "E-Mini Nasdaq 100" Index Money Heist Plan is currently experiencing a bullishness,., driven by several key factors. .☝☝☝
📰🗞️Get & Read the Fundamental, Macro Economics, COT Report, Geopolitical and News Analysis, Sentimental Outlook, Intermarket Analysis, Index-Specific Analysis, Future trend targets with Overall outlook score... go ahead to check 👉👉👉🔗🔗🌎🌏🗺
⚠️Trading Alert : News Releases and Position Management 📰🗞️🚫🚏
As a reminder, news releases can have a significant impact on market prices and volatility. To minimize potential losses and protect your running positions,
we recommend the following:
Avoid taking new trades during news releases
Use trailing stop-loss orders to protect your running positions and lock in profits
💖Supporting our robbery plan 💥Hit the Boost Button💥 will enable us to effortlessly make and steal money 💰💵. Boost the strength of our robbery team. Every day in this market make money with ease by using the Thief Trading Style.🏆💪🤝❤️🎉🚀
I'll see you soon with another heist plan, so stay tuned 🤑🐱👤🤗🤩

USTEC100 Chart 4H, Trends To Watch for Short The provided USTEC 100 (US Tech 100) 4-hour chart highlights a strategic short (sell) trade setup based on technical price action and defined risk levels. The analysis suggests a bearish market bias, provided that specific price conditions are met and maintained. Let's explore the details and rationale behind this trade idea to understand how traders might approach this setup with calculated entries, targets, and stops.
As per the current market data presented, USTEC 100 is trading around 21,115.00 on Monday, 19 May 2025. The chart emphasizes a critical resistance zone highlighted in red, located at approximately 21,445.10. This level acts as a potential invalidation point for the short trade. If the price crosses above this red zone and a full candle closes above it, the entire bearish setup becomes invalid. This is a key condition – any move above this threshold signifies a shift in market sentiment and cancels the downward outlook.

