Nasdaqsignals

NAS100 Top-down analysisHello traders, this is a complete multiple timeframe analysis of this pair. We see could find significant trading opportunities as per analysis upon price action confirmation we may take this trade. Smash the like button if you find value in this analysis and drop a comment if you have any questions or let me know which pair to cover in my next analysis.

NASDAQ Extending its rise to 14350 1W MA100 turned into Support.Nasdaq (NDX) hit last Thursday our long-term target (see idea below) of the August 16 2022 Resistance and even though it took longer than anticipated, it finally filled that Gap:
The pattern that is directing the price action higher is a Rising Wedge and right now the price is very close to its top (Higher Highs trend-line). However coming off a 1D MACD Bullish Cross and more importantly having broken above the 1W MA100 (red trend-line) after more than a year, we expect an extension of this short-term bullish leg. Our target is slightly below the 0.618 Fibonacci retracement level from the November 2021 All Time High, at 14350.
Key condition for this is to hold the 1W MA100 as its long-term Support now. The 1D MA50 (blue trend-line) has been the short-term Support since January 20 (hasn't closed a 1D candle below it since then).
-------------------------------------------------------------------------------
** Please LIKE 👍, FOLLOW ✅, SHARE 🙌 and COMMENT ✍ if you enjoy this idea! Also share your ideas and charts in the comments section below! **
-------------------------------------------------------------------------------
💸💸💸💸💸💸
👇 👇 👇 👇 👇 👇

Nasdaq is forming a Rising Wedge pattern!!!It seems that the Nasdaq is forming a Rising Wedge pattern near the 🔴 resistance zone($ 14,060-$ 13,610) 🔴.
I expect the Nasdaq to start falling after touching the upper line of the rising wedge pattern and the resistance zone. Nasdaq's falling target could be the next 🟢 support zone($ 12,470-$ 12,040) 🟢.
Nasdaq 100 Index Analyze (NDXUSD), Daily time frame⏰.
Do not forget to put Stop loss for your positions (For every position that you want to open).
Please follow your strategy, this is just my Idea, and I will be glad to see your ideas in this post.
Please do not forget the ✅' like '✅ button 🙏😊 & Share it with your friends; thanks, and Trade safe.

Nas could go up buyNasdaq Long Idea
Nas could go up its retesting 50% Fib of recent rally and making a bullish Flag
Next important resistance at 13723
:)

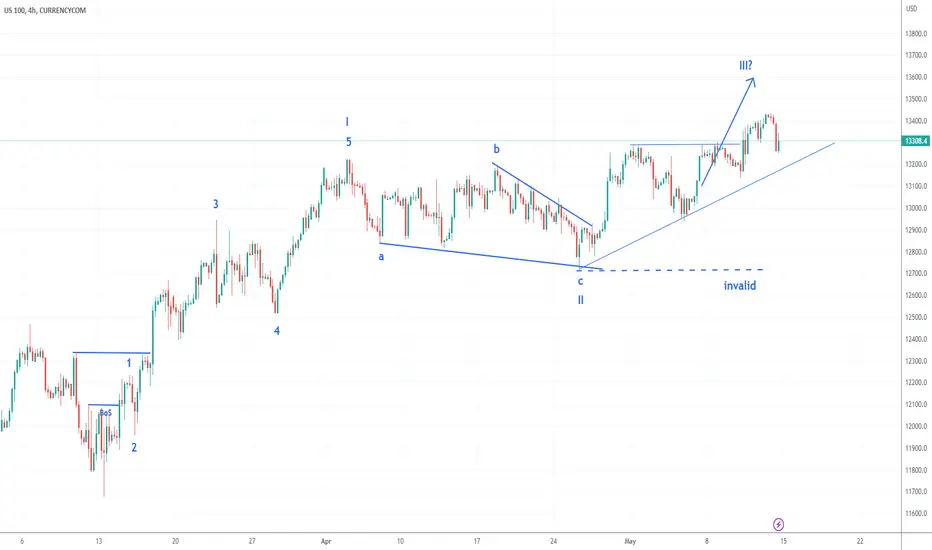
US100 Nasdaq Next Possible MovePair : US100 - Nasdaq
Description :
Bearish Channel in Long Time Frame as an Corrective Pattern with the Breakout of the Upper Trend Line
Divergence - RSI
Break of Structure
Completed " 12345 " Impulsive Wave
Fibonacci Level ( 50.00% / 61.80% )
Rising Wedge


NASDAQ TRADE IDEA POST NYSELooking at a bullish New York Stock Exchange open - targets are 13500 & 13550
Thereafter I will look to go short and sell at 13550/13585 and hopefully reach 13150

NASDAQ broke above the 1W MA100 after a year!Nasdaq (NDX) is extending the bullish trend inside the short-term Channel Up as mentioned on are recent idea two weeks ago (see below):
Today the index reached a very important benchmark as it broke above the 1W MA100 (green trend-line) for the first time in more than 1 year (since the 1W candle of April 25 2022). This was a critical Resistance as it rejected the uptrend back on the week of August 15 2022. With the 1D MA50 (blue trend-line) supporting and the Channel Up that started in December intact, we see a Resistance test of the 13730 High as inevitable, so there is your short-term target if you are looking for one.
On the longer term, since the February 02 Higher Highs trend-line broke, the Channel Up can target the November 15 2022 Higher Highs trend-line. A typical +11% rally within this Channel Up can easily target this trend-line, so now we are setting a 14100 long-term target on Nasdaq. Especially if the 1D RSI breaks above its own Lower Highs trend-line.
-------------------------------------------------------------------------------
** Please LIKE 👍, FOLLOW ✅, SHARE 🙌 and COMMENT ✍ if you enjoy this idea! Also share your ideas and charts in the comments section below! **
-------------------------------------------------------------------------------
💸💸💸💸💸💸
👇 👇 👇 👇 👇 👇

US100 - Short SignalUS100 H1
We are challenging high prices here on US100, where this 13430 resistance price is looking like a solid sell zone. Nice rejections first time round dated 12th May once we saw that hourly top exhaustion. We need something to catalyse an upside break, most stock indices sitting on resistance prices, needing that justified surge to break upside.
US figures later for retail sales, this could cause some interesting moves, but on a technical basis I'm looking for shorts. If we can grab a short entry from that 30 price ahead of figures, that could be attractive.

Nasdaq -> Obvious Top FormationHello Traders,
welcome to this free and educational multi-timeframe technical analysis .
On the weekly timeframe you can see that Nas100 is currently approaching a quite obvious previous weekly structure area which is now turned resistance exactly at the $13.500 level.
You can also see that from a weekly perspective, Nas100 is a little bit overextended towards the upside and in my opinion we are ready for a short term correction before we will then see more continuation towards the upside.
On the daily timeframe you can see that Nas100 is currently forming a rising wedge formation which is always considered a reversal sign, so I am now just waiting for some bearish selling pressure before I will then enter a short to capitalize on the next dump towards the downside.
Thank you for watching and I will see you tomorrow!
You can also check out my previous analysis of this asset:

US30 SHORT NAS100 SHORT NASDAQstrong dollar, what other confluence do you need here ? US30 gon tank for a while yep. we ride the shorts till later.

US100 14May2023last week the performance of the Nasdaq was in accordance with the analysis, still continuing the bullish trend. the bullish trendline also supports the analysis with a bar movement with a slope of 45 degrees, we take the opportunity to buy next week
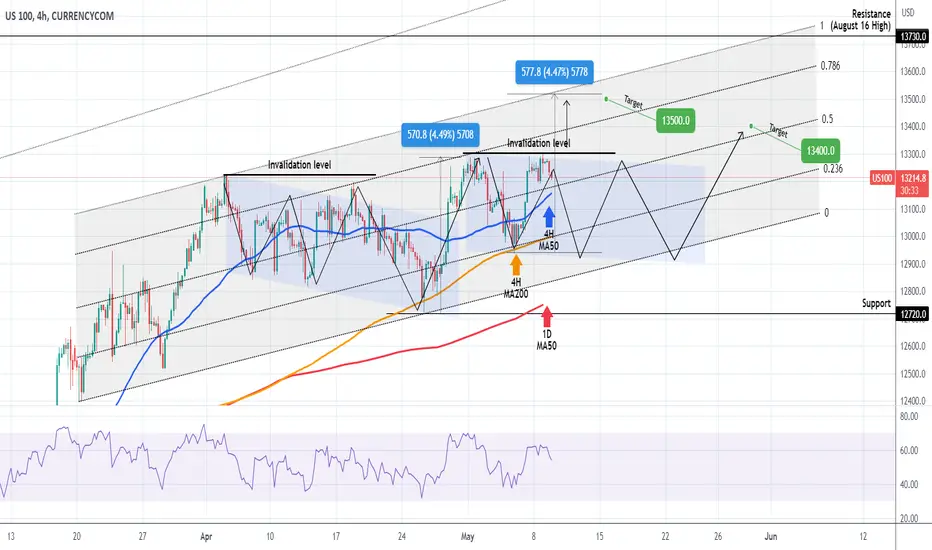
NASDAQ Still bullish with 2 scenarios within the Channel Up.Nasdaq (NDX) continues to trade within the March 20 Channel Up and is approaching the 4H MA50 (blue trend-line), having had the last rebound on the 4H MA200 (orange trend-line). The price action is starting to look a lot like April where a Channel Down took the price to the Channel Up bottom and then had a +4.50% rebound. If this prevails we will add a new buy on the 1D MA50 (red trend-line) and target 13400. If the price though closes above 13300, it invalidates this and we will buy the break-out instead, targeting 13500 (+4.50% rise from the bottom).
-------------------------------------------------------------------------------
** Please LIKE 👍, FOLLOW ✅, SHARE 🙌 and COMMENT ✍ if you enjoy this idea! Also share your ideas and charts in the comments section below! **
-------------------------------------------------------------------------------
💸💸💸💸💸💸
👇 👇 👇 👇 👇 👇
NASDAQ TRADE IDEA 09/05/11NASDAQ TRADE IDEA - similar setup to yesterday, just expecting a lower high to form or a retest on TL.

NASDAQ Breakout Trade!Sell at Current market price and set given TP and SL.
Manage your risk accordingly!


NASDAQ Breakou Setup!Nasdaq about to break the range, place buy and sell stop orders.
manage your risk accordingly.

NASDAQ Bullish within a Double Channel UpNasdaq (NDX) has gone a long way since we called for a rebound on the 1D MA200 on March 17:
Right now the uptrend has slowed down as the Channel Up that started in December has transitioned into a much less aggressive Channel Up, supported by the 1D MA50 (blue trend-line) that is targeting 13500 as part of its Higher Highs process. The 1D RSI which is trading within a Triangle of Higher Lows and Lower Highs can be a guide for buy and sell entries.
If the price breaks above the February 02 Higher Highs, we will increase our buy exposure and target the 13730 Resistance (August 16 2022 High).
-------------------------------------------------------------------------------
** Please LIKE 👍, FOLLOW ✅, SHARE 🙌 and COMMENT ✍ if you enjoy this idea! Also share your ideas and charts in the comments section below! **
-------------------------------------------------------------------------------
💸💸💸💸💸💸
👇 👇 👇 👇 👇 👇

Nasdaq -> Short Squeeze ComingHello Traders,
welcome to this free and educational multi-timeframe technical analysis .
On the weekly timeframe you can see that Nas100 just recently perfectly broke above and with last week's candle already retested and rejected a quite obvious previous weekly resistance area at the HKEX:12 ,800 level.
You can also see that as we are speaking, Nas100 is approaching the next major weekly structure area at the HKEX:13 ,600 level which was acting as quite strong resistance in the past, so from a weekly perspective I am now just waiting for another rally to retest the next resistance before I then do expect a short term correction towards the downside.
On the daily timeframe you can see that with Friday's candle, the Nasdaq perfectly broke and closed above a previous daily resistance area at the HKEX:13 ,100 level - all of this previous resistance is now turned support so I am just waiting for a retest and bullish confirmation before I then do expect another impulse towards the upside.
Thank you for watching and I will see you tomorrow!
You can also check out my previous analysis of this asset:

Price projection on Nasdaq 100 nas100 us100Nas prolly hitting the 14k levels sooner, similar price on top 500

Us100 shortHi traders, I think the price will bounce from this area, after we saw the triple top inside the bullish flag, I think it is a slight correction before going up and breaking the flag. Trader safe and have à good week-end.

NASDAQ Correction still has some steam left.Almost 2 weeks ago we called for a multi-day correction on Nasdaq (NDX) after the price broke below the Inner Higher Lows trend-line and the 1D RSI got rejected on the 70.00 overbought Resistance:
Our view is unchanged and we see a few more days extending this correction to the 1D MA50 (blue trend-line) at least or the 0.5 Fibonacci retracement level as it happened on the March 13 Low on the long-term Channel Up.
The only probability of this getting invalidated and start rebounding now is the potential buying pressure that the RSI Higher Lows trend-line may apply, which got hit yesterday. However we see more likely the scenario of the RSI transitioning into a Rectangle, having 43.40 as its bottom.
Our target remains 13400, which is a little under the 1W MA100 (red trend-line), that has rejected break-out attempts twice since May 05 2022.
-------------------------------------------------------------------------------
** Please LIKE 👍, FOLLOW ✅, SHARE 🙌 and COMMENT ✍ if you enjoy this idea! Also share your ideas and charts in the comments section below! **
-------------------------------------------------------------------------------
💸💸💸💸💸💸
👇 👇 👇 👇 👇 👇
