Nasdaq trading insights: 26-May-2025Nasdaq trading insights: Not signals, but informative zones to aid your decision-making. Please note: These zones are not trading advice. Use them as a starting point for your own analysis.
Nasdaqsignals

#NQ1! "E-Mini Nasdaq 100" Index Market Bullish Robbery Plan 🌟Hi! Hola! Ola! Bonjour! Hallo! Marhaba!🌟
Dear Money Makers & Robbers, 🤑 💰💸✈️
Based on 🔥Thief Trading style technical and fundamental analysis🔥, here is our master plan to heist the NQ1! "E-Mini Nasdaq 100" Index Market Heist. Please adhere to the strategy I've outlined in the chart, which emphasizes long entry. Our aim is to escape near the high-risk YELLOW MA Zone. It's a Risky level, overbought market, consolidation, trend reversal, trap at the level where traders and bearish robbers are stronger. 🏆💸"Take profit and treat yourself, traders. You deserve it!💪🏆🎉
Entry 📈 : "The heist is on! Wait for the Crossing previous high (19800) then make your move - Bullish profits await!"
however I advise to Place Buy stop orders above the Moving average (or) Place buy limit orders within a 15 or 30 minute timeframe most recent or swing, low or high level for Pullback entries.
📌I strongly advise you to set an "alert (Alarm)" on your chart so you can see when the breakout entry occurs.
Stop Loss 🛑: "🔊 Yo, listen up! 🗣️ If you're lookin' to get in on a buy stop order, don't even think about settin' that stop loss till after the breakout 🚀. You feel me? Now, if you're smart, you'll place that stop loss where I told you to 📍, but if you're a rebel, you can put it wherever you like 🤪 - just don't say I didn't warn you ⚠️. You're playin' with fire 🔥, and it's your risk, not mine 👊."
📍 Thief SL placed at the nearest/swing low level Using the 2H timeframe (19200) Day trade basis.
📍 SL is based on your risk of the trade, lot size and how many multiple orders you have to take.
🏴☠️Target 🎯: 20500
🧲Scalpers, take note 👀 : only scalp on the Long side. If you have a lot of money, you can go straight away; if not, you can join swing traders and carry out the robbery plan. Use trailing SL to safeguard your money 💰.
💰💵💸NQ1! "E-Mini Nasdaq 100" Index Money Heist Plan is currently experiencing a bullishness,., driven by several key factors. .☝☝☝
📰🗞️Get & Read the Fundamental, Macro Economics, COT Report, Geopolitical and News Analysis, Sentimental Outlook, Intermarket Analysis, Index-Specific Analysis, Future trend targets with Overall outlook score... go ahead to check 👉👉👉🔗🔗🌎🌏🗺
⚠️Trading Alert : News Releases and Position Management 📰🗞️🚫🚏
As a reminder, news releases can have a significant impact on market prices and volatility. To minimize potential losses and protect your running positions,
we recommend the following:
Avoid taking new trades during news releases
Use trailing stop-loss orders to protect your running positions and lock in profits
💖Supporting our robbery plan 💥Hit the Boost Button💥 will enable us to effortlessly make and steal money 💰💵. Boost the strength of our robbery team. Every day in this market make money with ease by using the Thief Trading Style.🏆💪🤝❤️🎉🚀
I'll see you soon with another heist plan, so stay tuned 🤑🐱👤🤗🤩

USTEC100 Chart 4H, Trends To Watch for Short The provided USTEC 100 (US Tech 100) 4-hour chart highlights a strategic short (sell) trade setup based on technical price action and defined risk levels. The analysis suggests a bearish market bias, provided that specific price conditions are met and maintained. Let's explore the details and rationale behind this trade idea to understand how traders might approach this setup with calculated entries, targets, and stops.
As per the current market data presented, USTEC 100 is trading around 21,115.00 on Monday, 19 May 2025. The chart emphasizes a critical resistance zone highlighted in red, located at approximately 21,445.10. This level acts as a potential invalidation point for the short trade. If the price crosses above this red zone and a full candle closes above it, the entire bearish setup becomes invalid. This is a key condition – any move above this threshold signifies a shift in market sentiment and cancels the downward outlook.


(NQ) | Strong Buyers and Blue‑Box Entry Zones(NQ) | Strong Buyers and Blue‑Box Entry Zones
NQ shows powerful buying pressure, and the marked blue boxes highlight areas where demand has reliably appeared. For those seeking long exposure, two approaches stand out:
Low‑Time‑Frame Breakouts from the Blue Box
Wait for price to dip into a blue‑boxed support zone and then break higher on shorter time frames. A decisive move with rising footprint volume confirms genuine buyer commitment.
Direct Low‑Time‑Frame Breakouts
If price skips a pullback and powers upward on low‑time‑frame charts, that momentum surge—backed by substantial volume—also provides a valid long entry.
Key Considerations
Ensure any breakout is backed by real volume footprint signals, not just price movement.
If these zones fail to hold or volume dries up, stand aside and await the next confirmed setup.
By focusing on these blue‑boxed areas and insisting on volume‑confirmed breakouts, you align your entries with where buyers truly dominate.
📌I keep my charts clean and simple because I believe clarity leads to better decisions.
📌My approach is built on years of experience and a solid track record. I don’t claim to know it all but I’m confident in my ability to spot high-probability setups.
📌If you would like to learn how to use the heatmap, cumulative volume delta and volume footprint techniques that I use below to determine very accurate demand regions, you can send me a private message. I help anyone who wants it completely free of charge.
🔑I have a long list of my proven technique below:
🎯 ZENUSDT.P: Patience & Profitability | %230 Reaction from the Sniper Entry
🐶 DOGEUSDT.P: Next Move
🎨 RENDERUSDT.P: Opportunity of the Month
💎 ETHUSDT.P: Where to Retrace
🟢 BNBUSDT.P: Potential Surge
📊 BTC Dominance: Reaction Zone
🌊 WAVESUSDT.P: Demand Zone Potential
🟣 UNIUSDT.P: Long-Term Trade
🔵 XRPUSDT.P: Entry Zones
🔗 LINKUSDT.P: Follow The River
📈 BTCUSDT.P: Two Key Demand Zones
🟩 POLUSDT: Bullish Momentum
🌟 PENDLEUSDT.P: Where Opportunity Meets Precision
🔥 BTCUSDT.P: Liquidation of Highly Leveraged Longs
🌊 SOLUSDT.P: SOL's Dip - Your Opportunity
🐸 1000PEPEUSDT.P: Prime Bounce Zone Unlocked
🚀 ETHUSDT.P: Set to Explode - Don't Miss This Game Changer
🤖 IQUSDT: Smart Plan
⚡️ PONDUSDT: A Trade Not Taken Is Better Than a Losing One
💼 STMXUSDT: 2 Buying Areas
🐢 TURBOUSDT: Buy Zones and Buyer Presence
🌍 ICPUSDT.P: Massive Upside Potential | Check the Trade Update For Seeing Results
🟠 IDEXUSDT: Spot Buy Area | %26 Profit if You Trade with MSB
📌 USUALUSDT: Buyers Are Active + %70 Profit in Total
🌟 FORTHUSDT: Sniper Entry +%26 Reaction
🐳 QKCUSDT: Sniper Entry +%57 Reaction
📊 BTC.D: Retest of Key Area Highly Likely
📊 XNOUSDT %80 Reaction with a Simple Blue Box!
📊 BELUSDT Amazing %120 Reaction!
📊 Simple Red Box, Extraordinary Results
I stopped adding to the list because it's kinda tiring to add 5-10 charts in every move but you can check my profile and see that it goes on..

NASDAQ Critical level for short-term.Nasdaq (NDX) is testing a strong short-term Support Cluster, the Lower Lows trend-line and the bottom of the 1H Channel Up. Being below the 1H MA50 (blue trend-line), the trend is right now neutral until one of the two levels breaks.
If the index breaks above the 1H MA50, we will turn bullish again, targeting 22200 (+5.70% from the current Low, the minimum % rise in the past month).
If it breaks below the Support Cluster, we will turn bearish, targeting the 1H MA200 (orange trend-line) at 20800.
-------------------------------------------------------------------------------
** Please LIKE 👍, FOLLOW ✅, SHARE 🙌 and COMMENT ✍ if you enjoy this idea! Also share your ideas and charts in the comments section below! This is best way to keep it relevant, support us, keep the content here free and allow the idea to reach as many people as possible. **
-------------------------------------------------------------------------------Disclosure: I am part of Trade Nation's Influencer program and receive a monthly fee for using their TradingView charts in my analysis.
💸💸💸💸💸💸
👇 👇 👇 👇 👇 👇

NASDAQ Trade Setup: Bullish Bias, But Waiting for Retrace!✅ NASDAQ Breakdown: Waiting for the Retrace 🎯
I'm currently watching the NASDAQ 🧠, and here's what I'm seeing across multiple timeframes:
📈 Daily & 4H Timeframes show a strong bullish rally with significant momentum. However, in my view, price is overextended and currently trading at a premium.
📉 Although my bias remains bullish, I'm anticipating a retracement into equilibrium—specifically around the 50% to 61.8% Fibonacci zone 🔁. This would offer a more favorable entry based on value.
📊 In this video, I walk you through:
- The overall trend direction
- Where and how we can anticipate a break of market structure for a clean entry
- Why my buy idea is conditional on the 30-minute chart trending down, then flipping bullish via a structure break 🔄
⚠️ Patience is key! The trade setup may play out at various price levels—wait for confirmation from price action, as detailed in the video 🎥.

NASDAQ broke above its 1D MA200 after 2 months! Target 22000.Nasdaq (NDX) broke today above its 1D MA200 (orange trend-line) for the first time in more than 2 months (since March 06), following the U.S. - Chine trade deal. This trend-line also had the March 26 rejection under its belt, which initiated the most aggressive part of the 'Trade War' correction.
The last time the index broke above its 1D MA200 on a similar pattern was when it was recovering after the bottom of the 2022 Inflation Crisis. The February 01 2023 break-out produced an instant rise to the 1.382 Fibonacci extension before a short-term correction to re-test the 1D MA200.
As a result, we expect 22000 (1.382 Fib ext) to come as early as this week before any discussions can be made for a new pull-back.
-------------------------------------------------------------------------------
** Please LIKE 👍, FOLLOW ✅, SHARE 🙌 and COMMENT ✍ if you enjoy this idea! Also share your ideas and charts in the comments section below! This is best way to keep it relevant, support us, keep the content here free and allow the idea to reach as many people as possible. **
-------------------------------------------------------------------------------
Disclosure: I am part of Trade Nation's Influencer program and receive a monthly fee for using their TradingView charts in my analysis.
💸💸💸💸💸💸
👇 👇 👇 👇 👇 👇

NASDAQ 2m Chart PO3 Acc, Manip Dist - Last Hour Party?Even though today has been crazy think a little sanity has setup for a classic ICT AMD play.
As of writing this we are in Accumulation. Watch for what appears to be a run higher, that gets hammered.
The last hour of the trading day on the 2m chart crosses above the 75 SMA, maybe it's pump time?
Check it out, gimmi feedback.
Thanks!
Craig

NAS - SLOWLY enter the long positionTeam, NAS time to buy slowly
We been waiting for the last two day
as we expect market will drop before RATE announcement
this is a good entry but buy slowly
if it drop to second box, double up.. the volume
Trade with confident.

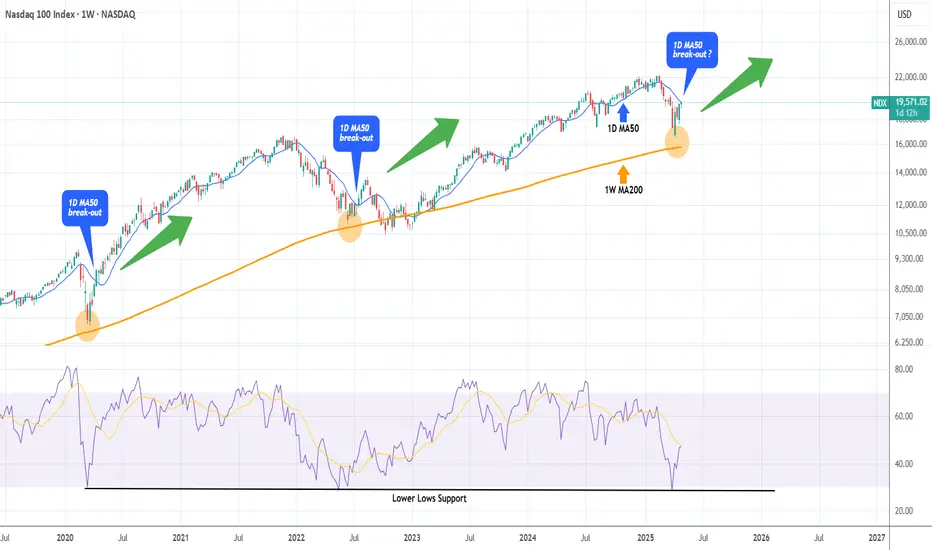
NASDAQ's Inverse H&S that targets $25000Nasdaq (NDX) is forming the Right Shoulder of a potential Inverse Head and Shoulders (IH&S) pattern. The price action is 'stuck' within the 1D MA200 (orange trend-line), which got tested on Friday for the first time since March, and the 1D MA50 (blue trend-line).
Since the 1D MA200 was the level that initiated the March 26 rejection, it is possible to see a short-term pull-back now, all in the process of forming the Right Shoulder and after the market digests the new Fed Rate Decision, starts the next Leg Up. Note that the 1D RSI is already on its February highs.
As a result, our long-term Target is at 25000, just below the 2.0 Fibonacci extension level, which is a standard technical target for IH&S patterns.
-------------------------------------------------------------------------------
** Please LIKE 👍, FOLLOW ✅, SHARE 🙌 and COMMENT ✍ if you enjoy this idea! Also share your ideas and charts in the comments section below! This is best way to keep it relevant, support us, keep the content here free and allow the idea to reach as many people as possible. **
-------------------------------------------------------------------------------
Disclosure: I am part of Trade Nation's Influencer program and receive a monthly fee for using their TradingView charts in my analysis.
💸💸💸💸💸💸
👇 👇 👇 👇 👇 👇

Week ahead analysis May 4th to 11th**Week Ahead Analysis (May 5 – May 11, 2025)**
### **Baseline: Market Expectations**
- **Tariffs & Fed Policy:** Trump's tariff announcement has heightened concerns about economic slowing, prompting bond markets to price in up to four Federal Reserve rate cuts this year.
- **Trade Talks & Sentiment Shift:** Reports suggest China may restart trade negotiations, boosting risk sentiment. However, China insists the U.S. must first remove all unilateral tariffs, adding uncertainty to the discussions.
- **Market Reaction:** Risk assets—equities and high-beta currencies like AUD, NZD, and CAD—are climbing as volatility cools. Meanwhile, safe havens such as JPY, CHF, and gold are facing selling pressure, though overall risk sentiment remains cautious.
### **Potential Surprise Scenarios**
- **Trade Deal Secured:** A deal would likely send equities higher, strengthen risk-sensitive currencies, and drive safe havens lower.
- **No Deal Reached:** In contrast, safe havens could gain while risk assets retreat.
### **Big Picture Outlook**
Regardless of the immediate outcome, the market's medium-term trajectory hinges on the broader effects of trade policy. If tariffs persist, economic uncertainty may sustain the Fed’s dovish stance. A successful trade deal, however, could restore confidence, shifting expectations back toward growth stabili

Bullish till March 26 High but open for retrace.We are at a daily -BPR at the moment. All daily candles have been bullish so far since April 22. The whole sentiment behind this has been the 90 day tariff pause.
There definitely is a mix of fundamental and technical reasons for both bullish and bearish bias once we achieve this target.
For this week, I would look for a long entry only if NQ retraces lower first. Otherwise would have to just watch it do its thing. Once we hit the March 26 High, I am very open for NQ to go to All time high again because that is what it historically does but I am also completely open for it to start dumping to monthly lows because it seems that the sell-side was not hit and the higher lows made on the 4H chart seem to be very low resistance targets.
Not a good time to marry a bias.

US100 / NASDAQ#US100 BEST PLACE TO SELL FROM|SHORT🔴
📉US100 SIGNAL
✔️Trade Direction: short
✔️Entry Level: 20,101.6
✔️Target Level: 18,779.9
✔️Stop Loss: 20,975.6
📊RISK PROFILE
⭐️Risk level: medium
⭐️Suggested risk: 1%
⭐️Timeframe: 1D
——————

NASDAQ testing its 1D MA50. Break-out or Fake-out?Nasdaq (NDX) has reached its 1D MA50 (blue trend-line) for the first time since February 24. Following the (near) rebound on the 1W MA200 (orange trend-line), this looks like a textbook recovery from a correction to a new long-term Bullish Leg.
Chronologically the last such correction was the March 2020 COVID flash crash, which after it almost touched the 1W MA200, it recovered as fast as the current rebound and when it broke above its 1D MA50, it turned it into the Support of the new long-term Bullish Leg.
What wasn't a break-out but a fake-out was the rebound after the June 13 2022 (near) 1W MA200 rebound, when the break above the 1D MA50 was false as it produced a new rejection and sell-off later on. The difference is that 2022 was a technical Bear Cycle both in terms of length and strength.
Whatever the case, Nasdaq has seen the lowest 1W RSI (oversold) reading among those 3 bottoms. So do you think today's 1D MA50 test is a break-out or fake-out?
-------------------------------------------------------------------------------
** Please LIKE 👍, FOLLOW ✅, SHARE 🙌 and COMMENT ✍ if you enjoy this idea! Also share your ideas and charts in the comments section below! This is best way to keep it relevant, support us, keep the content here free and allow the idea to reach as many people as possible. **
-------------------------------------------------------------------------------
💸💸💸💸💸💸
👇 👇 👇 👇 👇 👇
Nasdaq analysis: 30-APRIL-2025Good morning. Welcome to today's Nasdaq market analysis and educational insights for price action traders.

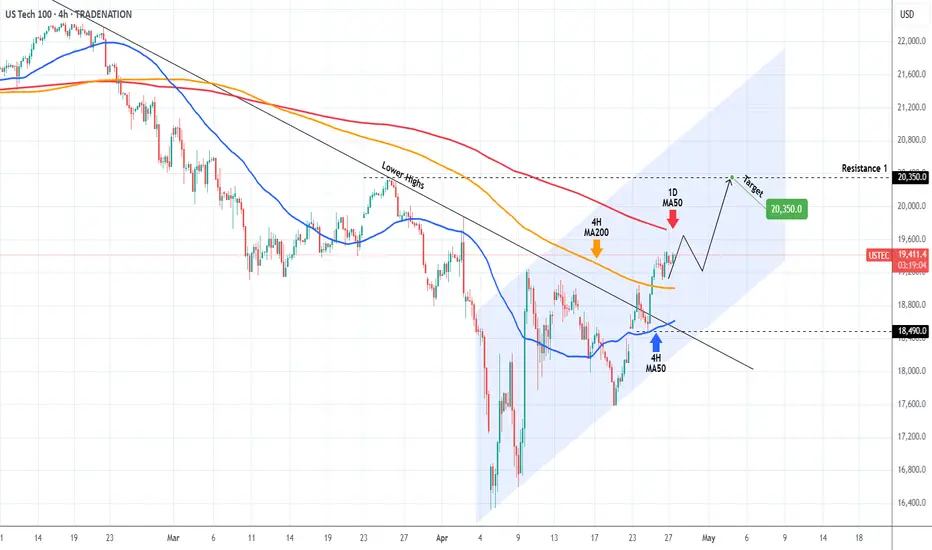
NASDAQ ahead of the most critical Resistance test.Nasdaq (NDX) not only broke above the Lower Highs trend-line of its All Time High (ATH) last week but managed to break and turn the 4H MA200 (orange trend-line) into Support.
It is now aiming for the 1D MA50 (red trend-line), which is the most crucial Resistance level of this recovery attempt and is what technically turns bearish trends into bullish if it turns into Support.
We expect a short-term rejection there, which should give a buy opportunity near the 4H MA200. Our Target for this is 20350 (Resistance 1).
-------------------------------------------------------------------------------
** Please LIKE 👍, FOLLOW ✅, SHARE 🙌 and COMMENT ✍ if you enjoy this idea! Also share your ideas and charts in the comments section below! This is best way to keep it relevant, support us, keep the content here free and allow the idea to reach as many people as possible. **
-------------------------------------------------------------------------------
Disclosure: I am part of Trade Nation's Influencer program and receive a monthly fee for using their TradingView charts in my analysis.
💸💸💸💸💸💸
👇 👇 👇 👇 👇 👇
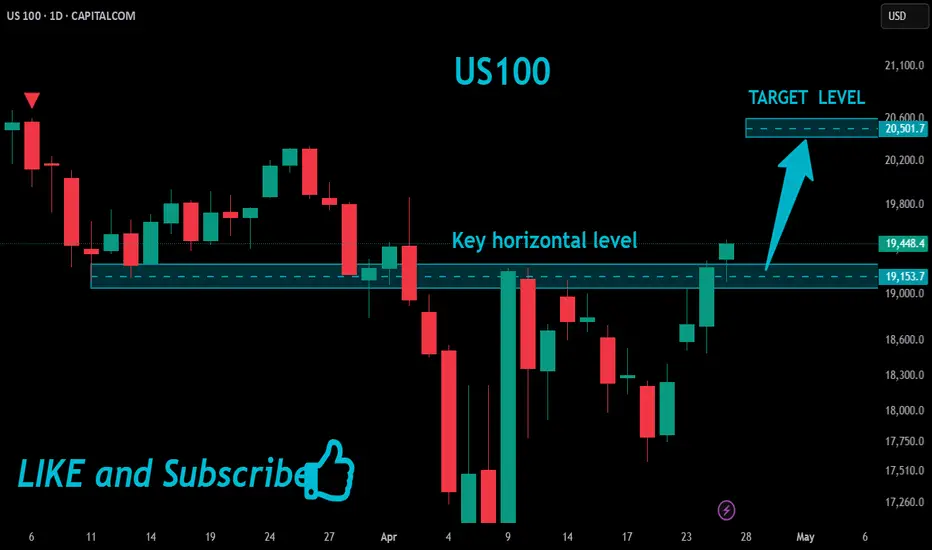
US100 Bullish Breakout!
HI,Traders !
US100 is trading in an
Uptrend and the pair made
A bullish breakout of the
Key horizontal level of 19153.7
And the breakout is confirmed
So we will be expecting a
Further bullish move up !
Comment and subscribe to help us grow !
NASDAQ MEGA BOUNCE ZONEI want to see a super bounce from this demand zone tomorrow due to the recent reactions around this price level. Lots of interest being shown here. I am sized in pretty heftily on MNQ futures. In a $0 or HERO position. WIll be closing my laptop now...

cup with handle pattern on the 1-hour time frameWelcome to today's analysis! Let’s break down the current price action on NASDAQ:NVDA and potential trade setups.
🌐 Overview: NASDAQ:NVDA Forming a Cup with Handle Pattern
📈 NASDAQ:NVDA is currently forming a cup with handle pattern on the 1-hour time frame. This pattern is typically bullish and could indicate a potential upward move.
🔄 Current Scenario:
NASDAQ:NVDA has formed a cup shape and is now developing the handle. The handle is a consolidation phase before a potential breakout.
The key level to watch is the resistance at the top of the handle. A breakout above this level could signal a bullish continuation.
🔑 Key Levels to Watch
🔴 Resistance: Top of the Handle (Needs breakout for continuation)
🟢 Target: Measured move equal to the depth of the cup, projected from the breakout point.
🛠️ Trade Scenarios
📌 Bullish Scenario (Breakout Above Resistance)
If NASDAQ:NVDA breaks and holds above the handle resistance, it could move toward the target level.
This breakout would confirm the cup with handle pattern and suggest a potential upward trend.
📌 Bearish Scenario (Failure to Breakout)
If NASDAQ:NVDA fails to break out and instead moves lower, it could retest the support levels within the cup or handle.
A failure to hold above key support levels could indicate a potential reversal or further consolidation.
📌 Conclusion
NASDAQ:NVDA is forming a cup with handle pattern on the 1-hour time frame. A breakout above the handle resistance could signal a bullish move toward the target level. If the price fails to break out, further consolidation or a retest of support levels may be necessary.

Nasdaq market analysis: 23-APRIL-2025Good morning Dear Traders! Join me for Nasdaq market analysis for today. Share your charts, ask questions, and let's discuss trading strategies.

NASDAQ Decision making becomes easy after seeing this chart.NASDAQ (NDX) is currently on the 3rd straight red month (1M candle), following the February High and subsequent sell-off due to the Trade War. This has been analyzed extensively in previous analyses and how the fundamental scene is only now starting to show some positive progress but still has a long way to go.
Technically though, the picture is very clear and favors long-term investing. The market has been trading within a Fibonacci Channel Up since the U.S. Housing Crisis in 2008 and along with the 2022 Inflation Crisis, those have been the only real Bear Cycle events in the past 18 years.
In between those there have been another 5 shorter term corrections, that offered great buying opportunities for the long-term and the recent 3-month one classifies as one.
There reasons are three. First it has come very close to the 1M MA50 (blue trend-line), which only broke during the Major Corrections. Second, the 1M RSI hit the 50.50 Symmetrical Support, which has held during all those 5 prior Minor Corrections. Third, those corrections only range between two Fibonacci levels.
The current correction fulfills all those conditions. And since the 'weakest' rally we've have on this 5 event sample has been +37.57% and the strongest +96.77%, we have a medium-term Target on Nasdaq at 22800 and a long-term one at 32500.
Do you still reserve doubts at investing long-term after seeing this macro chart?
-------------------------------------------------------------------------------
** Please LIKE 👍, FOLLOW ✅, SHARE 🙌 and COMMENT ✍ if you enjoy this idea! Also share your ideas and charts in the comments section below! This is best way to keep it relevant, support us, keep the content here free and allow the idea to reach as many people as possible. **
-------------------------------------------------------------------------------
💸💸💸💸💸💸
👇 👇 👇 👇 👇 👇

US100 Will Grow !
HI,Traders !
US100 is trading in an
Uptrend and the price is
Now consolidating above
The horizontal support
Of 18178.2 and as we are
Bullish biased we will be
Expecting a further bullish
Move up !
Comment and subscribe to help us grow !
