Nasdaq: Out of Breath? 😮💨Instead of rising further North to exceed the resistance line at 12 145 points, it seems like someone is out of breath and choosing an easier road in the South. If the Nasdaq carries on with those downward tendencies and crosses the support line at 10 636 points, our alternative scenario with a probability of 40% will be activated. In that case, we would expect the course to drop into the turquoise target zone to complete the dark green wave alt. . Primarily, we strongly believe that the Nasdaq fulfills the climb to the orange target zone to finish the orange wave iii. Followed by a minor correction in order to complete the orange wave iv, the course can rise up North again, once the orange iv reached its low.
Nasdaqsignals

Nasdaq Analysis 06.01.2023Hello Traders,
welcome to this free and educational analysis.
I am going to explain where I think this asset is going to go over the next few days and weeks and where I would look for trading opportunities.
If you have any questions or suggestions which asset I should analyse tomorrow, please leave a comment below.
I will personally reply to every single comment!
If you enjoyed this analysis, I would definitely appreciate it, if you smash that like button and maybe consider following my channel.
Thank you for watching and I will see you tomorrow!
You can also check out my previous analysis:


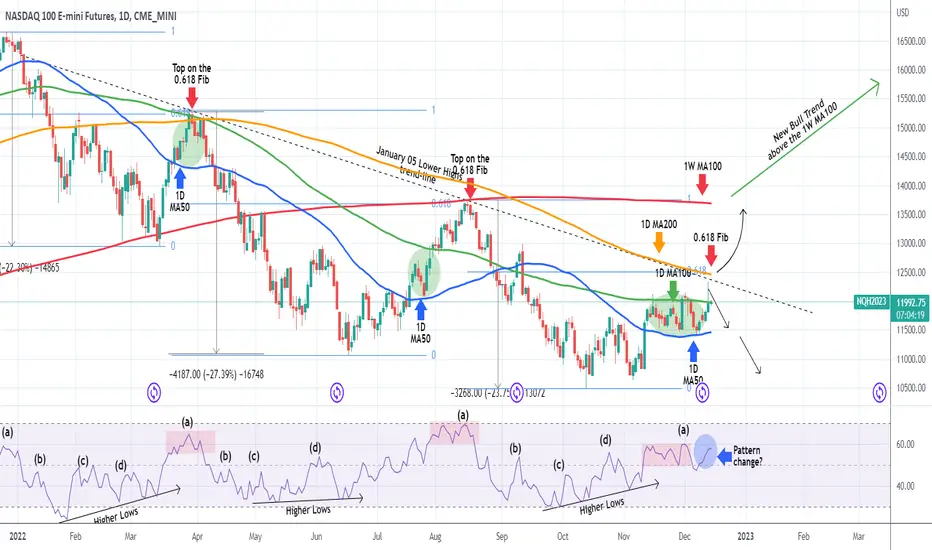
NASDAQ Don't look beyond this confirmed signalsNasdaq (NDX) hit last week and is so far holding the top of the 10500 - 10750 Support Zone, that has been in effect ever since the October 13 Bottom. As you see, the index has been under the Bear Market's Lower Highs trend-line since January 05, so essentially for a full year. The last rejection on it (December 13) was also made just below the 1D MA200 (orange trend-line) and the 0.618 Fibonacci retracement level from the previous (Lower High).
This practically keeps the index trapped and currently neutral. A confirmed buy signal would be a break above the 1D MA50 (blue trend-line), targeting again the 1 year Lower Highs trend-line, while a confirmed sell signal would be a break below 10500, targeting the -0.118 Fibonacci extension (10110).
-------------------------------------------------------------------------------
** Please LIKE 👍, FOLLOW ✅, SHARE 🙌 and COMMENT ✍ if you enjoy this idea! Also share your ideas and charts in the comments section below! This is best way to keep it relevant, support me, keep the content here free and allow the idea to reach as many people as possible. **
-------------------------------------------------------------------------------
You may also TELL ME 🙋♀️🙋♂️ in the comments section which symbol you want me to analyze next and on which time-frame. The one with the most posts will be published tomorrow! 👏🎁
-------------------------------------------------------------------------------
💸💸💸💸💸💸
👇 👇 👇 👇 👇 👇

Nasdaq Analysis 26.12.2022Hello Traders,
welcome to this free and educational analysis.
I am going to explain where I think this asset is going to go over the next few days and weeks and where I would look for trading opportunities.
If you have any questions or suggestions which asset I should analyse tomorrow, please leave a comment below.
I will personally reply to every single comment!
If you enjoyed this analysis, I would definitely appreciate it, if you smash that like button and maybe consider following my channel.
Thank you for watching and I will see you tomorrow!
You can also check out my previous analysis of this asset:

Nasdaq Analysis 18.12.2022Hello Traders,
welcome to this free and educational analysis.
I am going to explain where I think this asset is going to go over the next few days and weeks and where I would look for trading opportunities.
If you have any questions or suggestions which asset I should analyse tomorrow, please leave a comment below.
I will personally reply to every single comment!
If you enjoyed this analysis, I would definitely appreciate it, if you smash that like button and maybe consider following my channel.
Thank you for watching and I will see you tomorrow!
You can also check out my previous analysis:

nasdaq update if it doesn’t lose 11175 , it can be assume this move for long term , i see new floor is here

NASDAQ rejected on the 1 year Resistance! How bearish is that?The Nasdaq index (NDX) rose yesterday aggressively after the lower than expected U.S. CPI but got rejected exactly on the 1 year Lower Highs trend-line (started on January 05), just below the 0.618 Fibonacci, as we showed on our analysis 2 weeks ago:
As you see, this is the exact cluster level (Lower Highs on 0.618 Fib) that the Highs of March 29 and August 16 were rejected. As a result, this doesn't alter our long-term perspective which continues to be based on break-outs. The 1D MA200 (orange trend-line) has been intact since April 05 and if the price breaks above it, we will turn bullish again, targeting the 1W MA100 (red trend-line), which rejected the August 16 High.
As long as the price is below the Lower Highs trend-line, we will be targeting the 1D MA50 (blue trend-line) where a candle close below will bring more selling pressure towards the Nov - Oct Lows.
It is worth mentioning though that the 4H RSI pattern that has been consistent in the previous Lower Lows - Lower Highs sequence these past 12 months, turned upwards (blue circle) instead of downwards. This may be an early signal that there is a long-term trend shift from bearish to bullish.
-------------------------------------------------------------------------------
** Please LIKE 👍, SUBSCRIBE ✅, SHARE 🙌 and COMMENT ✍ if you enjoy this idea! Also share your ideas and charts in the comments section below! This is best way to keep it relevant, support me, keep the content here free and allow the idea to reach as many people as possible. **
-------------------------------------------------------------------------------
You may also TELL ME 🙋♀️🙋♂️ in the comments section which symbol you want me to analyze next and on which time-frame. The one with the most posts will be published tomorrow! 👏🎁
-------------------------------------------------------------------------------
💸💸💸💸💸💸
👇 👇 👇 👇 👇 👇
Nasdaq Analysis 11.12.2022Hello Traders,
welcome to this free and educational analysis.
I am going to explain where I think this asset is going to go over the next few days and weeks and where I would look for trading opportunities.
If you have any questions or suggestions which asset I should analyse tomorrow, please leave a comment below.
I will personally reply to every single comment!
If you enjoyed this analysis, I would definitely appreciate it, if you smash that like button and maybe consider following my channel.
Thank you for watching and I will see you tomorrow!
You can also check out my previous analysis:

NAS 100 weekly analysisNAS 100 weekly analysis on a daily chart. The market structure is on a down move, which means that the market is bearish. The price is closer to the resistance trendline. If the current counter trendline holds the price will push up to challenge the resistance level but if it doesn't hold the price will move down. The best option is to wait for a breakout before taking a trade.

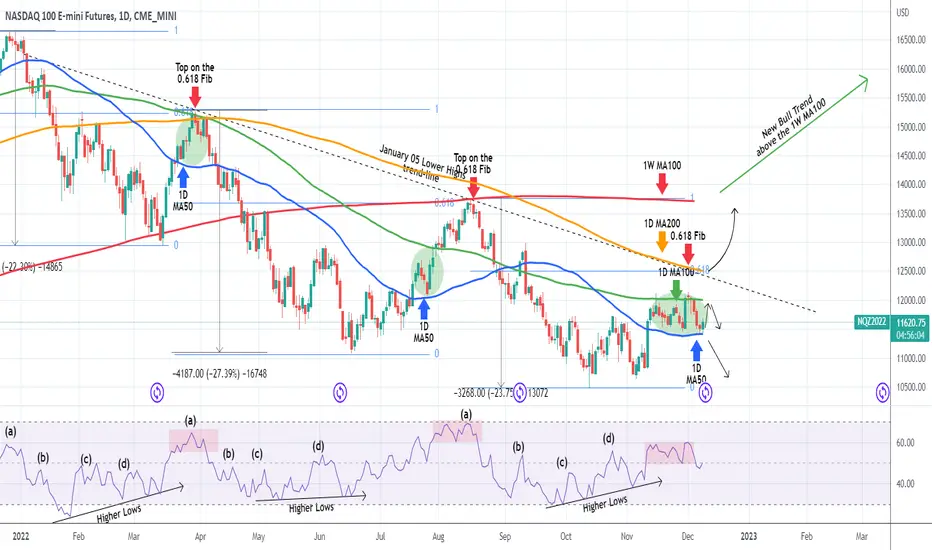
NASDAQ Almost 1 month trapped within the 1D MA50 - MA100Nasdaq (NDX) has been trading sideways since November 10, with the 1D MA50 (blue trend-line) as Support and the 1D MA100 (green trend-line) as Resistance. On a wide scale, this technically looks like the previous two market tops on the January 05 Lower Highs trend-line, and the 1D RSI illustrates that clearly. However, the Jul 19 - 28 consolidation within the 1D MA50/100 zone, did make a higher extension, so it is best to stay on the sidelines until we have a clear, confirmed break-out signal.
As long as the price remains within the 1D MA50 and 1D MA100, short-term traders can scalp the range. Since the January 05 Lower Highs trend-line is getting closer and closer to the 1D MA100, there is high risk in taking a buy break-out trade there. As the 1D MA200 is unbroken since April 05, it is best to take the break-out buy if a 1D candle closes above the 1D MA200 (orange trend-line), which would be also a break above the 0.618 Fibonacci level and target the 1W MA100 (red trend-line), which would be also a test of the 13,760 August 16 High.
On the other hand, a 1D candle close below the 1D MA50, would be bearish targeting 10850 and quite possibly aiming at a new (Lower) Low.
Notice that the 0.618 Fibonacci level is a critical Resistance level as it is where Nasdaq topped both on the March 29 and August 16 Lower Highs.
Also notice that the 1W MA100 is where the August 16 High was rejected.
-------------------------------------------------------------------------------
** Please LIKE 👍, SUBSCRIBE ✅, SHARE 🙌 and COMMENT ✍ if you enjoy this idea! Also share your ideas and charts in the comments section below! This is best way to keep it relevant, support me, keep the content here free and allow the idea to reach as many people as possible. **
-------------------------------------------------------------------------------
You may also TELL ME 🙋♀️🙋♂️ in the comments section which symbol you want me to analyze next and on which time-frame. The one with the most posts will be published tomorrow! 👏🎁
-------------------------------------------------------------------------------
💸💸💸💸💸💸
👇 👇 👇 👇 👇 👇
Nasdaq update for this week (updating all the time)Hello guys,
When I post stuff here, these are not just ideas, I actually trade like this.
So let's get started:
Had a brilliant week trading last week so this week what I am looking at is this big R1 level. It is important for nasdaq to go past this level in order to see any sort of an uptrend confirmation. We saw on Friday, how hard the dollar was hanging from the 4hr support level and trying not to crash. And I doubt it will crash as soon as the market opens so I am seeing a pump or a little up movement at open for the dollar. Which makes nasdaq go lower. It is important for nasdaq to stay above and in the area of S1 in order for it not to crash this week.
As we saw on Friday NFP data was favouring the dollar and it could reflect the coming week and bring the dollar up from weeks of battering.
My final take is that if it continues the way I am suggesting nasdaq could tank back to 11.6k or even 10.8k levels. I will keep updating once the market is open.

Nasdaq Analysis 05.12.2022Hello Traders,
welcome to this free and educational analysis.
I am going to explain where I think this asset is going to go over the next few days and weeks and where I would look for trading opportunities.
If you have any questions or suggestions which asset I should analyse tomorrow, please leave a comment below.
I will personally reply to every single comment!
If you enjoyed this analysis, I would definitely appreciate it, if you smash that like button and maybe consider following my channel.
Thank you for watching and I will see you tomorrow!
You can also check out my previous analysis:

NASDAQ 20 days trapped within the 1D MA50 - MA100Nasdaq (NDX) has been trading sideways since November 10, with the 1D MA50 (blue trend-line) as Support and the 1D MA100 (green trend-line) as Resistance. On a wide scale, this technically looks like the previous two market tops on the January 05 Lower Highs trend-line, and the 1D RSI illustrates that clearly. However, the Jul 19 - 28 consolidation within the 1D MA50/100 zone, did make a higher extension, so it is best to approach this with our usual break-out strategy.
A 1D candle closing below the 1D MA50, would be bearish targeting 10850 and quite possibly aiming at a new (Lower) Low. On the other hand, a closing above the 1D MA100, will be treated as a short-term bullish extension signal to the 0.618 Fibonacci level and the 1D MA200 (orange trend-line), which is where Nasdaq topped both on March 29 and August 16.
A closing above the 1D MA200 would translate into a break above the January 05 Lower Highs trend-line, in which case, we will target the 1W MA100 (red trend-line), which rejected the uptrend last time on the August 16 High.
-------------------------------------------------------------------------------
** Please LIKE 👍, SUBSCRIBE ✅, SHARE 🙌 and COMMENT ✍ if you enjoy this idea! Also share your ideas and charts in the comments section below! This is best way to keep it relevant, support me, keep the content here free and allow the idea to reach as many people as possible. **
-------------------------------------------------------------------------------
You may also TELL ME 🙋♀️🙋♂️ in the comments section which symbol you want me to analyze next and on which time-frame. The one with the most posts will be published tomorrow! 👏🎁
-------------------------------------------------------------------------------
💸💸💸💸💸💸
👇 👇 👇 👇 👇 👇

NASDAQ setting course for 12500Nasdaq (NDX) completed its short-term technical pull-back, as it held the 1D MA50 (blue trend-line) after it was rejected on the 1D MA100 (green trend-line). This doesn't change our outlook presented two weeks ago:
This profit-taking retracement was part of the greater plan, as the index remains within the tolerance levels of the previous counter-trend rebounds of the 2022 Bear Cycle, all of whom hit the Lower Highs trend-line that started on January 05.
As you see denoted by the green circle, every break above the 1D MA50 (blue trend-line) made a pull-back to test it as a Support shortly after. In terms of RSI , it appears that relative to the rallies of mid-March and July-August, we are just past the Red Flag. Now the minimum target on this bullish sequence is the Jan Lower Highs trend-line, that most likely will make a match on the 0.618 Fibonacci (as both previous rallies) and the 1D MA200 (orange trend-line) around the 12500 mark.
-------------------------------------------------------------------------------
** Please LIKE 👍, SUBSCRIBE ✅, SHARE 🙌 and COMMENT ✍ if you enjoy this idea! Also share your ideas and charts in the comments section below! This is best way to keep it relevant, support me, keep the content here free and allow the idea to reach as many people as possible. **
-------------------------------------------------------------------------------
You may also TELL ME 🙋♀️🙋♂️ in the comments section which symbol you want me to analyze next and on which time-frame. The one with the most posts will be published tomorrow! 👏🎁
-------------------------------------------------------------------------------
👇 👇 👇 👇 👇 👇
💸💸💸💸💸💸
👇 👇 👇 👇 👇 👇
Nasdaq: On the riseNasdaq is currently taking baby steps along the orange target zone between 11 809 and 11 463 points and is expected to move out of the orange zone to climb right into the blue target zone. Moving further North, the blue wave (iii) should be completed in the blue zone between 12 657 and 13 429 points before pushing the course back South. After that minor correction, the trend should move up in the long term to complete we pink wave .

Nasdaq Analysis 17.11.2022Welcome to the BasicTrading channel.
My name is Philip and in todays analysis I quickly go over the situation which we currently have on Nas100.
I will analyse the asset both from a weekly and daily timeframe to show you the best possible trading opportunities.
If you enjoyed this analysis, let me know in the comment section which asset I should analyse tomorrow.
I will personally reply to every single comment.
Dont forget to smash that rocket and I will see you tomorrow with a new analysis.

NASDAQ Small technical pull-back part of the plan.Nasdaq (NDX) is on a short-term technical pull-back after it was rejected on the 1D MA100 (green trend-line). This doesn't change our outlook presented last week:
This profit-taking retracement is part of the greater plan, as the index remains within the tolerance levels of the previous counter-trend rebounds of the 2022 Bear Cycle, all of whom hit the Lower Highs trend-line that started on January 05.
As you see denoted by the green circle, every break above the 1D MA50 (blue trend-line) made a pull-back to test it as a Support shortly after. In terms of RSI, it appears that relative to the rallies of mid-March and July-August, we are where the Red Flag is. After the 1D MA50 pull-back is completed, the minimum target on this bullish sequence is the Jan Lower Highs trend-line, that most likely will make a match on the 0.618 Fibonacci (as both previous rallies) and the 1D MA200 (orange trend-line).
-------------------------------------------------------------------------------
** Please LIKE 👍, SUBSCRIBE ✅, SHARE 🙌 and COMMENT ✍ if you enjoy this idea! Also share your ideas and charts in the comments section below! This is best way to keep it relevant, support me, keep the content here free and allow the idea to reach as many people as possible. **
-------------------------------------------------------------------------------
You may also TELL ME 🙋♀️🙋♂️ in the comments section which symbol you want me to analyze next and on which time-frame. The one with the most posts will be published tomorrow! 👏🎁
-------------------------------------------------------------------------------
👇 👇 👇 👇 👇 👇
💸💸💸💸💸💸
👇 👇 👇 👇 👇 👇
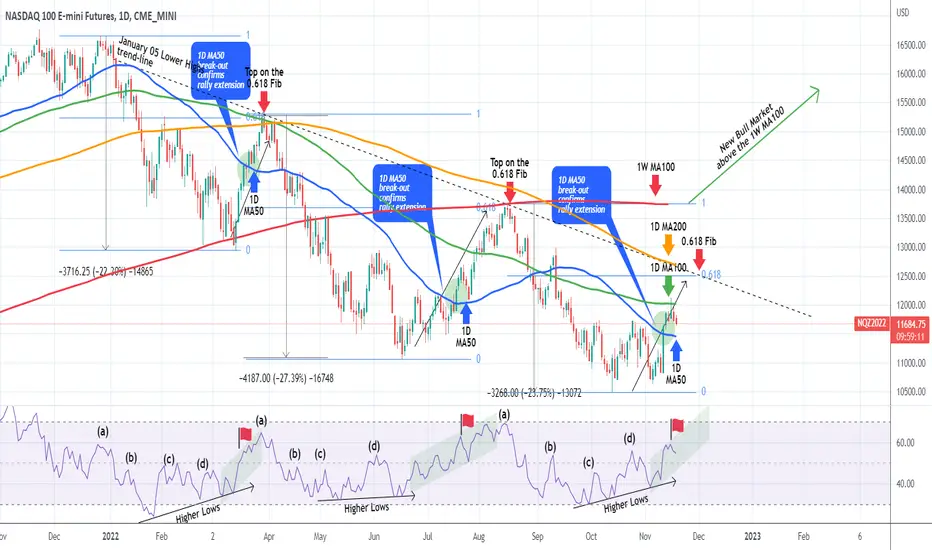
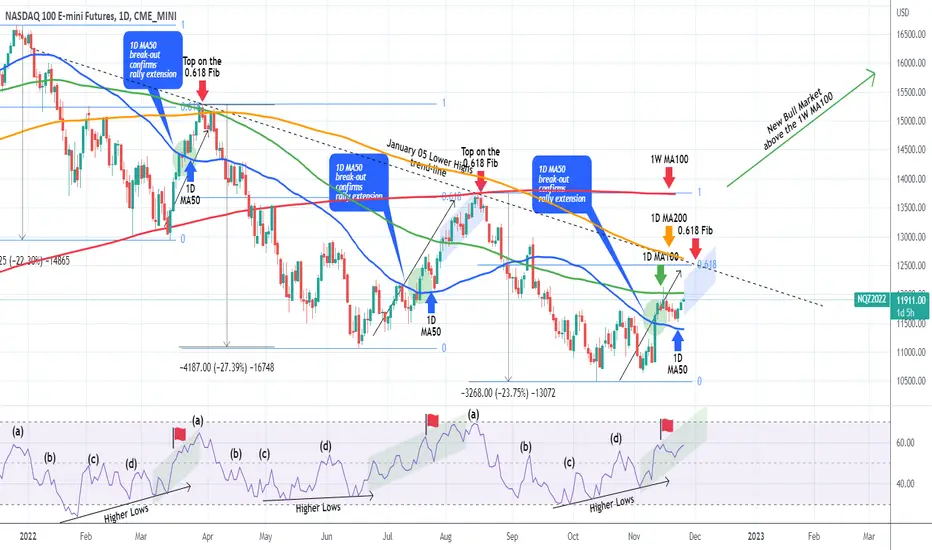
NASDAQ Broke the 1D MA50, targeting 12500.The Nasdaq index (NDX) is making its reversal as following the much lower than expected U.S. CPI report (fell to 7.7% from 8.2% the previous month), it posted the strongest 1 day rise of the year and broke above its 1D MA50 (blue trend-line) for the first time since September 13 (two months). The news that the Fed's approach has started to decrease inflation and the hopes that gives that they may consider easing their rate hike strategy, are fundamentally very bullish for the highly hurt tech sector.
Technically, this 1D MA50 break-out as well as the 1D RSI sequence, is consistent so far with the previous two counter trend rallies in 2022 (March 15 - 29 and June 16 - August 16). Both extended their rallies after breaking their 1D MA50 and topped on the 0.618 Fibonacci retracement level, forming the (dashed) Lower Highs trend-line. The current 0.618 Fib is exactly on the 12500 level.
If that is hit within 7 days, it will make contact with the Lower Highs trend-line as well as the 1D MA200 (orange trend-line), which is intact since April 06. Technically the Resistance level to beat in order to enter a new Bull Cycle is the 1W MA100 (red trend-line), which rejected the August 16 top and has been holding since April 28, being previously the Support of the Bull Run.
-------------------------------------------------------------------------------
** Please LIKE 👍, SUBSCRIBE ✅, SHARE 🙌 and COMMENT ✍ if you enjoy this idea! Also share your ideas and charts in the comments section below! This is best way to keep it relevant, support me, keep the content here free and allow the idea to reach as many people as possible. **
-------------------------------------------------------------------------------
You may also TELL ME 🙋♀️🙋♂️ in the comments section which symbol you want me to analyze next and on which time-frame. The one with the most posts will be published tomorrow! 👏🎁
-------------------------------------------------------------------------------
👇 👇 👇 👇 👇 👇
💸💸💸💸💸💸
👇 👇 👇 👇 👇 👇

NAS100USD LongThe price has been forming a falling channel for the past few weeks.
I anticipate that the price might continue with the bullish run, touching the upper trend line of the channel.
My position will be at 11040, as I am using the pullback strategy to enter my positions hence it will be above the highest high formed.
My targets are 11180, 11320 and 11460 thus my target R:R is 1: 3.
Remember, risk only 1-2% of your account!

IXIC (NDX) Logarithmic Long Term Trend Line A long term trend line has been touched on the Nasdaq Composite
This has been seen as a point of great support extending all the way back to the 1980's
Price will likely bounce off this line and continue upwards
This is an addition to chart below, providing support

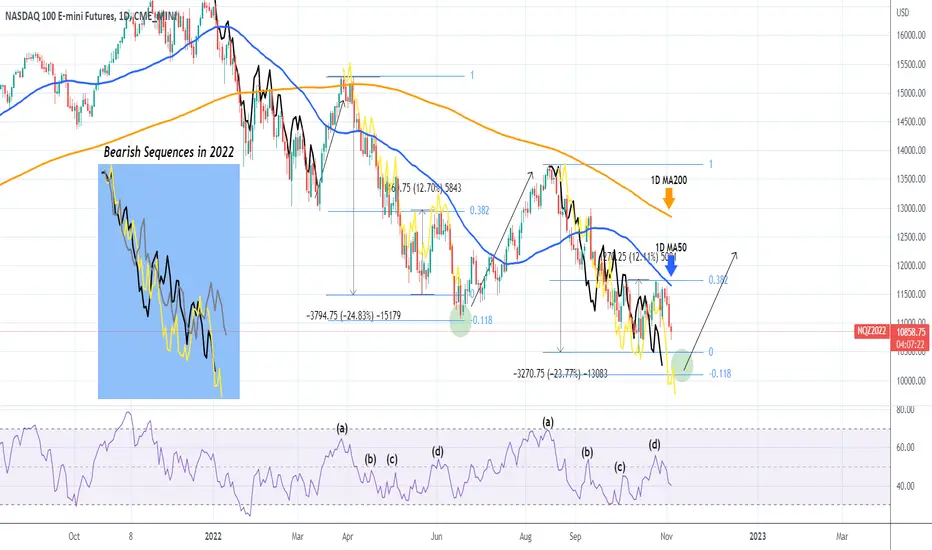
NASDAQ One last Low left on perfect symmetryNasdaq (NDX) is pulling-back following the Fed's +0.75% Rate Hike and a rejection on Tuesday on the 1D MA50 (blue trend-line). With the help of the RSI on the 1D time-frame, we can see that so far the whole bearish sequence since the August 16 High, is very similar to the bearish sequence that followed after the March 30 High.
A striking similarity is that both got rejected on the 0.382 Fibonacci retracement level just under the 1D MA50. On June 03 that was the rejection that delivered the last sell-off before the mid-June - mid-August rally. That sell-off made its Low on the -0.118 Fibonacci extension. On the current Bearish Sequence, this extension is on 10105.
For illustration and better comparison purposes, I have plotted the first two Bearish Sequences od 2022 on top of the current (post August 16 High) and on the blue table all three together. The pattern is obvious.
-------------------------------------------------------------------------------
** Please LIKE 👍, SUBSCRIBE ✅, SHARE 🙌 and COMMENT ✍ if you enjoy this idea! Also share your ideas and charts in the comments section below! This is best way to keep it relevant, support me, keep the content here free and allow the idea to reach as many people as possible. **
-------------------------------------------------------------------------------
You may also TELL ME 🙋♀️🙋♂️ in the comments section which symbol you want me to analyze next and on which time-frame. The one with the most posts will be published tomorrow! 👏🎁
-------------------------------------------------------------------------------
👇 👇 👇 👇 👇 👇
💸💸💸💸💸💸
👇 👇 👇 👇 👇 👇
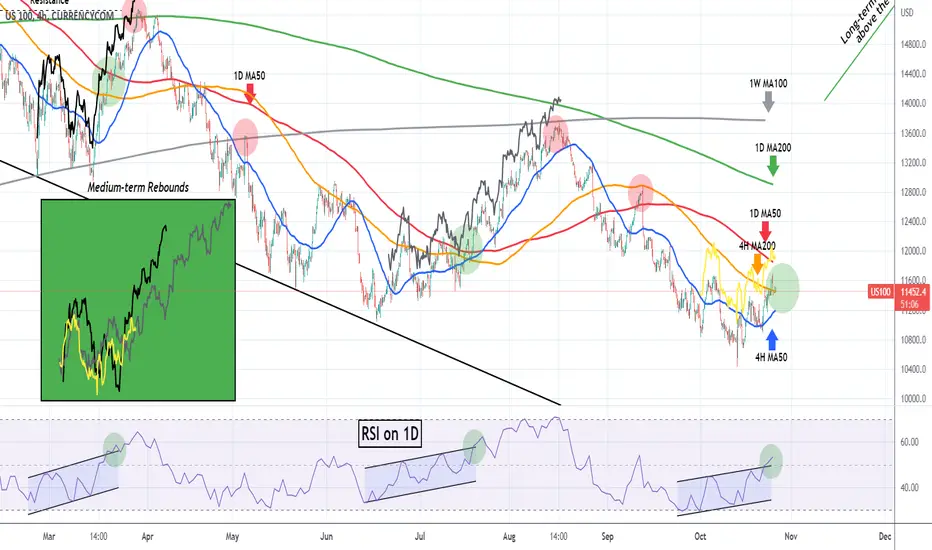
NASDAQ Bullish reversal confirmed as per previous 2022 reboundsJust a few days following our last analysis, the Nasdaq Index (NDX) broke above its 4H MA200 (orange trend-line) for the first time since August 26:
As mentioned then, the factor that made the difference in our decision to call for a buy was the RSI Bullish Divergence on the 1D time-frame which has been trading on Higher Highs/ Higher Lows (Channel Up) since October 03, while the actual price action has been on Lower Highs and Lower Lows (Channel Down).
The current rebound is consistent with the previous medium-term rebounds throughout the 2022 Bear Cycle, that started after the bottoms of February 24 and June 16. We can see the very same Channel Up on the 1D RSI during those bottoms. Both of those medium-term rebounds, broke above the 1D MA50 (red trend-line) and targeted the 1D MA200 (green trend-line), which has marginally hit on the March 29/30 High and approached on the August 16 High. Interestingly enough, the RSI Channel Up patterns broke to the upside around the time the price broke above the 4H MA200.
With the 4H MA200 broken, our short-term target is now the 1D MA50 and the medium-term 300 points below the 1D MA200. The projection from where we stand today, puts the 1D MA200 just above 12500 by mid November.
For comparison purposes in order to get a better understanding of Nasdaq's proportionate position compared to the previous rebounds, we've plotted all rebound sequences on top of another (Black line = Feb 24 - March 30, Grey line = June 21 - August 16 and Yellow line = October 02 - today). It is obvious how closely correlated all three sequences are.
-------------------------------------------------------------------------------
** Please LIKE 👍, SUBSCRIBE ✅, SHARE 🙌 and COMMENT ✍ if you enjoy this idea! Also share your ideas and charts in the comments section below! This is best way to keep it relevant, support me, keep the content here free and allow the idea to reach as many people as possible. **
-------------------------------------------------------------------------------
You may also TELL ME 🙋♀️🙋♂️ in the comments section which symbol you want me to analyze next and on which time-frame. The one with the most posts will be published tomorrow! 👏🎁
-------------------------------------------------------------------------------
👇 👇 👇 👇 👇 👇
💸💸💸💸💸💸
👇 👇 👇 👇 👇 👇