Nasdaq Week 33 Possible OutlookAre we ready to drop this coming week? Lookout for reversal/continuation pattern under smaller TF.
Nasdaqstrategy

Nasdaq 100: Institutional Move Toward 22,680 Unfolding📊 Nasdaq 100 Smart Money Breakdown
Current Price: 22,103
Target Price: 22,680
🔼 Upside Potential: +577 points
The market is currently positioned for a premium retracement move after a recent liquidity sweep below short-term equal lows, which likely triggered sell-side liquidity. This setup hints at Smart Money Accumulation, with institutions entering long positions at discount pricing.
We're now seeing:
✅ Break of Structure (BOS) to the Downside
✅ Internal liquidity sweep
✅ Price reacting from a discounted OB (Order Block)
✅ Potential drive toward the next liquidity pool sitting above the 22,680 level.
This move aligns with a bullish market structure shift, suggesting Smart Money is engineering price higher to target buy-side liquidity above recent highs.
🎯 Target: 22,680 – a key liquidity area where Smart Money may look to offload positions.

NAS - LET'S MAKE MILLIONS Team, last night NAS I was expect the FALL BACK as I predicted rate un-change will get NASTY on both DOW AND NAS.
So I have a set up entry LONG, i didnt expect the NAS flying to the moon.
both target hit so fast in 15 minutes
However, today is another opportunity to SHORT NAS on the current market at 23613-23625
STOP LOSS AT 23720
Once the NAS pull back toward 23580-65 - BRING STOP LOSS TO BE
TARGET 1: at 23540-20
TARGET 2: at 23480-65
LETS GO

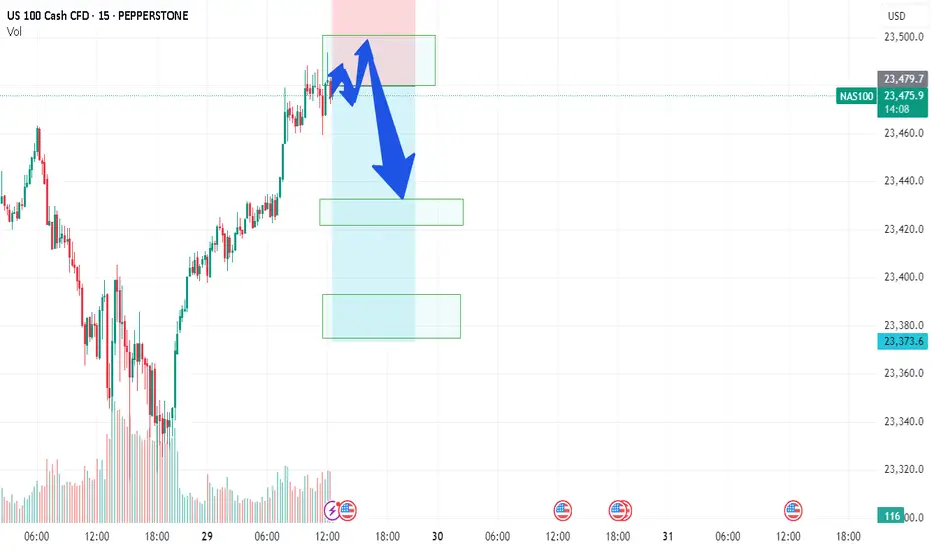
NAS/TEC100 - LETS GET NASTY ON NAS100Team, NAS currently sitting at 23480, before the US market open
however during the market open, please be aware of the volatility that may hit your stop loss
You have 2 options to trade on this NAS- NASTY
Option 1: wait for market open, if it hits 23500-23515 - then short with stop loss at 23580
Option 2: Short at the current market with small volume - and if the market open with volatile, you can take another advantage of shorting more volume as per option 1 instructed.
OK, pick your strategy! do NOT be shy.
I am going to have small short position and will consider adding more during US market opening after 5-10 minutes, much easier to see the direction of the market - we do LIVE trading everyday. Please note: if NAS fall below 23450-40 bring stop loss to BE (Break even)
1st TARGET range: 23435-23416 - make sure take 70% volume
2nd target at 23390 to 23376
Why do I short on NAS when tomorrow rate decision, i think this quarter report, market will not be the same as last quarter, even rate cut!
US100 Strong Bullish Breakout!
HI,Traders !
#US100 is trading in a
Strong uptrend and the
made a bullish breakout
Of the key horizontal level
Of 22879.1 so we are
Bullish biased and we will
Be expecting a further
Bullish move up !
Comment and subscribe to help us grow !

US100 Short From Resistance!
HI,Traders !
US100 is weaker than we
Expected and failed to break
The key horizontal level
Around 22868.6 and we are
Now seeing a bearish rejection
So we are locally bearish biased
And we will be expecting a
Further bearish move down !
Comment and subscribe to help us grow !

NAS100 Bullish Breakout SetupNAS100 Bullish Breakout Setup 🚀
🧠 Chart Analysis (H4 timeframe)
🔹 Ascending Channel:
Price has been trending inside a clear ascending channel (blue zone), supported by higher highs and higher lows.
🔹 Support & Resistance:
Support: Around 21,635.32 – tested multiple times (highlighted by 🔵 arrows).
Resistance: Around 22,265.19 – recent highs and psychological barrier.
🔹 Double Bottom Formation 👣:
Near support zone, a potential double bottom (bullish reversal pattern) is visible. The neckline has been challenged.
🔹 Breakout Confirmation 🟢:
Price has broken above the descending neckline of the double bottom and is hovering near 21,644, indicating potential bullish continuation if sustained.
🔹 Target 🎯:
Projected breakout target lies at 22,265.19, aligning with the previous resistance zone.
🔹 Volume & Momentum 📊:
While not shown, a breakout above the neckline generally needs strong volume confirmation to validate the move.
📌 Conclusion:
If price sustains above the 21,635 – 21,644 area and gains momentum, the path to 22,265 looks likely ✅. However, a false breakout could drag the price back into the channel.

NAS - ACTIVE TRADE COMMUNITY - PLEASE BRING TO THE MOONTeam, we have successfully trade both LIVE trading on UK100 short yesterday and LONG both NAS AND DOWN yesterday.
Today we are entry small portion LONG for NAS.
WILL DOUBLE LONG if market drop low at 21650-21600
Target 1 - at 21850-21875
TAKE 50-70% volume on profit and bring stop loss to BE once target 1 hit
Target 2 remaining at 21900-21950
GOOD LUCK AND LET KILL THE BEAST TOGETHER

NAS - TIME TO MAKE ACTIVE TRADER ROOM GREATER AGAIN!Team, last week we got a good entry on both DOW/US30 AND NAS100/TEC100
Yes, i do know about the situation with ISRAEL AND IRAN.
This will drag on for at least 3-6 months for the solutions
however, I expect the cease fire should be stop within next week as President Trump's is negotiation with Iran
There are two strategy to trade for the NAS- NASTY market
Rule: make sure you calculate how much position and volume you are taking risk on the trade. Every time you enter, ensure you are understood each trade risk.
As I always do.
The last 90 days we have not losing a single trade - check my new video release soon.
OK, lets get back to the trade set up again
entry small volume at market now.
If market falling down during US session, buy more at the second setting
However, I expect the 1st setting likely to recover soon.
Jump on board now.
See you to the moon

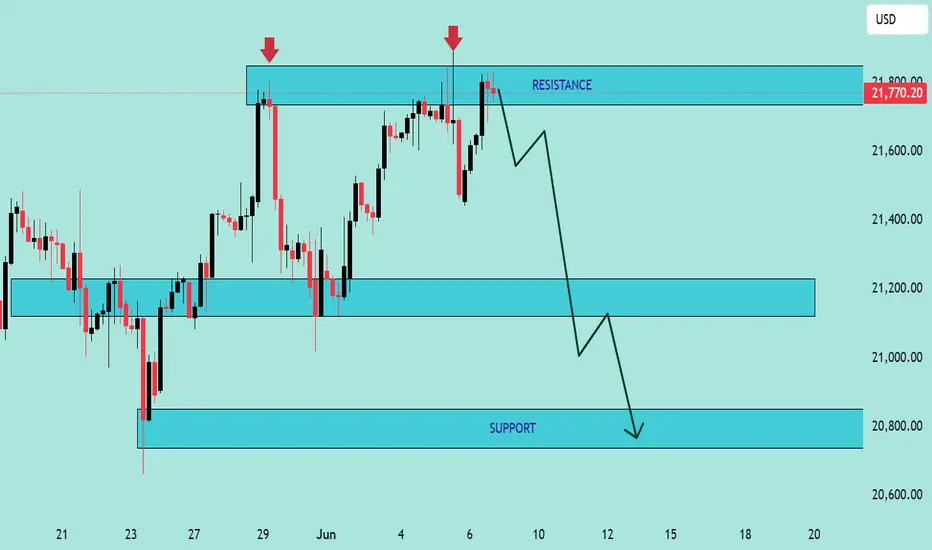
NAS100 Technical Analysis – Bearish Rejection at ResistanceNAS100 Technical Analysis – Bearish Rejection at Resistance 🚨
📅 Date: June 6, 2025
📈 Instrument: NAS100 (US Tech 100 Index)
🔍 Chart Overview:
The price action shows a clear rejection from the 21,800 USD resistance zone, marked by two strong bearish wicks (indicated by red arrows 🔴). This level has proven to be a strong supply zone, as sellers repeatedly step in to push prices lower.
🔵 Key Zones:
🔺 Resistance Zone: 21,750 – 21,800 USD
✅ Multiple rejections and bearish pressure.
🔻 Support Zone 1: 21,100 – 21,200 USD
📍 Acts as a mid-range demand zone and a potential take-profit level for short positions.
📉 Support Zone 2 (Major): 20,700 – 20,850 USD
📦 High-probability bounce area due to historical demand.
🔄 Price Action Insight:
The chart outlines a bearish double rejection pattern at the resistance level.
The current candlestick setup suggests bearish momentum, with a potential drop toward the mid-support zone.
If the price breaks below the mid-support, it could cascade down toward the major support near 20,800 USD.
📌 Projected Move:
🔻 From current levels (~21,750), expect:
Pullback from resistance,
Target 1️⃣: 21,100 USD zone,
Target 2️⃣: 20,800 USD major support.
🚫 A clean break and close above 21,800 invalidates the bearish outlook and may trigger a bullish continuation.
✅ Conclusion:
The chart favors a short bias below the resistance zone. Patience is key—wait for confirmation (like a bearish engulfing or break of structure 📉) before entering positions.
📊 Always use risk management. Set stop-loss above resistance in case of reversal.
NASDAQ100 Analysis – Key S/R Zones & Price Reaction Incoming! NASDAQ100 Analysis – Key S/R Zones & Price Reaction Incoming! 🚨
🔍 Chart Breakdown:
This is a technical chart analysis of NASDAQ100 (NAS100) with defined Support and Resistance zones. The price is currently at 21,314.50, sitting below a critical decision area.
🧱 Key Zones:
🔵 Resistance Zone:
‣ 21,640 – 21,800
‣ Strong supply area where price sharply reversed previously.
‣ If price breaks above the mid resistance zone, a bullish move towards this level is likely.
🟩 Support + Resistance Flip Zone:
‣ 21,280 – 21,420
‣ Former support, now acting as resistance.
‣ Price is struggling to reclaim this zone.
‣ Acts as a key decision level.
🟢 Support Zone:
‣ 20,630 – 20,750
‣ Strong demand zone from which previous rallies initiated.
‣ Target if bearish rejection continues.
🔄 Price Action Insight:
Price is currently rejecting the Support-turned-Resistance zone.
There’s a clear bearish rejection at the mid-zone (S/R flip), forming a lower high structure.
📉 A breakdown from current levels could lead to a retest of the support zone at 20,700 area.
🟢 However, a successful reclaim and bullish confirmation above 21,420 could see price target the upper resistance at 21,800.
📌 Outlook:
🔽 Bearish Bias if price fails to break above 21,420 – possible drop to 20,700.
🔼 Bullish Reversal above 21,420 could drive price to 21,800.
📅 Date: June 1, 2025
🕒 Timeframe: Likely 1H or 4H chart
💬 “Respect the levels, not the noise.”
Trade safe! ✅

NAS100-TEC100 - THE SECRETE OF TRADING INDICES STRATEGYTeam,
yesterday we short the NAS, DOW, DAX and long the GOLD - 4 out of 4 perfectly target hit
Now, we are going long, i want you to carefully look at the picture and understand the concept of how I structure the trade. This has been calculate using my statistic and probability to ensure our entry is safe.
First picture, is buying small volume, if market volatile and push further down, i need you to double up your trade, this allow us to win better.
That's the reason why you saw my videos that everyday i show LIVE trading and profitable every trade. However, always carefully look at your capital and know exactly how much risk are you going to take.
Remember, you can win straight 3-6 months and if you failed risk management and overleverage yourself, the account can easily be kill within 1 day.
Hope you all have a great day.!

#NQ1! "E-Mini Nasdaq 100" Index Market Bullish Robbery Plan 🌟Hi! Hola! Ola! Bonjour! Hallo! Marhaba!🌟
Dear Money Makers & Robbers, 🤑 💰💸✈️
Based on 🔥Thief Trading style technical and fundamental analysis🔥, here is our master plan to heist the NQ1! "E-Mini Nasdaq 100" Index Market Heist. Please adhere to the strategy I've outlined in the chart, which emphasizes long entry. Our aim is to escape near the high-risk YELLOW MA Zone. It's a Risky level, overbought market, consolidation, trend reversal, trap at the level where traders and bearish robbers are stronger. 🏆💸"Take profit and treat yourself, traders. You deserve it!💪🏆🎉
Entry 📈 : "The heist is on! Wait for the Crossing previous high (19800) then make your move - Bullish profits await!"
however I advise to Place Buy stop orders above the Moving average (or) Place buy limit orders within a 15 or 30 minute timeframe most recent or swing, low or high level for Pullback entries.
📌I strongly advise you to set an "alert (Alarm)" on your chart so you can see when the breakout entry occurs.
Stop Loss 🛑: "🔊 Yo, listen up! 🗣️ If you're lookin' to get in on a buy stop order, don't even think about settin' that stop loss till after the breakout 🚀. You feel me? Now, if you're smart, you'll place that stop loss where I told you to 📍, but if you're a rebel, you can put it wherever you like 🤪 - just don't say I didn't warn you ⚠️. You're playin' with fire 🔥, and it's your risk, not mine 👊."
📍 Thief SL placed at the nearest/swing low level Using the 2H timeframe (19200) Day trade basis.
📍 SL is based on your risk of the trade, lot size and how many multiple orders you have to take.
🏴☠️Target 🎯: 20500
🧲Scalpers, take note 👀 : only scalp on the Long side. If you have a lot of money, you can go straight away; if not, you can join swing traders and carry out the robbery plan. Use trailing SL to safeguard your money 💰.
💰💵💸NQ1! "E-Mini Nasdaq 100" Index Money Heist Plan is currently experiencing a bullishness,., driven by several key factors. .☝☝☝
📰🗞️Get & Read the Fundamental, Macro Economics, COT Report, Geopolitical and News Analysis, Sentimental Outlook, Intermarket Analysis, Index-Specific Analysis, Future trend targets with Overall outlook score... go ahead to check 👉👉👉🔗🔗🌎🌏🗺
⚠️Trading Alert : News Releases and Position Management 📰🗞️🚫🚏
As a reminder, news releases can have a significant impact on market prices and volatility. To minimize potential losses and protect your running positions,
we recommend the following:
Avoid taking new trades during news releases
Use trailing stop-loss orders to protect your running positions and lock in profits
💖Supporting our robbery plan 💥Hit the Boost Button💥 will enable us to effortlessly make and steal money 💰💵. Boost the strength of our robbery team. Every day in this market make money with ease by using the Thief Trading Style.🏆💪🤝❤️🎉🚀
I'll see you soon with another heist plan, so stay tuned 🤑🐱👤🤗🤩

(NQ) | Strong Buyers and Blue‑Box Entry Zones(NQ) | Strong Buyers and Blue‑Box Entry Zones
NQ shows powerful buying pressure, and the marked blue boxes highlight areas where demand has reliably appeared. For those seeking long exposure, two approaches stand out:
Low‑Time‑Frame Breakouts from the Blue Box
Wait for price to dip into a blue‑boxed support zone and then break higher on shorter time frames. A decisive move with rising footprint volume confirms genuine buyer commitment.
Direct Low‑Time‑Frame Breakouts
If price skips a pullback and powers upward on low‑time‑frame charts, that momentum surge—backed by substantial volume—also provides a valid long entry.
Key Considerations
Ensure any breakout is backed by real volume footprint signals, not just price movement.
If these zones fail to hold or volume dries up, stand aside and await the next confirmed setup.
By focusing on these blue‑boxed areas and insisting on volume‑confirmed breakouts, you align your entries with where buyers truly dominate.
📌I keep my charts clean and simple because I believe clarity leads to better decisions.
📌My approach is built on years of experience and a solid track record. I don’t claim to know it all but I’m confident in my ability to spot high-probability setups.
📌If you would like to learn how to use the heatmap, cumulative volume delta and volume footprint techniques that I use below to determine very accurate demand regions, you can send me a private message. I help anyone who wants it completely free of charge.
🔑I have a long list of my proven technique below:
🎯 ZENUSDT.P: Patience & Profitability | %230 Reaction from the Sniper Entry
🐶 DOGEUSDT.P: Next Move
🎨 RENDERUSDT.P: Opportunity of the Month
💎 ETHUSDT.P: Where to Retrace
🟢 BNBUSDT.P: Potential Surge
📊 BTC Dominance: Reaction Zone
🌊 WAVESUSDT.P: Demand Zone Potential
🟣 UNIUSDT.P: Long-Term Trade
🔵 XRPUSDT.P: Entry Zones
🔗 LINKUSDT.P: Follow The River
📈 BTCUSDT.P: Two Key Demand Zones
🟩 POLUSDT: Bullish Momentum
🌟 PENDLEUSDT.P: Where Opportunity Meets Precision
🔥 BTCUSDT.P: Liquidation of Highly Leveraged Longs
🌊 SOLUSDT.P: SOL's Dip - Your Opportunity
🐸 1000PEPEUSDT.P: Prime Bounce Zone Unlocked
🚀 ETHUSDT.P: Set to Explode - Don't Miss This Game Changer
🤖 IQUSDT: Smart Plan
⚡️ PONDUSDT: A Trade Not Taken Is Better Than a Losing One
💼 STMXUSDT: 2 Buying Areas
🐢 TURBOUSDT: Buy Zones and Buyer Presence
🌍 ICPUSDT.P: Massive Upside Potential | Check the Trade Update For Seeing Results
🟠 IDEXUSDT: Spot Buy Area | %26 Profit if You Trade with MSB
📌 USUALUSDT: Buyers Are Active + %70 Profit in Total
🌟 FORTHUSDT: Sniper Entry +%26 Reaction
🐳 QKCUSDT: Sniper Entry +%57 Reaction
📊 BTC.D: Retest of Key Area Highly Likely
📊 XNOUSDT %80 Reaction with a Simple Blue Box!
📊 BELUSDT Amazing %120 Reaction!
📊 Simple Red Box, Extraordinary Results
I stopped adding to the list because it's kinda tiring to add 5-10 charts in every move but you can check my profile and see that it goes on..

Nasdaq market analysis: 23-APRIL-2025Good morning Dear Traders! Join me for Nasdaq market analysis for today. Share your charts, ask questions, and let's discuss trading strategies.

How I Traded A FULL Multi-Timeframe Wave - AND got PAIDThis week, I tracked NASDAQ from a technical + psychological level most traders avoided… but I saw the opportunity 🔎
While others sat on the sidelines calling it “too choppy,” I:
✅ Identified Wave 5 structure on the 4H + 1H timeframes
✅ Mapped out entries using price action + liquidity zones
✅ Held through 6+ rejections at resistance
✅ Executed with discipline, not emotion
✅ Took partial profits, protected capital
✅ Watched price explode — and I got my 💸
✅ Then wrapped the week with a real withdrawal
📚 KEY LESSONS I’M DROPPING FOR YOU:
📊 Technical Analysis = The "What"
→ Chart patterns, structure, liquidity zones, entries/exits.
🌍 Fundamental Analysis = The "Why"
→ News, interest rates, sentiment.
I stayed focused on the “what” — not the fear headlines.
💡 Liquidity Isn’t Noise. It’s a Signal.
Every rejection I held through was just price loading up.
I didn’t flinch. I let smart money do the work.
💥 Wave 5s test your strategy AND your patience.
I saw smaller TF Wave 5 complete before 4H — so I waited.
I didn’t FOMO back in — I planned for the pullback and possible short flip.
🧠 MINDSET WINS > CHART WINS
🧘🏽♀️ My biggest move this week?
I walked away with clarity — not just profit.
That’s trader growth.
💬 Final thoughts:
You don’t need 100 trades. You need 1 well-managed setup and a calm mind.
📲 Follow me to keep learning how to trade structure, not stress.

"NAS100/US100" Index Market Money Heist Plan (Day / Scalping)🌟Hi! Hola! Ola! Bonjour! Hallo! Marhaba!🌟
Dear Money Makers & Robbers, 🤑💰✈️
Based on 🔥Thief Trading style technical and fundamental analysis🔥, here is our master plan to heist the "NAS100/US100" Index CFD Market. Please adhere to the strategy I've outlined in the chart, which emphasizes short entry. Our aim is the high-risk Green MA Zone. Risky level, oversold market, consolidation, trend reversal, trap at the level where traders and bullish robbers are stronger. 🏆💸"Take profit and treat yourself, traders. You deserve it!💪🏆🎉
Entry 📈 : "The heist is on! Wait for the MA breakout then make your move at (16400) - Bearish profits await!"
however I advise to Place sell stop orders above the Moving average (or) after the Support level Place sell limit orders within a 15 or 30 minute timeframe most NEAREST (or) SWING low or high level.
📌I strongly advise you to set an "alert (Alarm)" on your chart so you can see when the breakout entry occurs.
Stop Loss 🛑: "🔊 Yo, listen up! 🗣️ If you're lookin' to get in on a sell stop order, don't even think about settin' that stop loss till after the breakout 🚀. You feel me? Now, if you're smart, you'll place that stop loss where I told you to 📍, but if you're a rebel, you can put it wherever you like 🤪 - just don't say I didn't warn you ⚠️. You're playin' with fire 🔥, and it's your risk, not mine 👊."
📌Thief SL placed at the nearest/swing High or Low level Using the 4H timeframe (17300) Day/Scalping trade basis.
📌SL is based on your risk of the trade, lot size and how many multiple orders you have to take.
Target 🎯: 15300 (or) Escape Before the Target
"NAS100/US100" Index CFD Market Heist Plan (Scalping / Day Trade) is currently experiencing a Bearish trend.., driven by several key factors.👇👇👇
📰🗞️Get & Read the Fundamental, Macro, COT Report, Geopolitical and News Analysis, Sentimental Outlook, Intermarket Analysis, Index-Specific Analysis, Positioning and future trend targets... go ahead to check 👉👉👉🔗🔗
Detailed Explanation 📝
Fundamentals: Growth stalls 📉, valuations adjust—bearish shift 🐻.
Macro: Cooling economy 🌍, sticky inflation 🔥—downward pressure.
COT: Speculators flee 📉, hedgers dig in—bearish signal 🐻.
Index: Correction deepens 📉, support tests near—technical bear 🐻.
Intermarket: Yields/USD crush risk assets 💪—bearish tide.
Geopolitical: Trade wars ⚔️, regulation 🔍—negative catalysts pile up.
Sentiment: Fear takes hold 😟—bearish consensus builds.
Trends: Near/medium-term declines 📉, long-term hinges on recovery ⚖️.
Outlook: Moderately bearish 🌩️—tough sledding ahead.
⚠️Trading Alert : News Releases and Position Management 📰 🗞️ 🚫🚏
As a reminder, news releases can have a significant impact on market prices and volatility. To minimize potential losses and protect your running positions,
we recommend the following:
Avoid taking new trades during news releases
Use trailing stop-loss orders to protect your running positions and lock in profits
💖Supporting our robbery plan 💥Hit the Boost Button💥 will enable us to effortlessly make and steal money 💰💵. Boost the strength of our robbery team. Every day in this market make money with ease by using the Thief Trading Style.🏆💪🤝❤️🎉🚀
I'll see you soon with another heist plan, so stay tuned 🤑🐱👤🤗🤩

NAS100 Testing Demand Zone – Major Reversal or More Drops? 📊 Market Overview:
The NASDAQ 100 (NAS100) just tested a strong demand zone (18,900 - 18,950) and is showing signs of a potential reversal. Can buyers push the price higher, or will bears take control?
🔹 Key Resistance Levels: 19,568 | 20,160
🔹 Current Price: 18,977
🔹 Key Support Levels: 18,896 (demand zone)
📉 Price Action Breakdown:
1️⃣ Sharp Drop into Demand Zone
Price recently fell from 19,568 after failing to break higher.
Buyers are now defending the 18,900 support zone, which has historically held strong.
2️⃣ Bullish Reversal Setup?
If the price holds above 18,900, we could see a bullish rally toward 19,568.
A breakout above 19,568 may open the way for 20,160+.
3️⃣ Bearish Breakdown Risk
If the price drops below 18,896, expect further downside towards 18,600 - 18,500.
Sellers would regain control, confirming a bearish continuation.
📊 Trading Plan:
📍 Bullish Case:
🔹 Look for bullish confirmation in the 18,900 - 18,950 zone.
🔹 A strong bounce could target 19,568, then 20,160.
📍 Bearish Case:
🔹 If price fails to hold 18,896, a short setup targeting 18,600 - 18,500 is possible.
🔹 Wait for a clean break & retest before shorting.
🔥 Will NAS100 bounce back from this demand zone, or will sellers dominate? Drop your thoughts in the comments! 👇
📊 Like & Follow for more trade insights! 🚀
#NASDAQ100 #TechStocks #Trading #StockMarket #SupplyAndDemand #Forex #PriceAction

Nasdaq market analysis: 01-APRIL-2025Good morning! Happy New Day! Here's your daily Nasdaq market analysis. Learn, grow, and trade wisely.

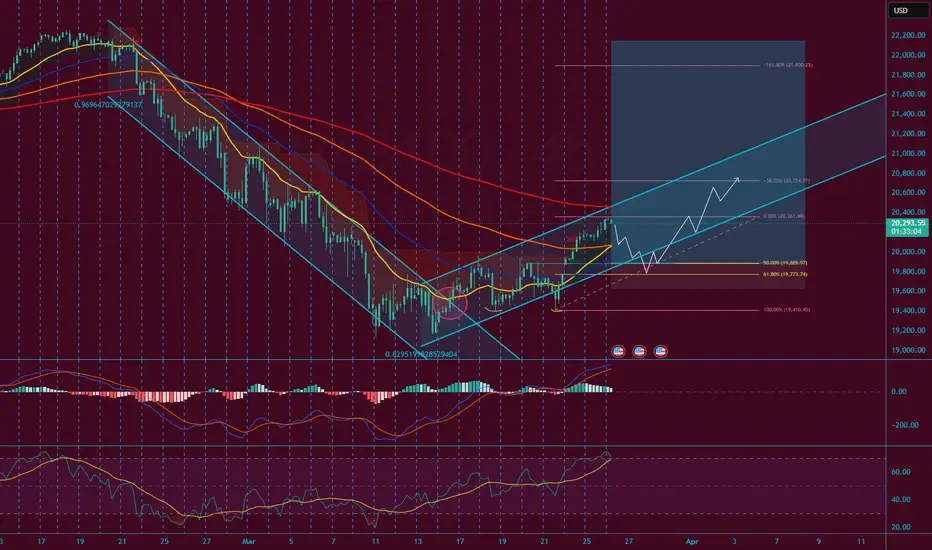
My NQ Long Idea 26/03/2025There is a big technical area that has taken the spotlight in NQ and it is around the 50% fib level with a gap opening.
US economy has seen some strengthening recently with the FED looking neutral-dovish. A price correction may not even occur here it can keep going up continuously the moment we have a conclusive risk-on environment.
Inflation has cooled down from 3.0 to 2.8 and interest rate was held at 4.50 from 4.50.
We are expecting a rate cut of 0.25 bps by Q2 so the market is looking forward to price that in.
I see a potential "buy the rumor" then "sell the news" scenario here. So during the next fomc meeting we may get a small sell off for a price correction then NQ will continue its up momentum.
Technical setup looks good I expect a turbulent price action which will fill the opening gap at the 50% a consolidation here can be healthy for price action before we get a Wyckoff spring.
We have recently exited a bearish channel and entered a new bullish channel which is still in progress but must pay attention to it as we could start trending in that direction.
I may take a short position (for the short term) since I anticipate a correction to the gap at the 50%.
Nasdaq analysis: 21-MAR-2025Good morning, traders! Today's Nasdaq analysis will help you achieve your trading goals. Let's work together towards success.

NASDAQ100Hello friends
Our ascending channel had a strong break and considering the negative news, how far do you think the decline will continue?
The support levels identified can help you trade, but we need to see where the price will go with the news that will be announced this week...
*Trade safely with us*

Nasdaq analysis: 06-MAR-2025Good morning, everyone! Today's Nasdaq analysis is designed to educate and empower. Use these insights to refine your price action trading strategy.
