NASDAQ: Almost overbought but with no stop on this uptrend.Nasdaq is about to turn overbought on its 1D technical outlook (RSI = 68.420, MACD = 402.410, ADX = 22.800) but the current bullish wave shows no signs of stopping yet. The Channel Up since the April bottom indicates that a +9.50% rise is very likely before the next technical pullback, especially as long as the 1D MA50 is holding. Stay long, TP = 23,400.
## If you like our free content follow our profile to get more daily ideas. ##
## Comments and likes are greatly appreciated. ##
Nasdaqtrading

NASDAQ: Short-lived pullback ahead of major breakout.Nasdaq has entered strong bullish territory on its 1D technical outlook (RSI = 66.290, MACD = 331.080, ADX = 18.600). Despite that, it remains inside a slow moving Channel Up for the past month in contrast to the more aggressive bullish waves of the Channel Up in April and May. The 4H RSI peak may be similar to May 12th and April 24th. We believe that at least a +9.69% rally will emerge to approach the top of this 3 month Channel Up. Stay bullish, TP = 23,400.
## If you like our free content follow our profile to get more daily ideas. ##
## Comments and likes are greatly appreciated. ##

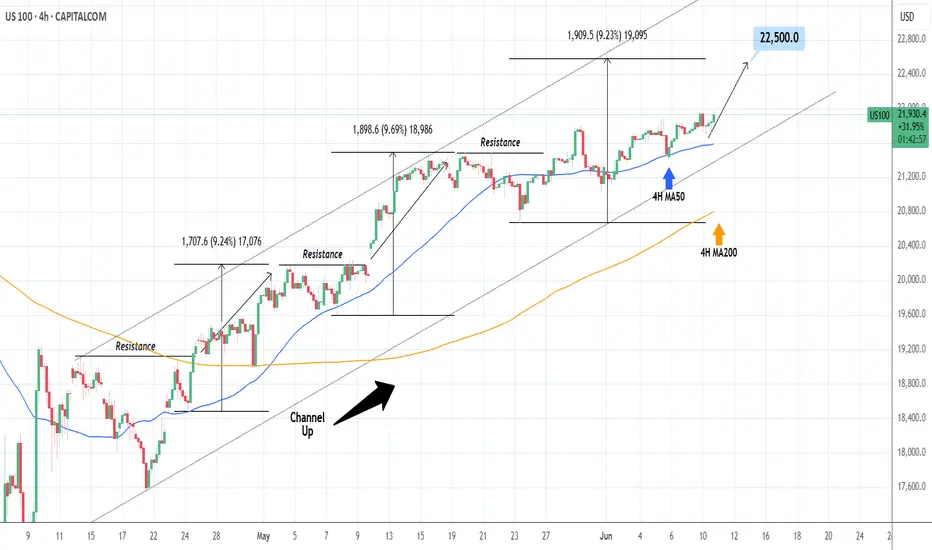
NASDAQ: Close to a strong bounce.Nasdaq is about to turn overbought on its 1D technical outlook (RSI = 68.736, MACD = 505.460, ADX = 18.046) as it is extending an uptrend since the 4H MA50 test/bounce. Such low paced price increase typically precedes strong breakouts. Since the long term pattern is a Channel Up, we are still on its 3rd bullish wave overall. The prior ones were +9.50% on avg, so we remain bullish on the short term, TP = 22,500.
## If you like our free content follow our profile to get more daily ideas. ##
## Comments and likes are greatly appreciated. ##
NASDAQ: Initiated bullish wave to 22,150.Nasdaq remains heavily bullish on its 1D technical outlook (RSI = 67.266, MACD = 427.500, ADX = 25.384) and just formed a 4H MACD Bullish Cross. This validates the extension of the current Bullish Wave, second inside the short term Channel Up. We anticipate again a +5.40% rise, TP = 22,150.
## If you like our free content follow our profile to get more daily ideas. ##
## Comments and likes are greatly appreciated. ##

NASDAQ Outlook: Waiting for a Catalyst in a Range-Bound Market!The NASDAQ NAS100 has shown impressive gains recently 📈, but overall sentiment remains cautious 😐 as the market consolidates and trades sideways in the short term 🔄. Investors seem to be waiting for a new catalyst—such as major economic data or policy announcements 📰—before committing to a clear direction.
Ongoing political and economic uncertainties, including trade negotiations 🤝, interest rate outlooks 💸, and valuation concerns 💰, are keeping market participants on edge. Given these factors, the near-term environment is likely to remain choppy and range-bound 🌊. As traders, it’s important to approach the markets with caution ⚠️, especially as equities approach key resistance areas 🚧. This uncertainty may also impact currency and other financial markets 💱. While tech stocks could eventually break out of the current range 💻, the direction is still unclear. Prioritize risk management and protect your capital during this period of heightened uncertainty 🛡️.
Political and economic uncertainties—like ongoing trade negotiations, interest rate expectations, and concerns about valuations—are keeping investors on edge.
The near-term outlook for the US100 is for choppy, range-bound trading as the market works through these uncertainties.

NASDAQ: Needs to reclaim the 4H MA50.Nasdaq is bullish on its 1D technical outlook (RSI = 62.436, MACD = 467.180, ADX = 28.529) as it maintains its long term bullish trend through the Channel Up pattern, which recently is transitioning into a Rising Wedge. We are willing to turn bullish again upon a 4H candle closing over the 4H MA50 and aim for a +11.17% rise (TP = 23,000) on the HH trendline, like the April 21st rebound did.
## If you like our free content follow our profile to get more daily ideas. ##
## Comments and likes are greatly appreciated. ##

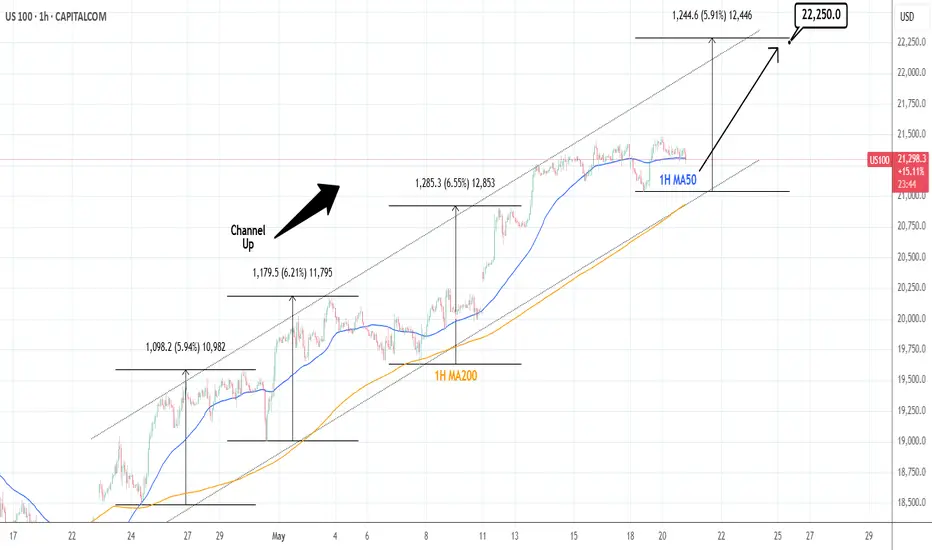
NASDAQ: Channel Up to soon initate the new bullish wave.Nasdaq is bullish on its 1D technical outlook (RSI = 67.876, MACD = 566.960, ADX = 50.516) as it is still holding the Channel Up of almost 1 month back, whose support is the 1H MA200. Right now the price is consolidating around the 1H MA50, approaching the bottom of the pattern. Once it does, we expect it to initate the new bullish wave. With the shortest one of the Channel Up being +5.90%, we remain bullish here and look towards a TP = 22,250 by early next week.
## If you like our free content follow our profile to get more daily ideas. ##
## Comments and likes are greatly appreciated. ##
NASDAQ: Rebounding on the 4H MA50. New High for the Channel Up.Nasdaq is marginally bullish on its 1D technical outlook (RSI = 56.883, MACD = 127.320, ADX = 37.197) and is rebounding today on the 4H MA50, right before the HL of the Channel Up. This is a technical bottom that calls for a buy. We aim for a new +6% bullish wave (TP = 20,800).
## If you like our free content follow our profile to get more daily ideas. ##
## Comments and likes are greatly appreciated. ##

NASDAQ: 50% probability that this Golden Cross is bearish.Nasdaq is bullish on its 1D technical outlook (RSI = 60.920, MACD = 61.810, ADX = 33.031) as it continues its recovery from the Low of the previous month. In the meantime, it formed a 4H Golden Cross, the first since January 23rd. Even though this is a bullish pattern theoretically, it often doesn't deliver an immediate rise. More specifically, since the October 2022 market bottom, Nasdaq has had another 10 Golden Crosses on the 4H timeframe. The interesting statistic is that 5 have extended their rallies but the other 5 cuased a pullback (short or medium term). Consequently we call for caution in the next 2 weeks, as the market may correct towards the 4H MA200 before it resumes the long term uptrend.
## If you like our free content follow our profile to get more daily ideas. ##
## Comments and likes are greatly appreciated. ##

NASDAQ: Rejected on the 1D MA50. Can it break it?Nasdaq is neutral on its 1D technical outlook (RSI = 52.608, MACD = -100.810, ADX = 23.609) as it got rejected today on the 1D MA50. That is the first serious Resistance test of the April 7th rebound and until it breaks, we can see a technical pullback to the 4H MA100 in order to establish the new Support. With the 1D RSI confirmed the new long term bottom with a DB, buying the dips on every such pullback is the most effective strategy on such occasions. Our short term target is the R1 level (TP = 20,300).
## If you like our free content follow our profile to get more daily ideas. ##
## Comments and likes are greatly appreciated. ##

US100 Will Grow !
HI,Traders !
US100 is trading in an
Uptrend and the price is
Now consolidating above
The horizontal support
Of 18178.2 and as we are
Bullish biased we will be
Expecting a further bullish
Move up !
Comment and subscribe to help us grow !

NASDAQ: Stop the noise. Long term investors are buying here.Nasdaq may be recovering on its 1D technical outlook but remains bearish on the 1W (RSI = 37.616, MACD = -451.790, ADX = 38.564) as the timeframe is still under the dramatic effect of the 3 month correction. The market however appears to be finding support a little over the 1W MA200 and may turn out to be the new long term technical bottom as the 1W RSI rebounded from oversold grounds.
The last three times that happened, the index rose aggressively. The 15 year pattern is a Bullish Megaphone and every rally inside it obviously gets stronger. As long as the market is holding the 1W MA200, the trend will be bullish and this is the right opportunity to buy for the long term, aiming at another +113.90% bullish wave (TP = 36,000) to get hit towards the end of 2027.
## If you like our free content follow our profile to get more daily ideas. ##
## Comments and likes are greatly appreciated. ##

"NAS100/US100" Index Market Money Heist Plan (Day / Scalping)🌟Hi! Hola! Ola! Bonjour! Hallo! Marhaba!🌟
Dear Money Makers & Robbers, 🤑💰✈️
Based on 🔥Thief Trading style technical and fundamental analysis🔥, here is our master plan to heist the "NAS100/US100" Index CFD Market. Please adhere to the strategy I've outlined in the chart, which emphasizes short entry. Our aim is the high-risk Green MA Zone. Risky level, oversold market, consolidation, trend reversal, trap at the level where traders and bullish robbers are stronger. 🏆💸"Take profit and treat yourself, traders. You deserve it!💪🏆🎉
Entry 📈 : "The heist is on! Wait for the MA breakout then make your move at (16400) - Bearish profits await!"
however I advise to Place sell stop orders above the Moving average (or) after the Support level Place sell limit orders within a 15 or 30 minute timeframe most NEAREST (or) SWING low or high level.
📌I strongly advise you to set an "alert (Alarm)" on your chart so you can see when the breakout entry occurs.
Stop Loss 🛑: "🔊 Yo, listen up! 🗣️ If you're lookin' to get in on a sell stop order, don't even think about settin' that stop loss till after the breakout 🚀. You feel me? Now, if you're smart, you'll place that stop loss where I told you to 📍, but if you're a rebel, you can put it wherever you like 🤪 - just don't say I didn't warn you ⚠️. You're playin' with fire 🔥, and it's your risk, not mine 👊."
📌Thief SL placed at the nearest/swing High or Low level Using the 4H timeframe (17300) Day/Scalping trade basis.
📌SL is based on your risk of the trade, lot size and how many multiple orders you have to take.
Target 🎯: 15300 (or) Escape Before the Target
"NAS100/US100" Index CFD Market Heist Plan (Scalping / Day Trade) is currently experiencing a Bearish trend.., driven by several key factors.👇👇👇
📰🗞️Get & Read the Fundamental, Macro, COT Report, Geopolitical and News Analysis, Sentimental Outlook, Intermarket Analysis, Index-Specific Analysis, Positioning and future trend targets... go ahead to check 👉👉👉🔗🔗
Detailed Explanation 📝
Fundamentals: Growth stalls 📉, valuations adjust—bearish shift 🐻.
Macro: Cooling economy 🌍, sticky inflation 🔥—downward pressure.
COT: Speculators flee 📉, hedgers dig in—bearish signal 🐻.
Index: Correction deepens 📉, support tests near—technical bear 🐻.
Intermarket: Yields/USD crush risk assets 💪—bearish tide.
Geopolitical: Trade wars ⚔️, regulation 🔍—negative catalysts pile up.
Sentiment: Fear takes hold 😟—bearish consensus builds.
Trends: Near/medium-term declines 📉, long-term hinges on recovery ⚖️.
Outlook: Moderately bearish 🌩️—tough sledding ahead.
⚠️Trading Alert : News Releases and Position Management 📰 🗞️ 🚫🚏
As a reminder, news releases can have a significant impact on market prices and volatility. To minimize potential losses and protect your running positions,
we recommend the following:
Avoid taking new trades during news releases
Use trailing stop-loss orders to protect your running positions and lock in profits
💖Supporting our robbery plan 💥Hit the Boost Button💥 will enable us to effortlessly make and steal money 💰💵. Boost the strength of our robbery team. Every day in this market make money with ease by using the Thief Trading Style.🏆💪🤝❤️🎉🚀
I'll see you soon with another heist plan, so stay tuned 🤑🐱👤🤗🤩

NASDAQ: Cyclical correction most likely completed. ATH by June?Nasdaq remains oversold both on its 1D (RSI = 25.630) and 1W (RSI = 28.851, MACD = -442.980, ADX = 36.399) technical outlook as yesterday's rally is being corrected today on strong technical selling. Long term it looks like this was a cyclical correction, reached -25%, hit the 3W MA50/1W MA200 zone (which has been the best buy entry in the past 10 years) that has most likely been completed. In addition, the 1W RSI is on the same oversold levels as May 16th 2022, the lowest it has been since 2008. According to the Fibonacci Channel Up, the market can hit 22,300 as early as June.
## If you like our free content follow our profile to get more daily ideas. ##
## Comments and likes are greatly appreciated. ##

SPX POSSIBLE RECOVERY UP TO 7000-7500first quarter wasn't bright for spx. but it can recover at moderate phase.

Nasdaq market analysis: 03-APRIL-2025Good morning Dear Traders! Join me for Nasdaq market analysis for the today. Share your charts, ask questions, and let's discuss trading strategies.

NASDAQ: Forming the bottom. Don't miss the 2025 rally to 28,000.Nasdaq is bearish on its 1D technical outlook (RSI = 35.342, MACD = -382.320, ADX = 38.919), headed towards oversold territory. 1W is also headed towards an oversold state (RSI = 36.953) as the price has crossed under the 1W MA50 and is approaching the 1W MA100. This is currently waiting at the bottom of the 2 year Channel Up. This 6 month correction is so far technically nothing but the bearish wave of this Channel Up and has been almost as strong (-15.89%) as the previous in July-Aug 2024.
Notice an key technical tendency here, no correction/bearish wave has ever crossed under the S1 level of two highs before. The current S1 is at 18,400. So taking those conditions into consideration as well as the fact that the 1W RSI is at the bottom of its Channel Down, we see this week as the bottom formation candle that will start a new bullish wave. The prior two such waves both made an incredibly symmetric rise of +52.60%, so expecting the same puts our target at TP = 28,000, most likely by December 2025-January 2026.
## If you like our free content follow our profile to get more daily ideas. ##
## Comments and likes are greatly appreciated. ##

Nasdaq insights: 26-MAR-2025Good morning, traders! As a seasoned price action trader, I'll share my Nasdaq insights to help you improve your trading skills.

NASDAQ: Short term Channel Up on critical Resistance.Nasdaq is neutral on its 1D technical outlook (RSI = 49.418, MACD = -276.610, ADX = 37.535) as it has recovered from the oversold state of 2 weeks ago. By doing so, it has formed a Channel Up on the 1H timeframe but as the price hit its top and the 1H RSI has formed a bearish divergence like the previous HH, it is possible to see a quick pullback. As long as the price stays inside the Channel Up, target the 1H MA200 (TP = 19,900). If it crosses above the top of the Channel Up, buy and target the R1 level (TP = 20,650).
## If you like our free content follow our profile to get more daily ideas. ##
## Comments and likes are greatly appreciated. ##

NASDAQ: 4H MA50 broke. Time for a full recovery.Nasdaq is still bearish on its 1D technical outlook (RSI = 39.669, MACD = -426.120, ADX = 56.837) but crossed above its 4H MA50. The last time a bearish wave of this Channel Down crossed above the 4H MA50 was on August 9th 2024. It was achieved again after an oversold 1D RSI bounce and initially hit the 0.786 Fibonacci level and then peaked on the 1.382 Fib extension. The trade is long, TP1 = 21,500 and TP2 = 23,400.
## If you like our free content follow our profile to get more daily ideas. ##
## Comments and likes are greatly appreciated. ##

NASDAQ: Oversold at the bottom of 8month Channel Up.Nasdaq is oversold on its 1D technical outlook (RSI = 26.693, MACD = -501.840, ADX = 53.670), which is the most oversold 1D RSI reading since August 15th 2015. In the meantime, it touched the HL bottom of the 8month Channel Up, a bearish wave that looks much like July 2025. The bullish wave that followed topped on the 1.382 Fibonacci extension. If candle closings are contained inside the Channel Up, we expect it to attract a lot of new buyers and initiate the new bullish wave to at least the same Fib. Long trade, TP = 23,400. A closing under the Channel Up, should test though the 1W MA100 (TP = 18,000).
## If you like our free content follow our profile to get more daily ideas. ##
## Comments and likes are greatly appreciated. ##

NASDAQ: 4H Death Cross always signals a rally.Nasdaq in bearish on its 1D technical outlook (RSI = 38.073, MACD = -289.260, ADX = 41.209) as the mid February bearish wave hit the bottom of the September Channel Up. The formation of a Death Cross on the 4H timeframe has favored buying inside this pattern. In the meantime, the 4H RSI has been rising while the price was correcting, indicating the presence of a Bullish Divergence. Buy and aim for another +16% rise (TP = 23,200).
## If you like our free content follow our profile to get more daily ideas. ##
## Comments and likes are greatly appreciated. ##

NASDAQ: Broke into the 2 year Support Zone.Nasdaq has turned bearish on its 1D technical outlook (RSI = 41/199, MACD = -42.030, ADX = 30.270) as the correction that started last Thursday hit the 1D MA100. The region between the 1D MA100 and 1D MA200 is the index's 2year Support Zone and has been a buy opportunity since February 2023. With the 1D RSI also on 6month lows, the current level is low enough to be a HL on the long term Channel Up, after which rallies to the 3.5 Fibonacci extension have started. Go long, TP = 24,000.
## If you like our free content follow our profile to get more daily ideas. ##
## Comments and likes are greatly appreciated. ##
