NASDAQ: Below the 1D MA100 after 8 months! Attention needed.Nasdaq crossed under the 1D MA100 today for the first time since January 20th (exactly eight months) with the 1D technicals turning bearish (RSI = 38.504, MACD = -53.900, ADX = 32.187). Following a much more hawkish than expected Fed yesterday, the market is taking this opportunity to take profits on a relief pull-back after what was basically a non-stop rise throughout the year.
From a purely technical perspective, the pattern that has the most probabilities to emerge is a Channel Down. Assuming a perfect symmetry on its LL legs, we expect the current wave to be the bearish leg that will take it on a -8.72% decline to the bottom of the Channel Down. We will sell as long as today's candle closes under the 1D MA100 and target a little over S2 (TP = 14,300).
## If you like our free content follow our profile to get more daily ideas. ##
## Comments and likes are greatly appreciated. ##
Nasdaqtrading

NASDAQ: This is the buy signal you're looking for.Nasdaq is on a neutral 1D technical timeframe (RSI = 54.797, MACD = 35.170, ADX = 44.268) as it remains below the LH trendline within the 4H MA50 and 4H MA200. Only yesterday did it make a HL at the bottom of the short term Channel Up. We don't know if that will be enough to sustain this bullish trend but the price managed to close over the 4H MA100 again (holding since August 29th).
However if the price closes above the LH trendline it will confirm the bullish trend much like it did on August 23rd. The 4H is on a Bullish Cross so we will be ready to buy this breakout. The target will be the top of the Channel Up at a +5.56% maximum extension (TP = 16,000).
## If you like our free content follow our profile to get more daily ideas. ##
## Comments and likes are greatly appreciated. ##

NASDAQ: Aiming at 16300 after this short consolidation.Nasdaq is on the fifth day of consolidation in a row, with the support of the 1D MA50. The 1D timeframe is on bullish technicals (RSI = 57.978, MACD = 55.620, ADX = 42.134) as the Channel Up since the start of the year is still intact. In fact the recent Bullish Cross on the 1D MACD has print a similar pattern to the March 13th bottom on the HL trendline of the Channel Up.
Consequently, this consolidation is similar to the 10day one from March 17th to 28th, both over Fibonacci 0.618. We consider this a buy signal, and we aim a little lower than the 1.382 Fibonacci extension (TP = 16,300).
## If you like our free content follow our profile to get more daily ideas. ##
## Comments and likes are greatly appreciated. ##

NASDAQ: Entering a consolidation zone.Nasdaq got rejected again on the 4H MA50 and as the 4H timeframe turned neutral (RSI = 49.851, MACD = -15.090, ADX = 34.425), it is highly likely to see the index entering a consolidation/ accumulation phase similar to April's and June's. Depending on its length, it may even create a new, less aggressive Channel Up.
The key for the uptrend to be maintained is to hold first the 4H MA200 and second the 1D MA50. We will buy once the price hits the bottom of the Channel Up and target its top (TP = 16,400).
Prior idea:
## If you like our free content follow our profile to get more daily ideas. ##
## Comments and likes are greatly appreciated. ##

NASDAQ: Approaching Target 1. Pullback and buy for the 2nd.Nasdaq maintains the four month Channel Up and despite the technically overbought 1D timeframe (RSI = 72.574, MACD = 282.680, ADX = 39.484) it shows no signs of pulling back. We will make the most out of this very aggressive trend. Our target from the previous analysis remains near the R2 (TP1 = 16,000) and after a pullback as on May 24th, we will buy again and target the R3 (TP2 = 16,690).
We will stop buying the pullbacks after both of the following conditions are met: the price crosses under the 4H MA50 and the 1D RSI under its HL trendline.
Prior idea:
## If you like our free content follow our profile to get more daily ideas. ##
## Comments and likes are greatly appreciated. ##

NASDAQ: Last drop before the rally.Nasdaq is on the 4th red 1D candle in a row with 4H technicals turning bearish (RSI = 42.946, MACD = -13.870, ADX = 40.063) while the 1D RSI is testing the HL trendline for the 4th time since December 28th 2022.
If it crosses it, we will have a first bearish warning that the 4H MA50 may break for the first time since April 25th, where we will sell and target the 1D MA50 (TP = 14,500). For as long as the 4H MA50 holds though, we will buy and target the R1 firstly (TP = 15,250) and the R2 (TP = 16,000) secondly.
Prior idea:
## If you like our free content follow our profile to get more daily ideas. ##
## Comments and likes are greatly appreciated. ##

NASDAQ: Hasn't yet completed its technical pullback.Nasdaq has been pulling back since the June 16th High, which was a HH on the Channel Up pattern, but this sequence isn't yet completed. The 1D time frame remains technically bullish (RSI = 62.049, MACD = 275.090, ADX = 32.676) but the price hasn't yet reached neither the bottom of the Channel Up nor the 4H MA50.
We remain short targeting that level (TP = 14,600) where we will turn bullish again (TP = 15,250) unless the 1D candle closes under the 4H MA50, in which scenario we will re-sell and target the 1D MA50 (TP = 14,300).
The 1D RSI however made a hit and rebound on the HL trendline that is in effect since December 28th 2022, so it is possible to see a rebound without going lower, so in that case only buy after the R1 breaks and target the R2 (16,000).
Prior idea:
## If you like our free content follow our profile to get more daily ideas. ##
## Comments and likes are greatly appreciated. ##

Nvidia will be necessary to step out of the relatively high triaNvidia will be necessary to step out of the relatively high triangle
This chart shows the weekly candle chart of Nvidia shares over the past year. The graph overlays the high and low points of November 2021 and October 2022, along with the corresponding golden section. As shown in the figure, the high points of Nvidia shares last week and this week were suppressed by 1.382 of the golden section in the figure! Nvidia's stock has accelerated since the middle of May 2023, and obviously the bull momentum has been released! In the future, it will be necessary to step out of the relatively high triangle and organize it before continuing to exert upward force!

NASDAQ: Correction aiming at the 4H MA200.Nasdaq reached the R1 (15,300) last week, a highly important benchmark as it is the March 2022 Top. Being overbought on the 1D timeframe (RSI = 71.117, MACD = 398.240, ADX = 42.100), the current correction comes as a natural consequence. The target is the bottom of the three month Channel Up. Ideally we aim at the 4H MA200 (TP = 14,600), which has been previously tested and held as Support on May 4th and April 25th.
Prior idea:
## If you like our free content follow our profile to get more daily ideas. ##
## Comments and likes are greatly appreciated. ##

NASDAQ Rejection on March 2022 High gives a strong sell signalNasdaq got rejected exactly upon touching the 15285 Resistance for the first time since the High of March 29th 2022.
This is a strong sell signal and can be confirmed after the RSI (1d) crosses under the MA line.
The long term pattern is a Channel Up since the beginning of March and the MA50 (1d) has been intact since March 15th, which makes the index exceedingly overbought.
Trading Plan:
1. Sell after the RSI (1d) crosses under the MA (white line).
Targets:
1. 14300 (Channel Up bottom and near Support 1).
2. Extend to 13520 only if we close a (1d) candle under the MA50 (1d).
Tips:
1. The RSI (1d) is printing a pattern similar to the tops of February 2nd and March 31st. Both reached the 1.618 Fibonacci level, which was our target on our last Nasdaq call (see chart below).
2. If we do break below the MA50 (1d), the MA100 (1d) could be a valid target as it has been untouched since January 20th.
Please like, follow and comment!!
Notes:
Past trading plan:

NASDAQ The weekly charts tells you what you need to knowNasdaq / US100 is approaching today Resistance A (15280), which is the High of March 2022.
The pace of the rally since the start of the year has been so strong, in fact since the week of April 24th the index has posted only green weekly candles (8 today), that the 1week RSI reached a level (76.75) it last hit almost 2 years ago (on August 24th 2020).
In the last 6 years, every time the 1week RSI hit that level, Nasdaq made a top and corrected either immediately or in a few weeks.
On all those times, there was a clear Support Zone for the RSI to place your buys (47.90 - 52.90).
Also on all cases the price corrected to at least the 1day MA50.
This isn't primarily an invitation to sell what is obviously a bullish trend but rather take some profit of the index (or shares) in order to lay off some risk and enter again at a better price as suggested by the 1week RSI and the 1day MA50.
Our long term target is the 16840 All Time High (Resistance B) by December.
Previous chart:
Follow us, like the idea and leave a comment below!!

NASDAQ: Approaching the March 2022 High on Fed week.Nasdaq is having an enormous rally since last December and the Double Bottom, with even the 1W time frame turning massively overbought (RSI = 74.522, MACD = 645.290, ADX = 53.716). The Double Bottom was formed on the Zone of the All Time High before the COVID crash. The market has filled a massive gap and this is why it has been rising so aggressively since the start of the year. History has shown that overbought levels can extend rallies for a short while before pull backs.
The Resistance ahead of us is R1 (15,280) and the Fed Rate Decision on Wednesday will be critical for the trend of the next 4-5 weeks. A closing above it can target the ATH regardless of the massively overbought technicals. A rejection can start a medium term decline near the Demand Zone. That would be the new entry point for long term investors.
## If you like our free content follow our profile to get more daily ideas. ##
## Comments and likes are greatly appreciated. ##

NASDAQ Potential Breakout Trade SetupNASDAQ is about to break its range please place buy and sell order to take trade.
Manage your risk accordingly.

NASDAQ: Bullish as long as the 4H MA100 holds.Nasdaq is having a standard technical pull back turning the 4H time frame neutral (RSI = 52.452, MACD = -2.890, ADX = 30.912) but the 1D remains bullish as since March 13th, the index has been trading inside a Channel Up pattern.
As the chart shows, every crossing under the 4H MA50 has been a buy signal (2 times) unless when the 4H MA100 broke as well, in which case the downtrend was extended to the 4H MA200 (2 times also). The 4H RSI has a clear Buy Zone and it just bounced on it, so we're already bullish (TP = 14,950). If though the 4H MA100 breaks, we will open a short term sell as well, targeting the bottom of the Channel Up (TP = 14,000), where upon contact with the 4H MA200 we will add a 2nd buy.
Prior idea:
## If you like our free content follow our profile to get more daily ideas. ##
## Comments and likes are greatly appreciated. ##

NASDAQ May be entering a short term correction waveNasdaq / NDX / US100 is near the top of the 6 month Channel Up.
Since the middle of that pattern, it started to form a narrower Channel Up.
So far we have had 3 correction waves inside the larger Channel Up, each less aggressive than the previous.
The 1day RSI is forming a Rising Resistance pattern same with the previous in February 2nd that priced the peak of the Channel Up.
Sell if the RSI crosses under its MA line.
Buy a little over the 1day MA50. Target 15280 (Resistance A, High of March 29th 2022).
Previous chart:
Follow us, like the idea and leave a comment below!!

NASDAQ There is still room to riseNasdaq has been on an incredible rise since March 24th after hitting the MA50 (4h).
The MACD pattern is trading on the same sequence as the March 7th-17th and January 12th-27th patterns that led to new Highs on the 1.618 Fibonacci.
The long term pattern remains a Channel Up.
Trading Plan:
1. Buy on the current market price.
Targets:
1. 15100 (marginally under the 1.618 Fibonacci extension and the 15285 High of March 29th 2022).
Tips:
1. There is a secondary Channel Up (dots) since March 13th. This may lead Nasdaq to a smoother (and lengthier) rise to 15100.
Please like, follow and comment!!
Notes:
Past trading plan:

NASDAQ: Overbought and in need of a technical pull-back.Nasdaq hit the 1.236 Fibonacci extension which was our target on the last call we gave and has turned overbought on the 1D time frame (RSI = 71.555, MACD = 292.250, ADX = 40.204). We are expecting a pull back to at least the 1D MA50 and the HL trend line. The most optimal buy signal will be when the 1D RSI touches its HL trend line. Next long term target is R1 and the 1.5 Fibonacci extension (TP = 15,300).
Prior idea:
## If you like our free content follow our profile to get more daily ideas. ##
## Comments and likes are greatly appreciated. ##

NASDAQ: Keep buying on pullbacks.Nasdaq has turned the Channel Up into a Rising Wedge on the 4H time frame with technicals healthy bullish (RSI = 60.461, MACD = 23.460, ADX = 25.411). The current rebound is on the 4H MA50 and every pullback is a buy opportunity, targeting the top of the Rising Wedge (TP = 13,450). If it closes under the 4H MA200, we will add a second buy, targeting the top of the Channel Up near R1 (TP = 13,650).
Prior idea:
## If you like our free content follow our profile to get more daily ideas. ##
## Comments and likes are greatly appreciated. ##

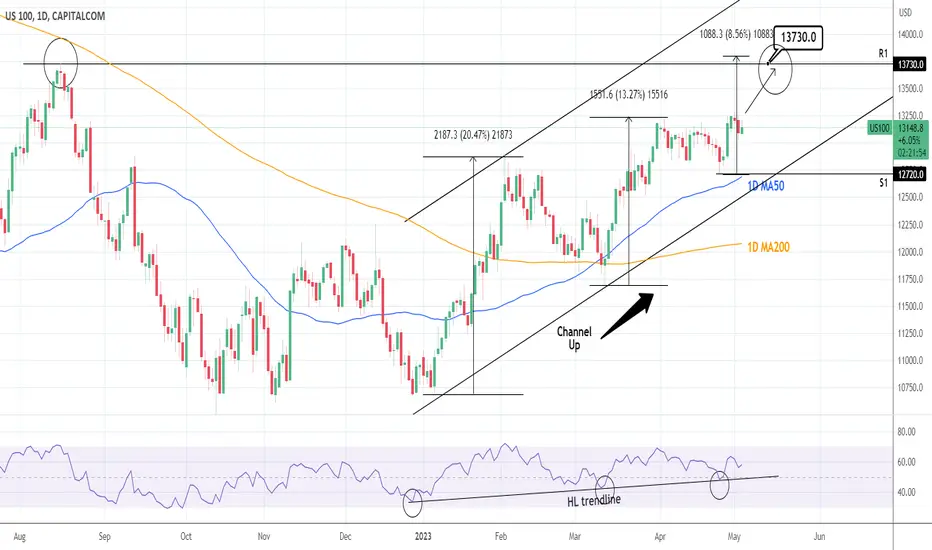
NASDAQ: About to fill the August 2022 Gap.Nasdaq is on a long term Channel Up with bullish technicals on the 1D timeframe (RSI = 56.673, MACD = 124.440, ADX = 30.096). In addition to those bullish indicators, it kept intact the 1D MA50 last week as Support, while also having the RSI rebound on the HL trendline. Consequently we remain bullish on Nasdaq long term (TP = 13,730), expecting it to hit R1 which is the August 16th 2022 Top. That would be a little less than a 8.50% rise from the April 25th Low, which represents the decreasing rate of growth on each Higher High (+20.50%, +13.30%, +8.50%).
Prior idea:
## If you like our free content follow our profile to get more daily ideas. ##
## Comments and likes are greatly appreciated. ##
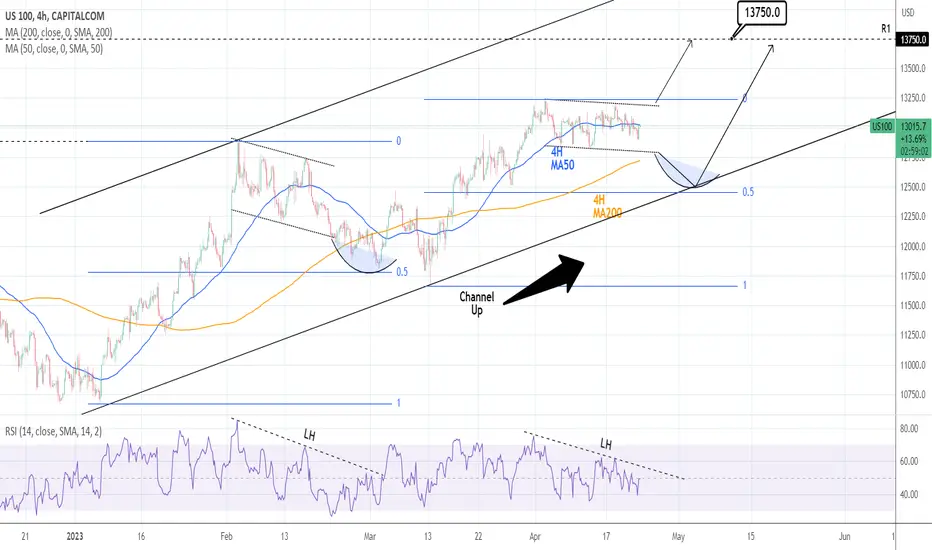
NASDAQ: Consolidating. Breakout and pullback levels to considerNasdaq is consolidating around the 4H MA50 for the past 2 weeks with 1D technicals turning neutral (RSI = 54.883, MACD = 132.650, ADX = 34.947) for the first time in 1 month. The LH trendline on the 4H RSI hints to comparisons with the February consolidation. That pattern broke under the 4H MA200 to the 0.5 Fibonacci level and then rebounded.
Consequently, we are either buying a potential breakout over the consolidation Channel or a pullback near the 0.5 Fibonacci. In either occasion we target the R1 (TP = 13,750).
Prior idea:
## If you like our free content follow our profile to get more daily ideas. ##
## Comments and likes are greatly appreciated. ##
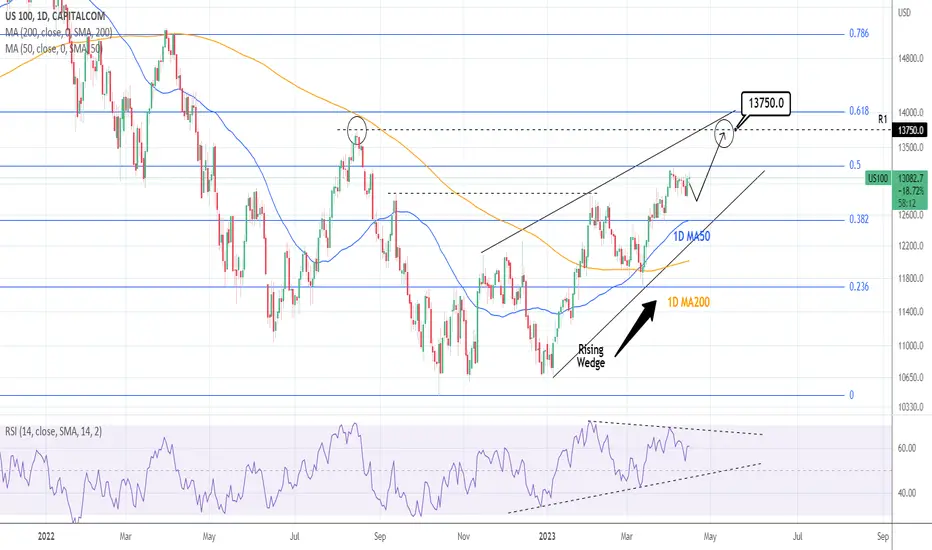
NASDAQ: Gap fill at 13,750 imminentNasdaq has completed a rather neutral week, after getting rejected on the 0.5 Fibonacci, accurately depicted on the mixed 1D technicals (RSI = 59.704, MACD = 168.310, ADX = 29.641). The Rising Wedge is leading the index towards the R1, the most important Gap Fill of August. As long as the 1D MA50 supports, we will stay bullish (TP = 13,750).
Prior idea:
## If you like our free content follow our profile to get more daily ideas. ##
## Comments and likes are greatly appreciated. ##
NASDAQ More likely going lower but buy above this levelNasdaq is on a long term Channel Up but currently on a short term Channel Down.
If the latter continues to replicate the February Channel Down, Nasdaq can dip as low as 12400.
If the price crosses over the recent 13250 High, then the above is invalidated.
In both cases buy and target 14000.
Follow us, like the idea and leave a comment below!!

NASDAQ: Short term buy opportunity.Nasdaq turned the 4H timeframe neutral (RSI = 45.569, MACD = 13.770, ADX = 42.721) as it hit the bottom of the Channel Up pattern, just under the 4H MA50. Given that the 4H RSI also hits its HL trendline, that becomes a strong buy opportunity on the short term.
There is also a HH trendline involved that has formed a Rising Wedge, so we set our Target on it and not based on the Channel Up (TP = 13,430).
Prior idea:
## If you like our free content follow our profile to get more daily ideas. ##
## Comments and likes are greatly appreciated. ##
