NATGAS Free Signal! Buy!
Hello,Traders!
NATGAS went down and
Almost reached the horizontal
Support of 3.014$ from where
We can enter a long trade
With the Take Profit of 3.066$
And the Stop Loss of 2.981$
Buy!
Comment and subscribe to help us grow!
Check out other forecasts below too!
Disclosure: I am part of Trade Nation's Influencer program and receive a monthly fee for using their TradingView charts in my analysis.
Natgas

Natural Gas | Oil | Dollar | Silver | Gold Price Forecast.Natural Gas | Oil | Dollar | Silver | Gold Price Forecast.
NYMEX:NG1! AMEX:UNG NYMEX:CL1! COMEX:GC1!

Natural Gas is in the Buying DirectionHello Traders
In This Chart NATGAS HOURLY Forex Forecast By FOREX PLANET
today NATGAS analysis 👆
🟢This Chart includes_ (NATGAS market update)
🟢What is The Next Opportunity on NATGAS Market
🟢how to Enter to the Valid Entry With Assurance Profit
This CHART is For Trader's that Want to Improve Their Technical Analysis Skills and Their Trading By Understanding How To Analyze The Market Using Multiple Timeframes and Understanding The Bigger Picture on the Charts
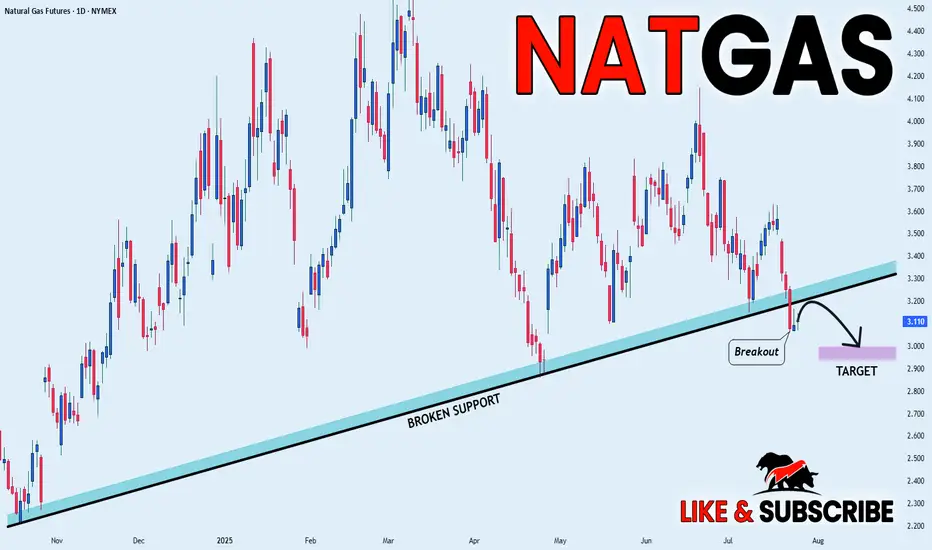
NATGAS BEARISH BREAKOUT|SHORT|
✅NATGAS broke the rising support
While trading in an local downtrend
Which makes me bearish
And I think that after the retest of the broken line is complete
A rebound and bearish continuation will follow
SHORT🔥
✅Like and subscribe to never miss a new idea!✅
Disclosure: I am part of Trade Nation's Influencer program and receive a monthly fee for using their TradingView charts in my analysis.
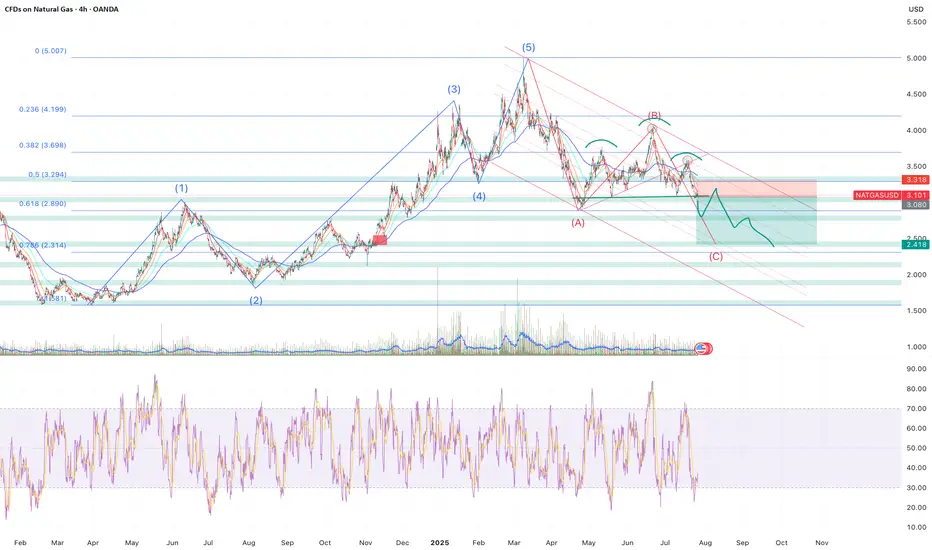
Sell NATGAS into OCT/NOVNatalie has fromed a H&S and has broke through all of the supporting EMAs leading to most of the indicators turning bearish.
My approach for the forseeable is seeling bounces until the winter season approaches.
Of course Natalie is extremely susceptible to trend changes due to economical data and has to be monitored closely. Currenlty I'm a bear.
Only selling once it breaks and retests, where I will once again reasses based on economics such as storage, production, imports and demand.
Target around $2.5 where interestingly a gap (red rectangle) sits from Nov - 24.
Elliot Wave (although not a great fan) kind of aligns as well as the 0.786 fib level which began forming at the beginning of 2024.
Storage | Volatility | Price Outlook
U.S. natural gas markets are stabilizing as volatility trends back toward seasonal norms.
📉 Volatility has dropped from 81% in Q4 2024 to 69% in mid-2025
🏪 Storage is currently at 3,075 Bcf,
🔻 4.7% lower YoY
🔺 5.9% higher than the 5-year average
🚢 LNG exports remain strong—up 22% YoY and 74% above the 5-year average
🔌 Domestic demand is seasonally weaker but steady
➡️ Despite being below last year’s levels, storage surplus vs. the 5-year average acts as a soft ceiling on price.
➡️ Historical analogs suggest a fair value range between $2.50–$3.20/MMBtu in the short term.
📊 Current price action around $3.00–$3.40 looks slightly overheated unless a fresh catalyst emerges (heatwave, export spike, etc.).
🧭 Watching for:
Injection trends over the next few weeks
Cooling demand in power sector
Resistance around $3.40
Support near $2.80
NATGAS Support Ahead! Buy!
Hello,Traders!
NATGAS keeps falling but
A strong horizontal support
Level is ahead at 3.00$ so
After Gas retests the support
We will be expecting a local
Bullish rebound
Buy!
Comment and subscribe to help us grow!
Check out other forecasts below too!
Disclosure: I am part of Trade Nation's Influencer program and receive a monthly fee for using their TradingView charts in my analysis.

NATGAS Trading Opportunity! SELL!
My dear followers,
This is my opinion on the NATGAS next move:
The asset is approaching an important pivot point 3.567
Bias - Bearish
Technical Indicators: Supper Trend generates a clear short signal while Pivot Point HL is currently determining the overall Bearish trend of the market.
Goal - 3.480
About Used Indicators:
For more efficient signals, super-trend is used in combination with other indicators like Pivot Points.
Disclosure: I am part of Trade Nation's Influencer program and receive a monthly fee for using their TradingView charts in my analysis.
———————————
WISH YOU ALL LUCK
Natural Gas | Oil | Dollar | Silver | Gold Price Forecast.Natural Gas | Oil | Dollar | Silver | Gold Price Forecast.
NYMEX:NG1! AMEX:UNG NYMEX:CL1! COMEX:GC1!

NATGAS REBOUND AHEAD|LONG|
✅NATGAS is going up now
And the price made a bullish
Rebound from the horizontal
Support level around 3.50$
So we are bullish biased and
We will be expecting a
Further bullish move up
LONG🚀
✅Like and subscribe to never miss a new idea!✅
Disclosure: I am part of Trade Nation's Influencer program and receive a monthly fee for using their TradingView charts in my analysis.
ATO Purchase: Natural GasAtmos Energy is one of the largest fully regulated natural gas utilities in the U.S., serving over 3 million customers across 8 states. It operates in a stable, recession-resistant sector with predictable cash flows and strong regulatory relationships.
$24B Infrastructure Investment Plan through 2029 to modernize pipelines and expand service
20 New Industrial Customers added recently, boosting demand
Strong Regulatory Framework ensures cost recovery and stable margins
EPS Growth Forecast: ~7.6% annually through 2029
Atmos Energy offers a low-risk, income-generating investment with:
Strong fundamentals
Reliable dividend growth
Long-term infrastructure tailwinds
Defensive positioning in volatile markets
GreenBlue Rank: 291/2500
GreenRed Rank: 3/3147

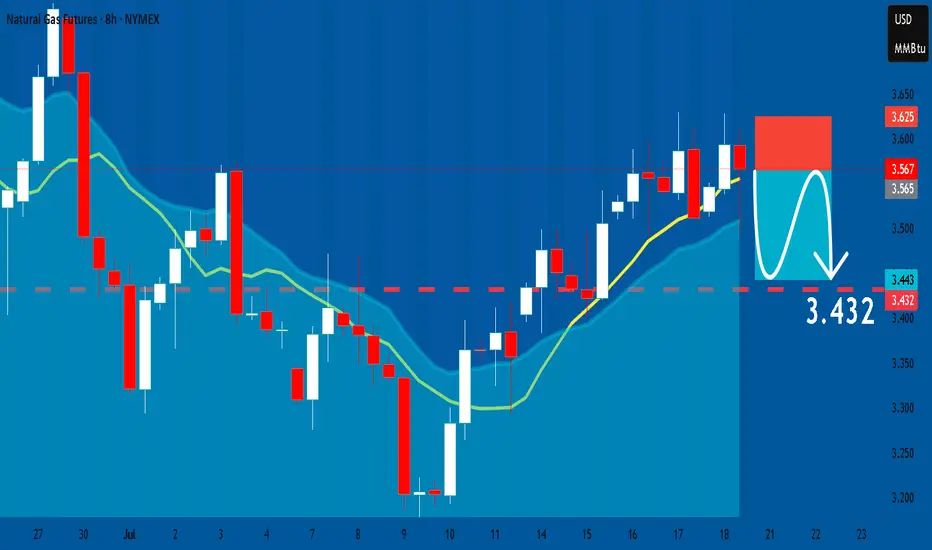
NATGAS: Bearish Continuation & Short Signal
NATGAS
- Classic bearish formation
- Our team expects fall
SUGGESTED TRADE:
Swing Trade
Sell NATGAS
Entry Level - 3.567
Sl - 3.625
Tp - 3.432
Our Risk - 1%
Start protection of your profits from lower levels
Disclosure: I am part of Trade Nation's Influencer program and receive a monthly fee for using their TradingView charts in my analysis.
❤️ Please, support our work with like & comment! ❤️
Gold | Oil | Dollar | Silver | Natural Gas July 2025 Forecast.Gold | Oil | Dollar | Silver | Natural Gas July 2025 Forecast.
NYMEX:NG1! COMEX:GC1! COMEX:SI1! NYMEX:CL1!

Natural Gas is in the Buying DirectionHello Traders
In This Chart NATGAS HOURLY Forex Forecast By FOREX PLANET
today NATGAS analysis 👆
🟢This Chart includes_ (NATGAS market update)
🟢What is The Next Opportunity on NATGAS Market
🟢how to Enter to the Valid Entry With Assurance Profit
This CHART is For Trader's that Want to Improve Their Technical Analysis Skills and Their Trading By Understanding How To Analyze The Market Using Multiple Timeframes and Understanding The Bigger Picture on the Charts

NATURAL GAS Best buy opportunity of the Channel Up.Natural Gas (NG1!) touched yesterday the bottom (Higher Lows trend-line) of the 1.5-year Channel Up, marginally below the 1D MA200 (orange trend-line) and is reacting so far today with a bullish tone.
If this evolves in a full-scale rebound, then technically it will be the pattern's new Bullish Leg. The previous one rose by +161.12% and a repeat of that will take this Leg back to the top of the Channel Up.
Our Target is marginally below that mark, on the 2.5 Fibonacci extension level at 6.800.
-------------------------------------------------------------------------------
** Please LIKE 👍, FOLLOW ✅, SHARE 🙌 and COMMENT ✍ if you enjoy this idea! Also share your ideas and charts in the comments section below! This is best way to keep it relevant, support us, keep the content here free and allow the idea to reach as many people as possible. **
-------------------------------------------------------------------------------
💸💸💸💸💸💸
👇 👇 👇 👇 👇 👇

NATGAS Support Ahead! Buy!
Hello,Traders!
NATGAS keeps falling but
The price will soon hit a
Horizontal support of 2.90$
From where we will be expecting
A local bullish rebound
Buy!
Comment and subscribe to help us grow!
Check out other forecasts below too!
Disclosure: I am part of Trade Nation's Influencer program and receive a monthly fee for using their TradingView charts in my analysis.

Gold | Oil | Dollar | Silver | Natural Gas July 2025 Forecast.July 2025 Forecast.
Gold | Oil | Dollar | Silver | Natural Gas
NYMEX:NG1! COMEX:GC1! COMEX:SI1! AMEX:UNG

NATGAS My Opinion! BUY!
My dear followers,
This is my opinion on the NATGASnext move:
The asset is approaching an important pivot point 3.387
Bias - Bullish
Safe Stop Loss - 3.269
Technical Indicators: Supper Trend generates a clear long signal while Pivot Point HL is currently determining the overall Bullish trend of the market.
Goal - 3.630
About Used Indicators:
For more efficient signals, super-trend is used in combination with other indicators like Pivot Points.
Disclosure: I am part of Trade Nation's Influencer program and receive a monthly fee for using their TradingView charts in my analysis.
———————————
WISH YOU ALL LUCK

NATURAL GAS (NATGASUSD): Bullish Outlook Explained
Natural Gas is trading in a mid-term bullish trend on a daily.
The price updates higher highs and higher lows after each
test of a rising support line.
Its last test made the market form a strong rejection first
and a bullish engulfing candle then.
The market may continue growing and reach at least 3.7 resistance soon.
❤️Please, support my work with like, thank you!❤️

Gold | Oil | Dollar | Silver | Natural Gas Price Forecast.Gold | Oil | Dollar | Silver | Natural Gas Price Forecast.
NYMEX:NG1! COMEX:GC1! AMEX:UNG COMEX:SI1!

Natural Gas is in the Buying DirectionHello Traders
In This Chart NATGAS HOURLY Forex Forecast By FOREX PLANET
today NATGAS analysis 👆
🟢This Chart includes_ (NATGAS market update)
🟢What is The Next Opportunity on NATGAS Market
🟢how to Enter to the Valid Entry With Assurance Profit
This CHART is For Trader's that Want to Improve Their Technical Analysis Skills and Their Trading By Understanding How To Analyze The Market Using Multiple Timeframes and Understanding The Bigger Picture on the Charts

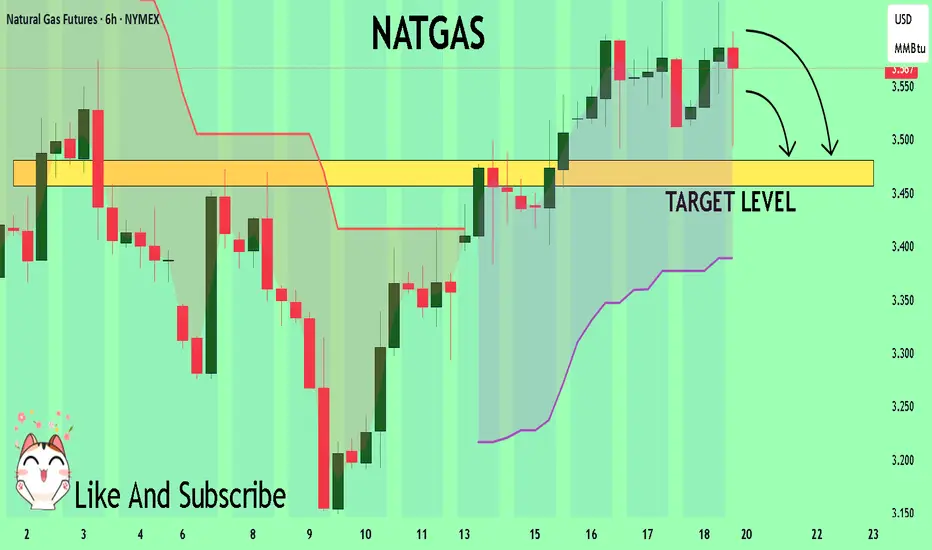
NATGAS: Forecast & Trading Plan
The analysis of the NATGAS chart clearly shows us that the pair is finally about to tank due to the rising pressure from the sellers.
Disclosure: I am part of Trade Nation's Influencer program and receive a monthly fee for using their TradingView charts in my analysis.
❤️ Please, support our work with like & comment! ❤️

NATGAS Will Collapse! SELL!
My dear friends,
Please, find my technical outlook for NATGAS below:
The instrument tests an important psychological level 3.896
Bias - Bearish
Technical Indicators: Supper Trend gives a precise Bearish signal, while Pivot Point HL predicts price changes and potential reversals in the market.
Target - 3.662
Recommended Stop Loss - 4.034
About Used Indicators:
Super-trend indicator is more useful in trending markets where there are clear uptrends and downtrends in price.
Disclosure: I am part of Trade Nation's Influencer program and receive a monthly fee for using their TradingView charts in my analysis.
———————————
WISH YOU ALL LUCK

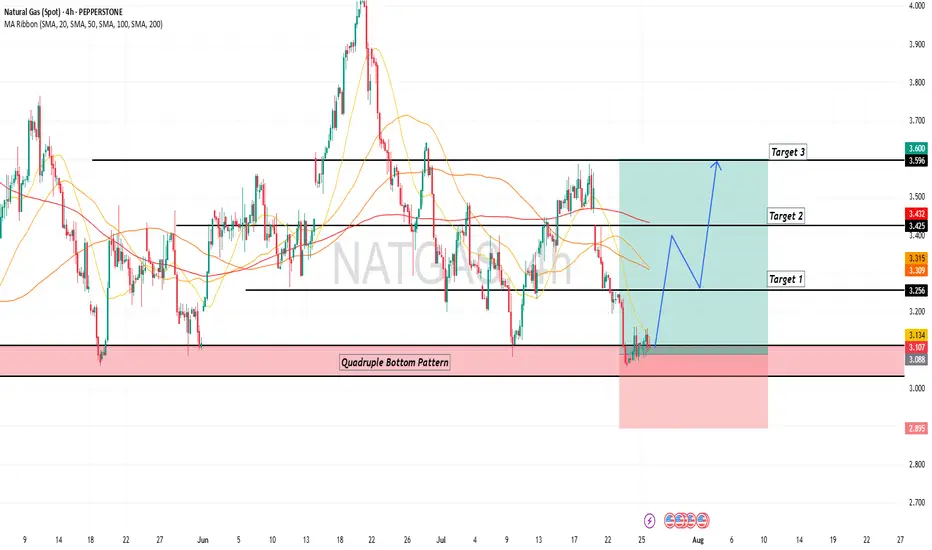
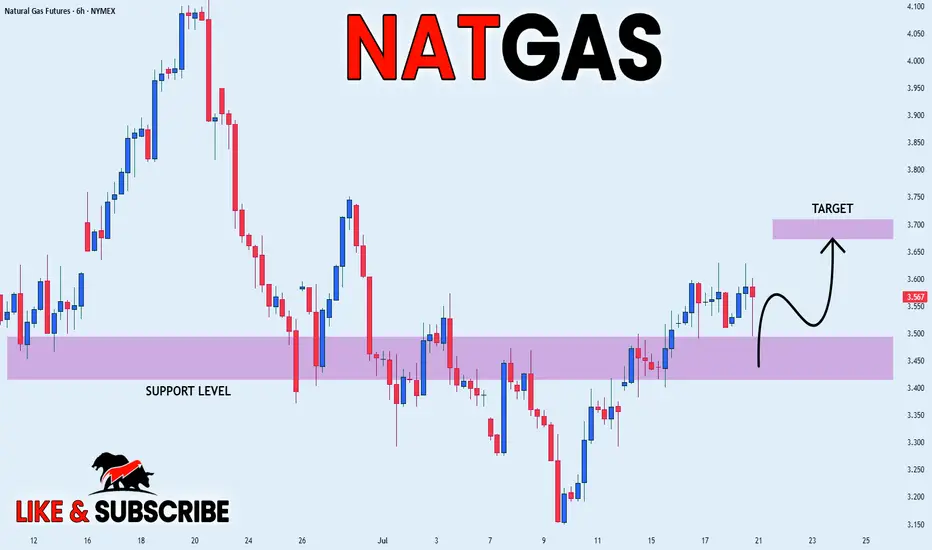
NATGAS SUPPORT AHEAD|LONG|
✅NATGAS is going down now
But a strong support level is ahead at 3.450$
Thus I am expecting a rebound
And a move up towards the target of 3.600$
LONG🚀
✅Like and subscribe to never miss a new idea!✅
Disclosure: I am part of Trade Nation's Influencer program and receive a monthly fee for using their TradingView charts in my analysis.
